Prometheus 整合 AlertManager
简介
Alertmanager 主要用于接收 Prometheus 发送的告警信息,它很容易做到告警信息的去重,降噪,分组,策略路由,是一款前卫的告警通知系统。它支持丰富的告警通知渠道,可以将告警信息转发到邮箱、企业微信、钉钉等。这一节讲解利用AlertManager,把接受到的告警信息,转发到邮箱。
实验
准备
启动 http-simulator 度量模拟器:
docker run --name http-simulator -d -p 8080:8080 pierrevincent/prom-http-simulator:0.1
启动 Prometheus,为了方便更新配置,使用挂载配置文件的方式:
docker run --name prometheus -d -p 9090:9090 -v /Users/huanchu/Documents/prometheus-data:/prometheus-data \

       prom/prometheus --web.enable-lifecycle --config.file=/prometheus-data/prometheus.yml
启动添加了参数 --web.enable-lifecycle,让Prometheus支持通过web端点动态更新配置。
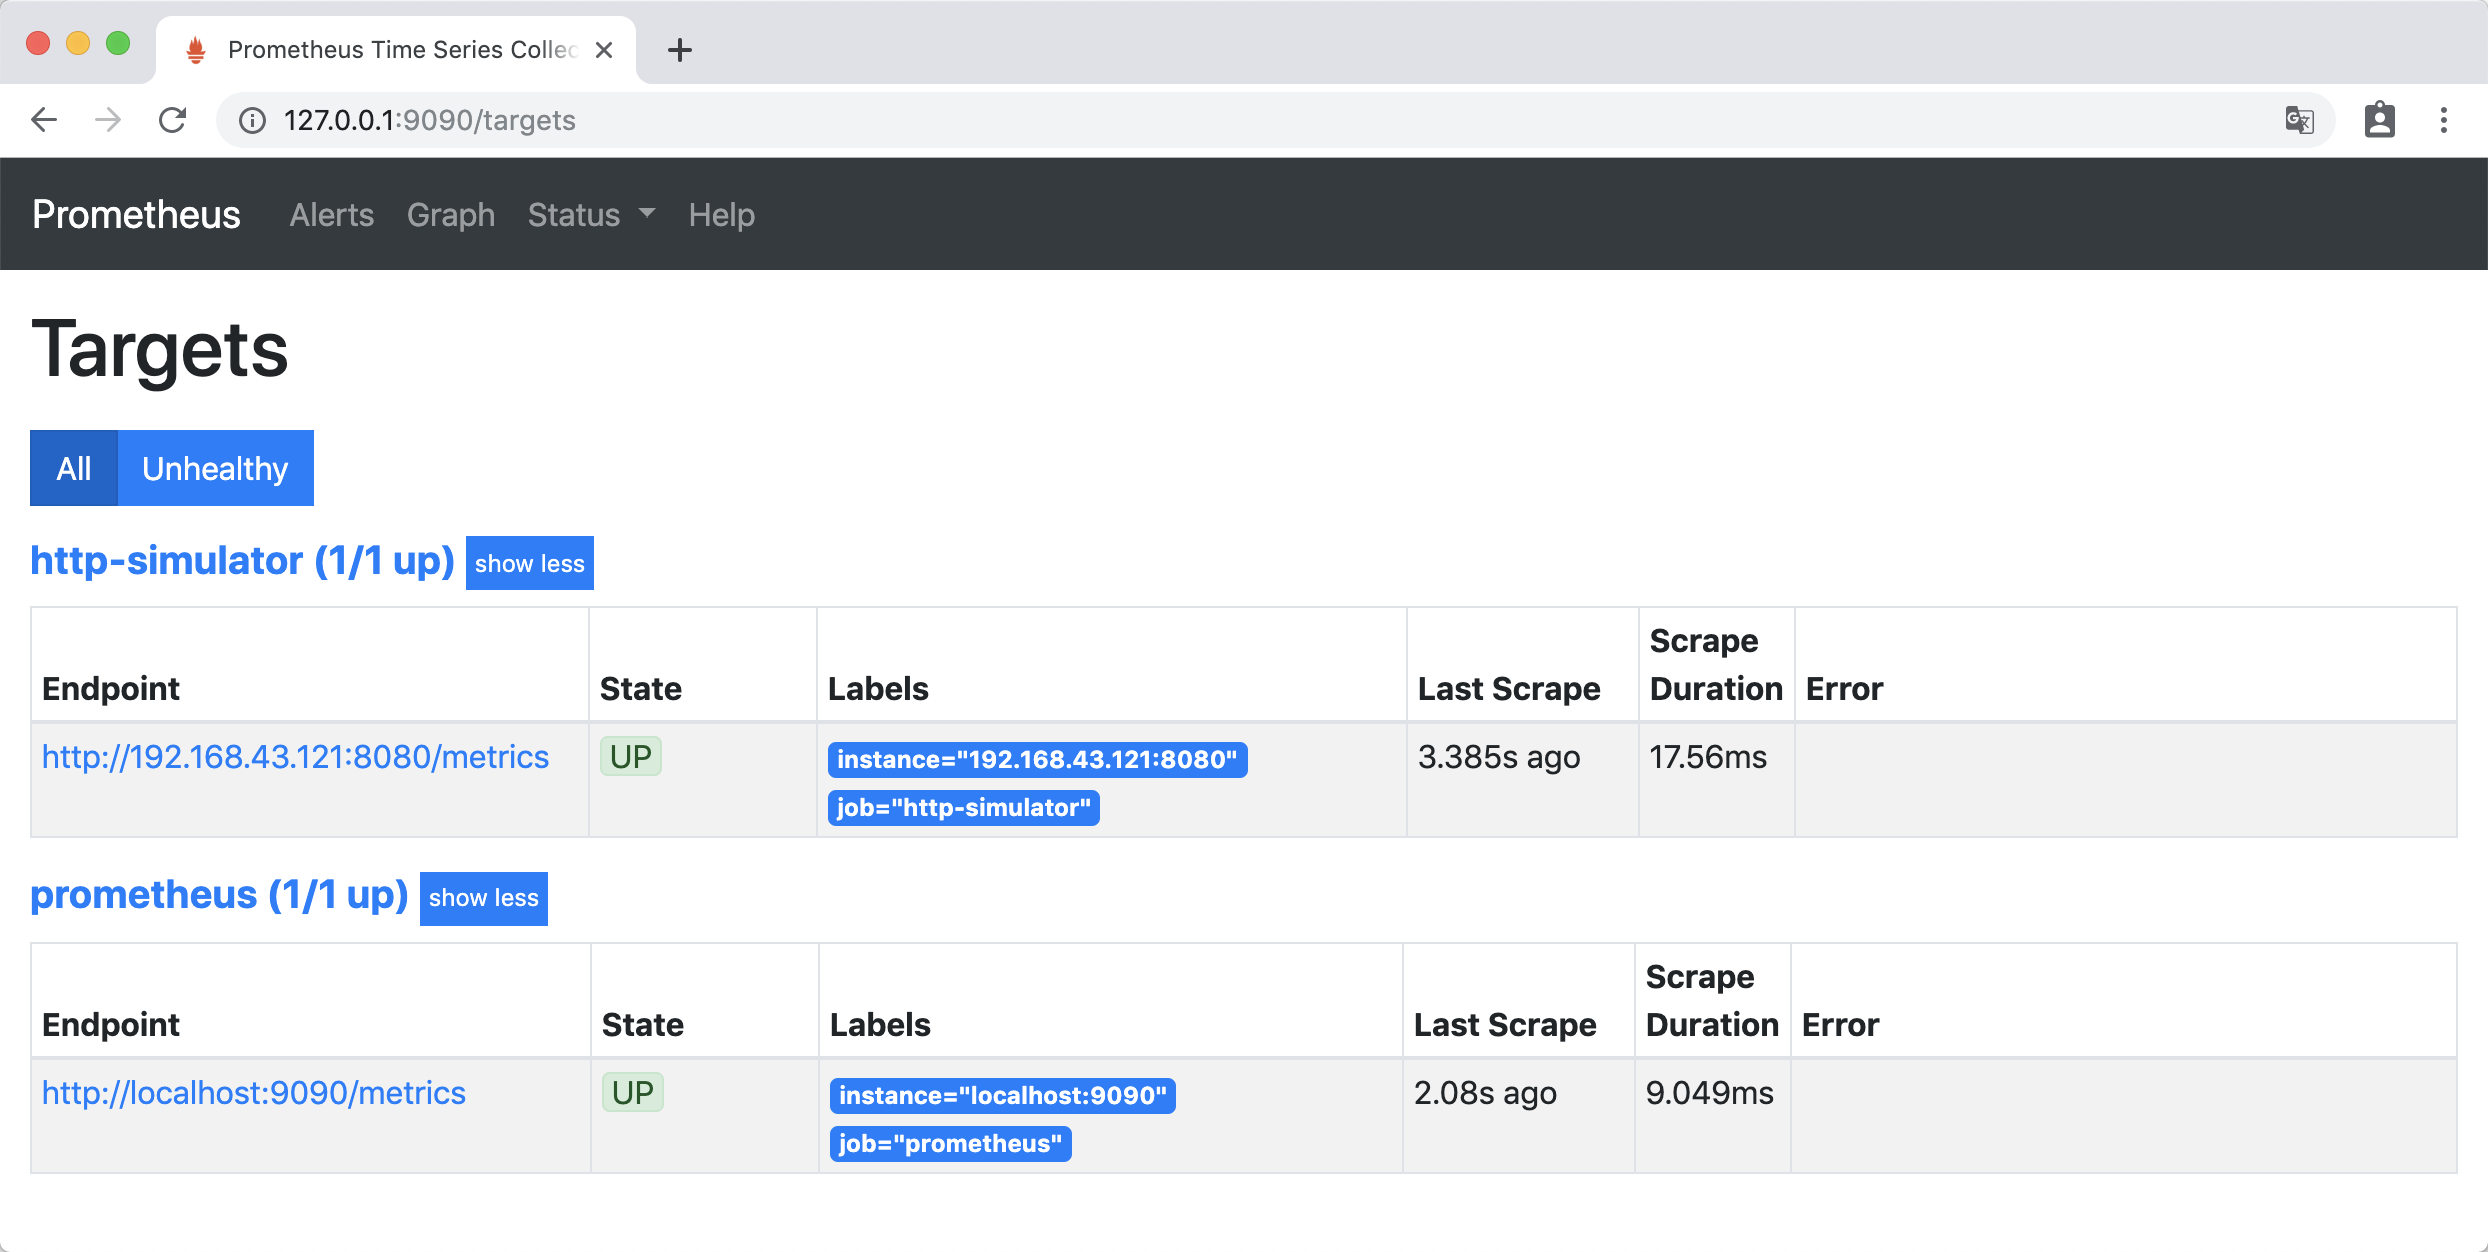
访问http://127.0.0.1:9090/targets ,Prometheus 自身的 metrics 和 http-simulator 的 metrics 处于up 状态 ,那么准备工作就做好了。
实验
实验1
告警配置
在prometheus-data文件夹下,创建告警配置文件 simulator_alert_rules.yml:
groups:

- name: simulator-alert-rule

  rules:

  - alert: HttpSimulatorDown

    expr: sum(up{job="http-simulator"}) == 0

    for: 1m

    labels:

      severity: critical
配置文件的意思是 http-simulator 服务up状态为 0 ,并且持续1分钟时,产生告警 ,级别为 “严重的”。
修改prometheus.yml,引用simulator_alert_rules.yml文件,prometheus.yml 内容如下:
global:

  scrape_interval: 5s

  evaluation_interval: 5s

  scrape_timeout: 5s

rule_files:

  - "simulator_alert_rules.yml"

scrape_configs:

  - job_name: 'prometheus'

    static_configs:

    - targets: ['localhost:9090']

  - job_name: 'http-simulator'

    metrics_path: /metrics

    static_configs:

    - targets: ['192.168.43.121:8080']
更新Prometheus配置:
curl -X POST http://localhost:9090/-/reload
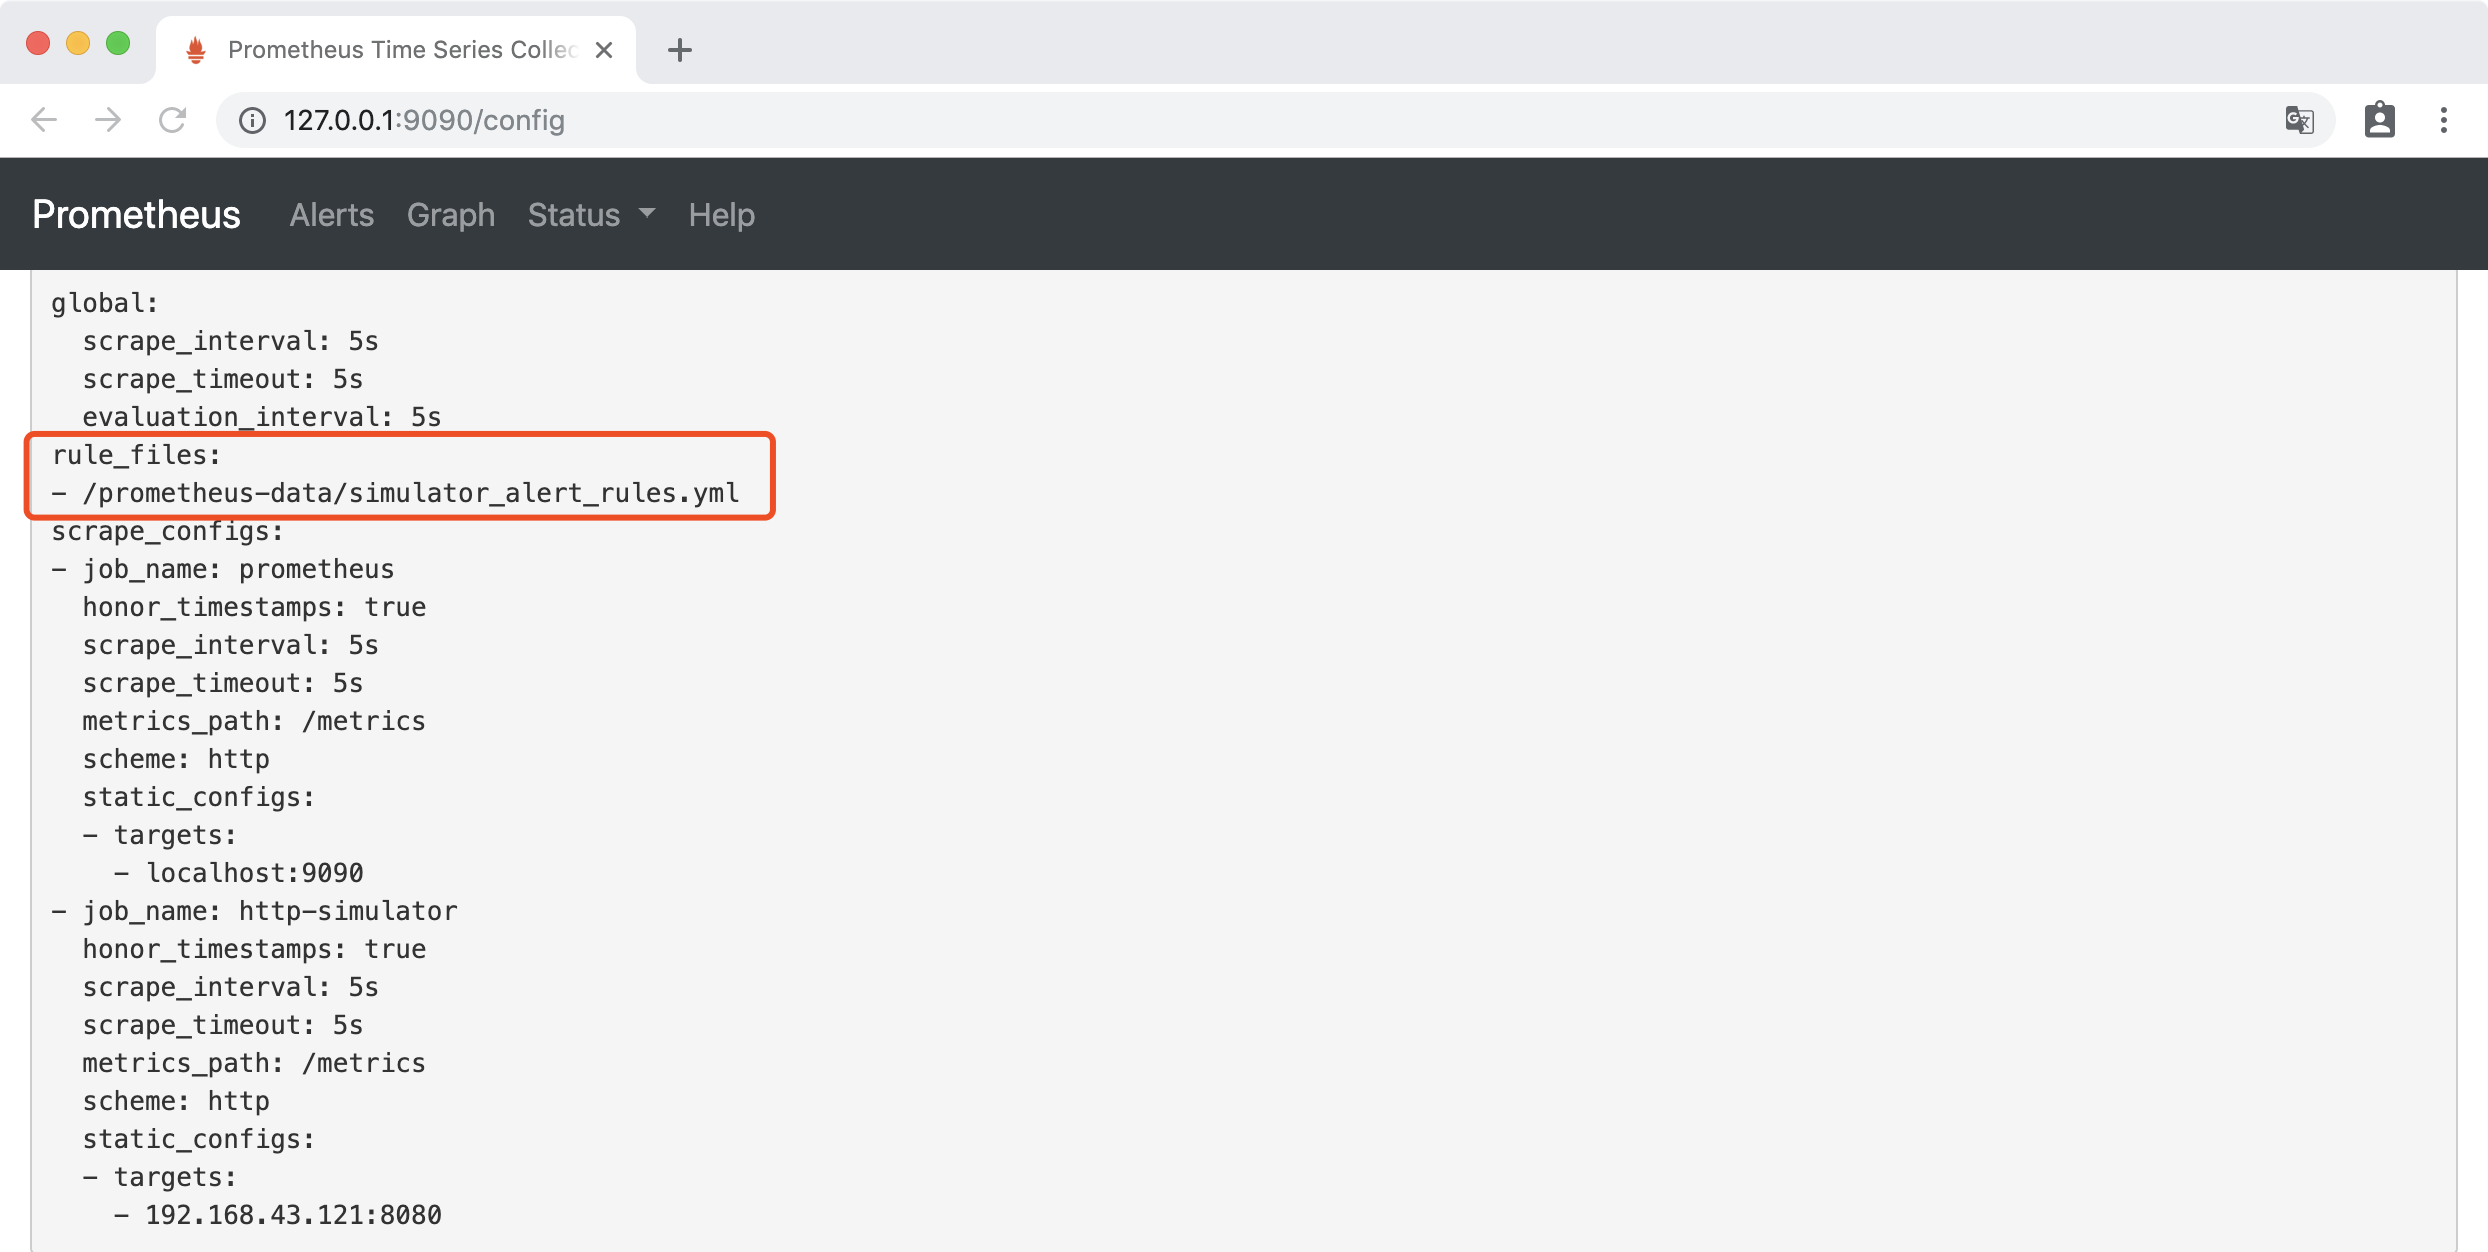
访问http://127.0.0.1:9090/config,可以看到已经为更新了配置:
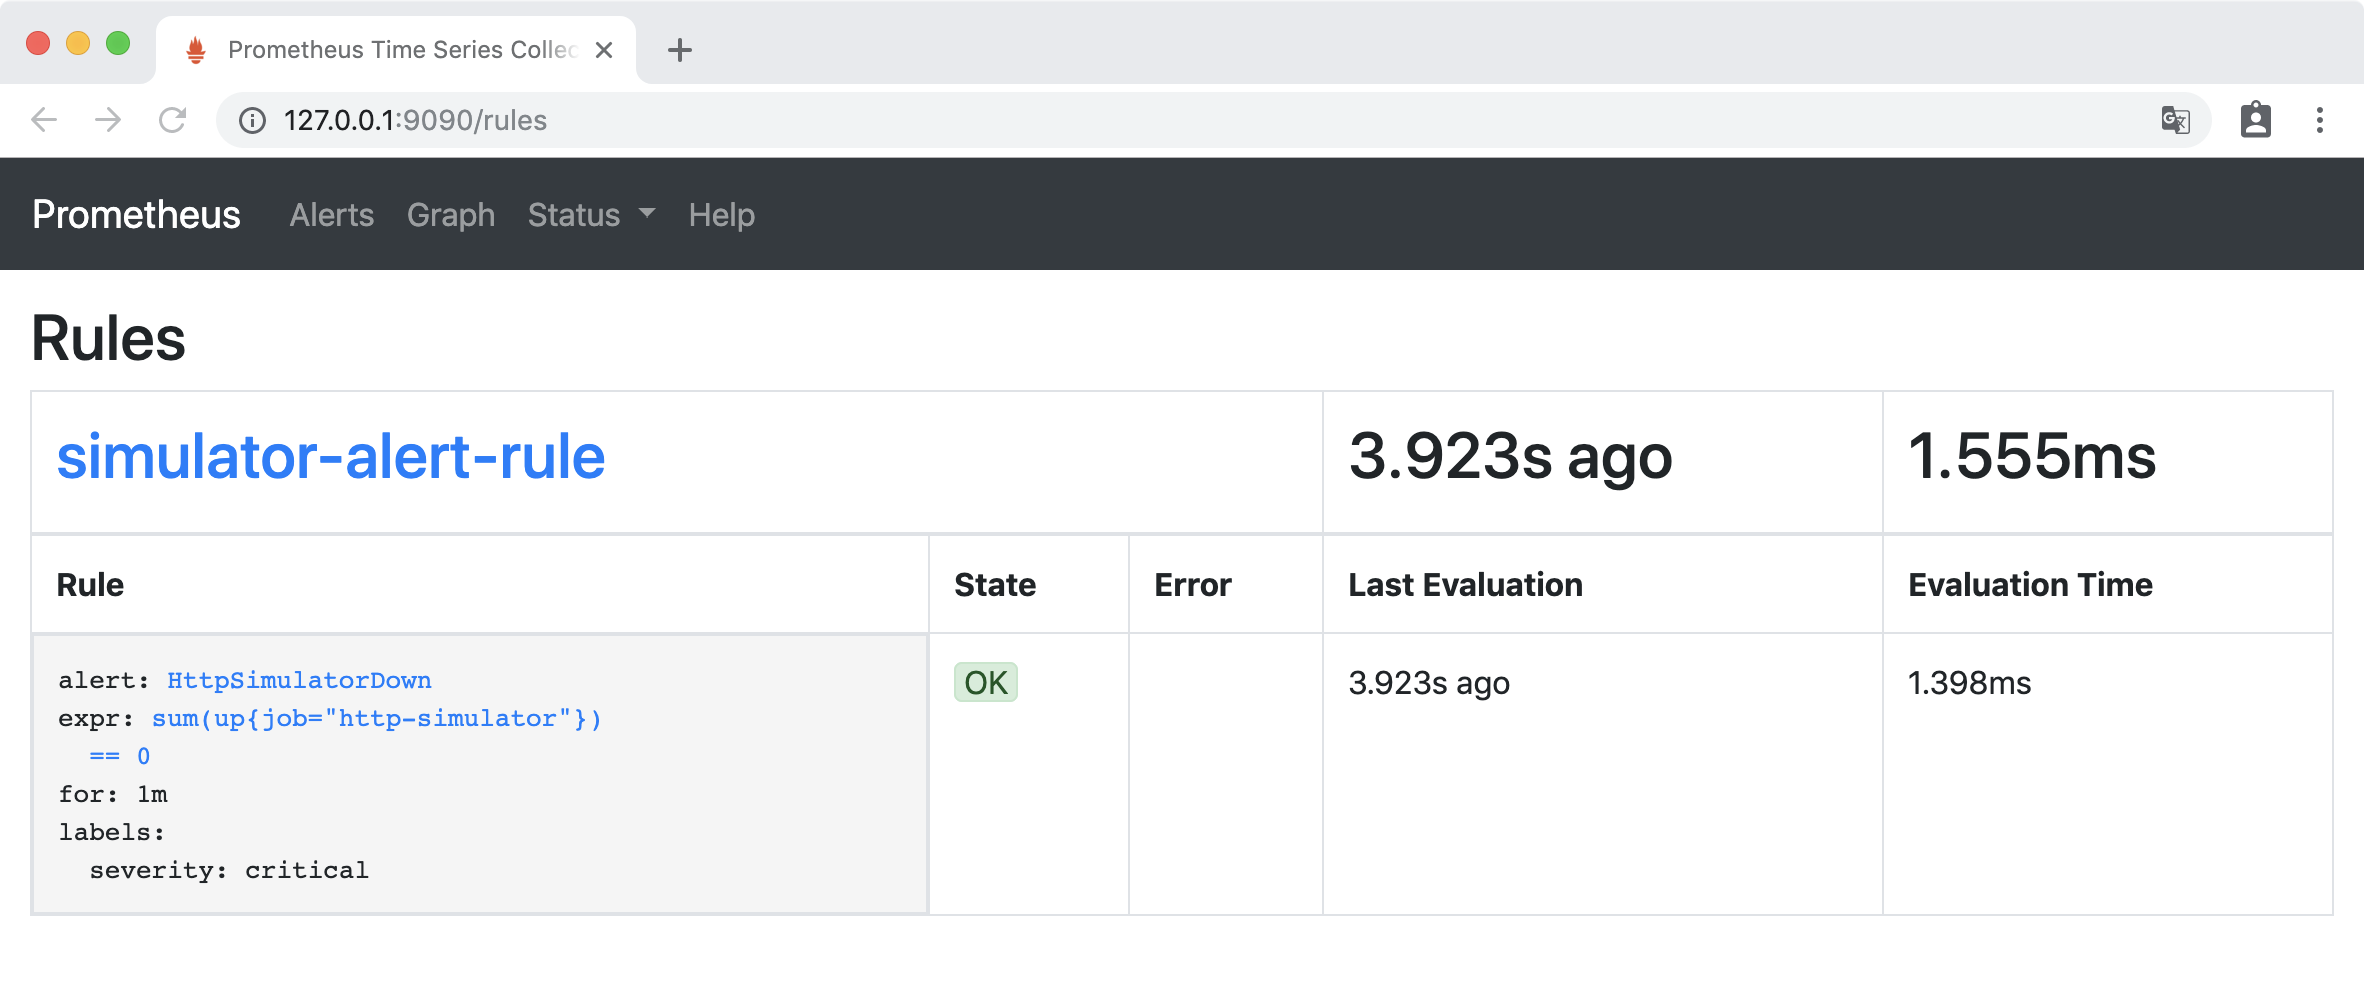
访问http://127.0.0.1:9090/rules,Rules 下出现了新添加的告警规则:
验证
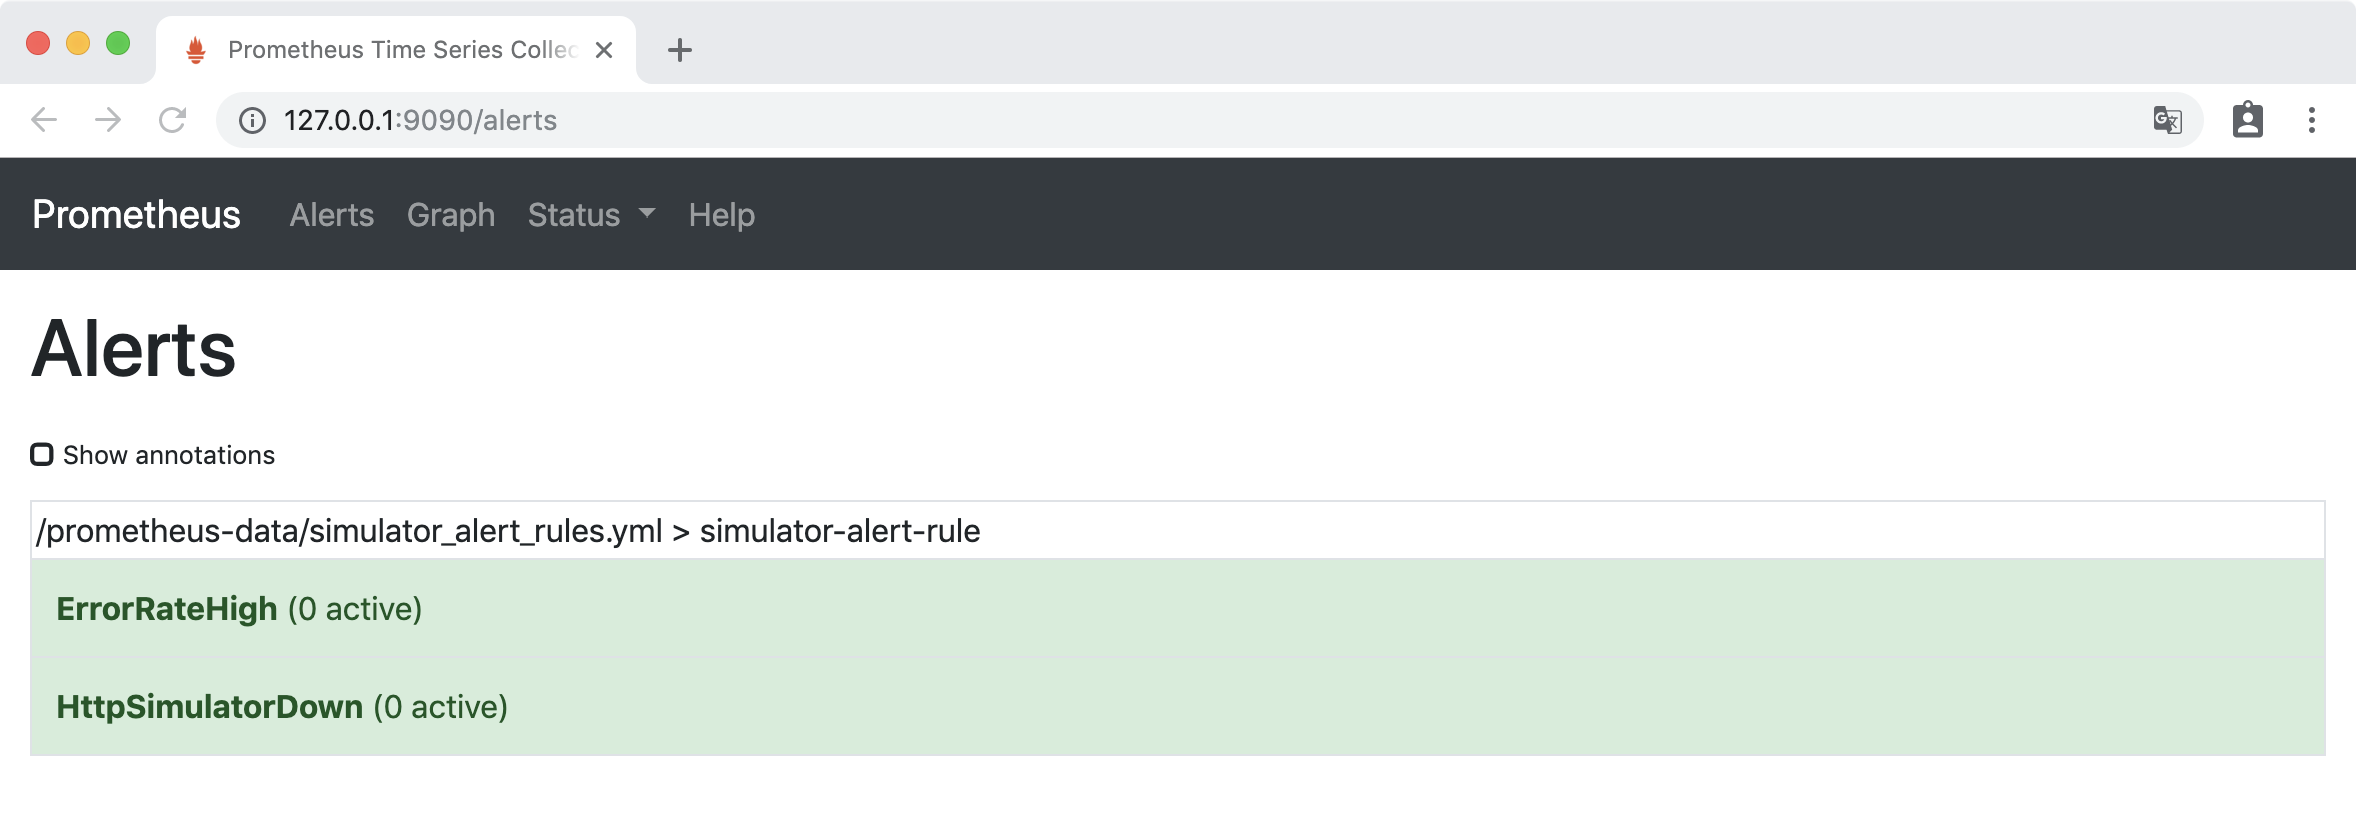
访问http://127.0.0.1:9090/alerts ,Alerts 下 HttpSimulatorDown 为绿色,处于INACTIVE 状态,表示什么都没有发生。

关闭 http-simulator 服务:
docker stop http-simulator
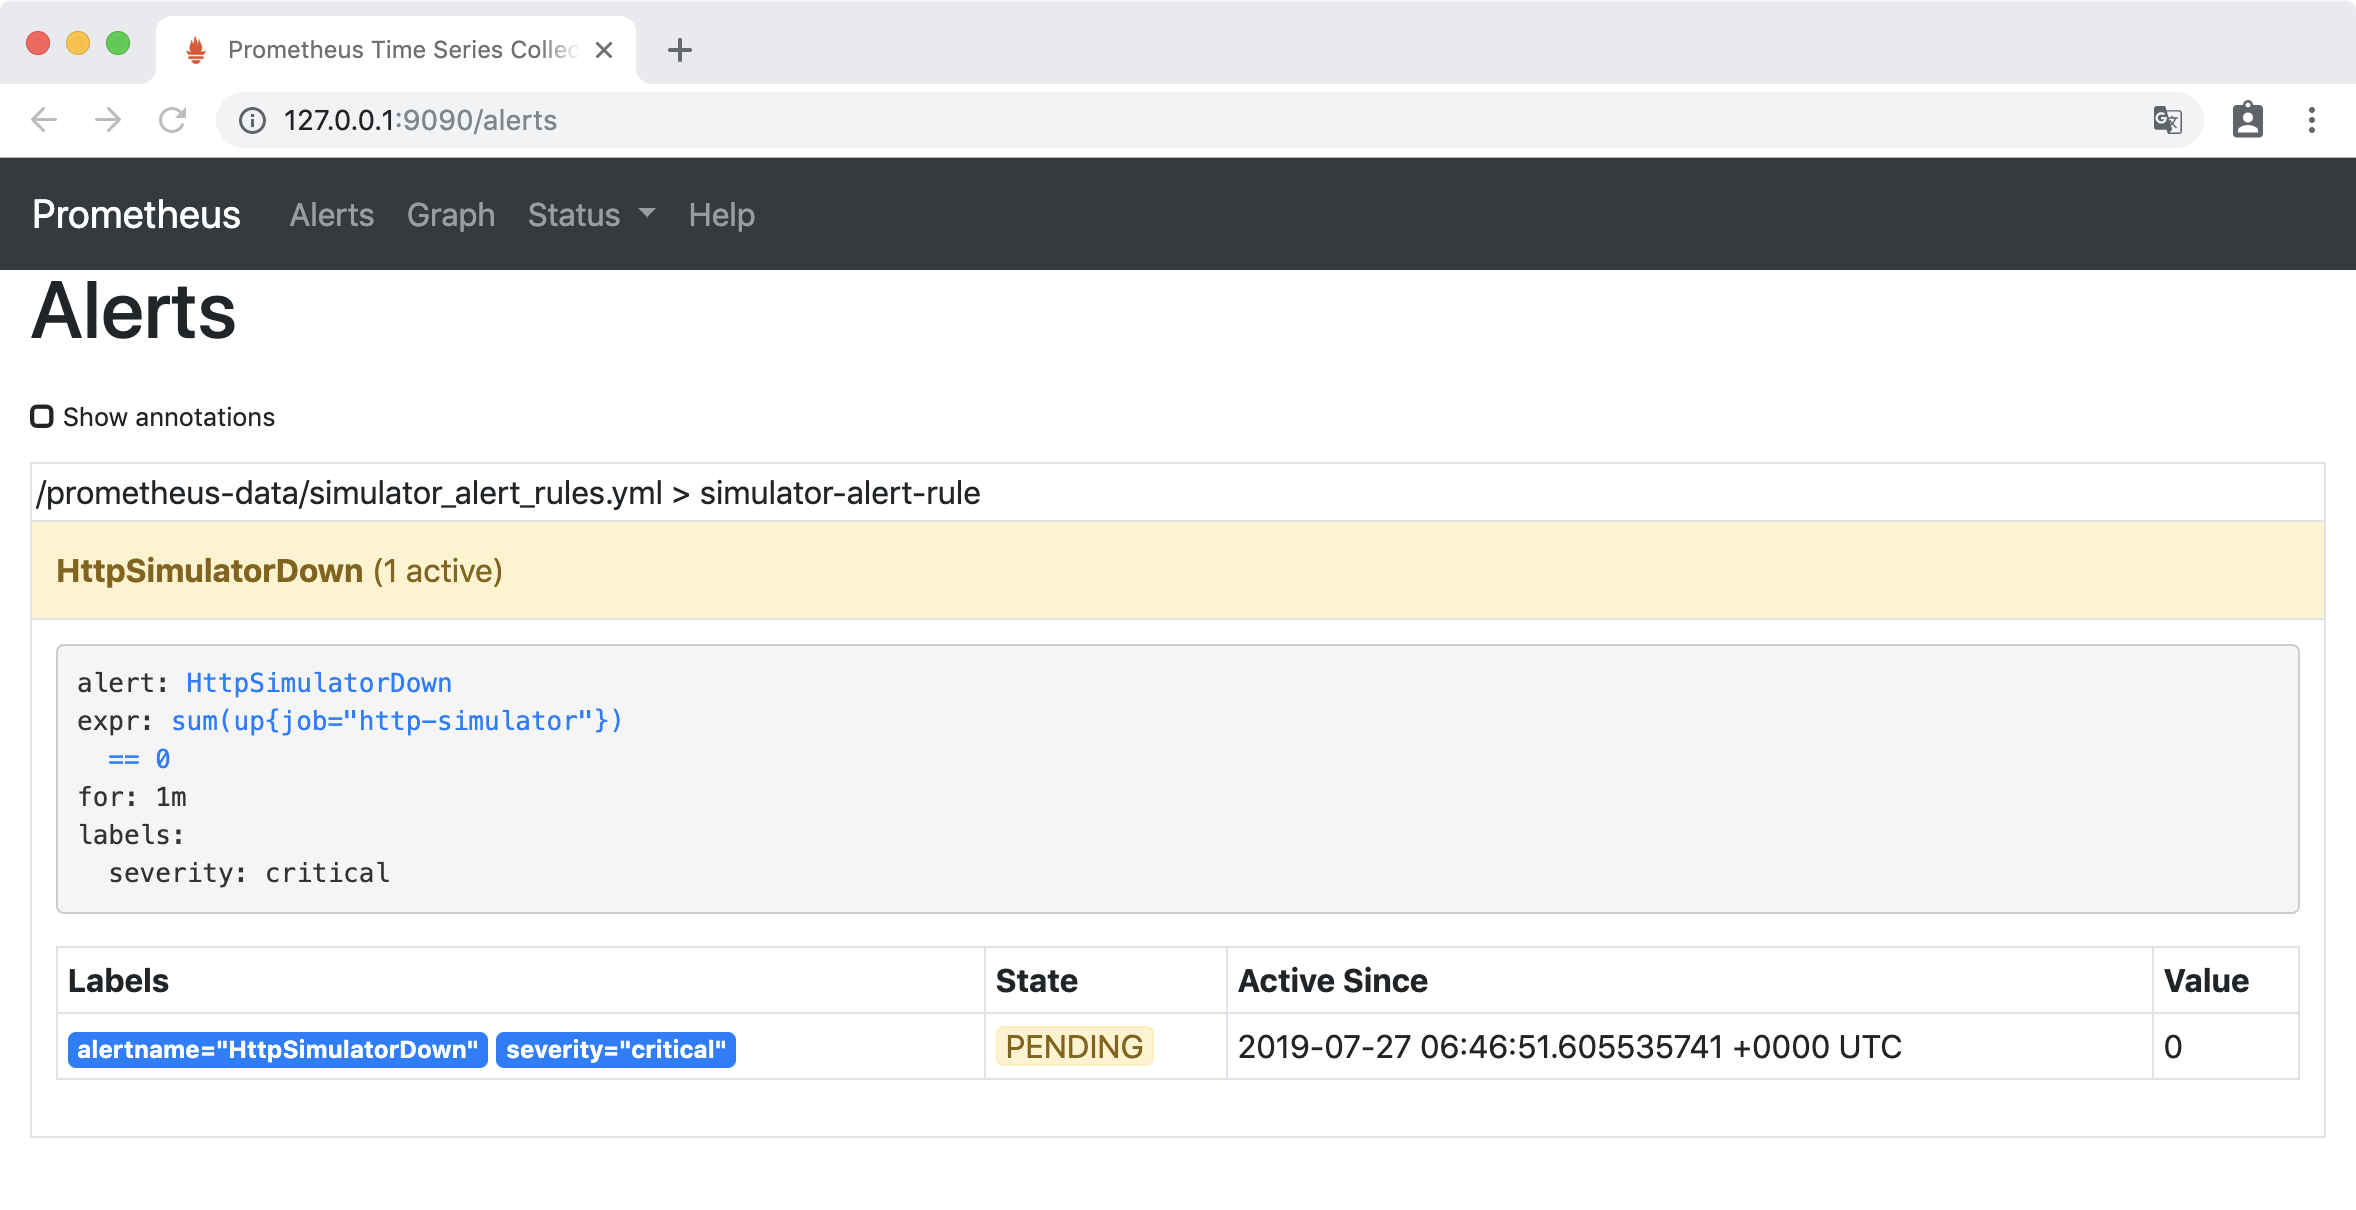
访问http://127.0.0.1:9090/alerts,HttpSimulatorDown 变成黄色,处于 PENDING 状态,表示报警即将被激活。
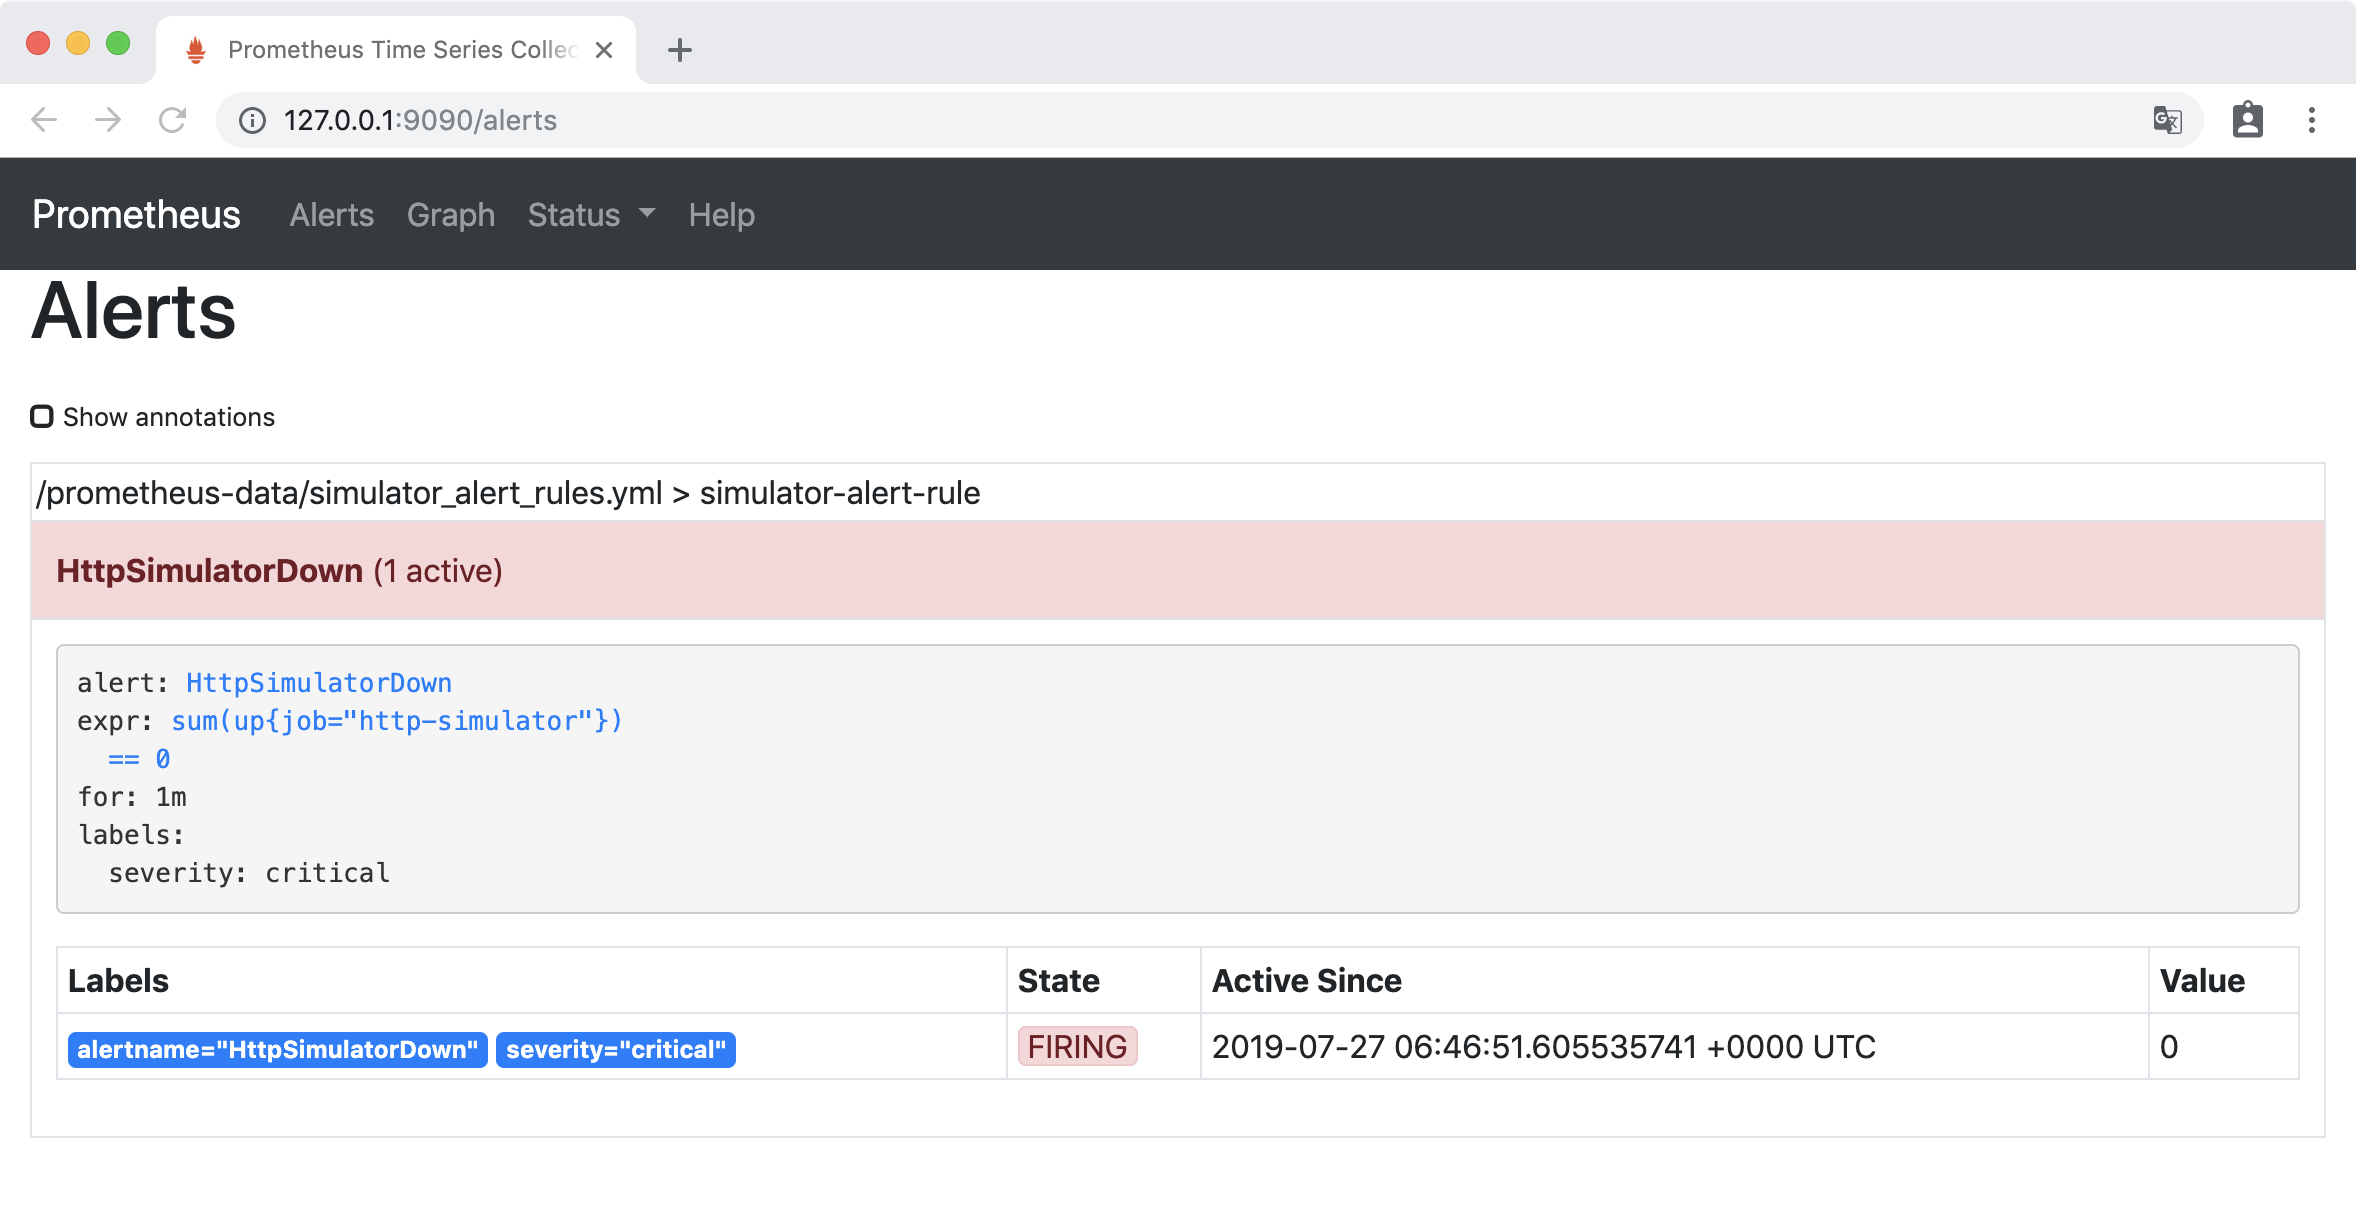
一分钟后,HttpSimulatorDown 变成红色,处于 FIRING 状态,表示报警已经被激活了。
实验2
告警配置
在simulator_alert_rules.yml文件中增加告警配置:
- alert: ErrorRateHigh

    expr: sum(rate(http_requests_total{job="http-simulator", status="500"}[5m])) / sum(rate(http_requests_total{job="http-simulator"}[5m])) > 0.02

    for: 1m

    labels:

      severity: major

    annotations:

      summary: "High Error Rate detected"

      description: "Error Rate is above 2% (current value is: {{ $value }}"
配置文件的意思是 http-simulator 请求的错误率对2% ,并且持续1分钟时,产生告警 ,级别为 “非常严重的”
更新Prometheus配置:
curl -X POST http://localhost:9090/-/reload
验证
访问http://127.0.0.1:9090/alerts,ErrorRateHigh 为绿色的 INACTIVE 状态。
把 http-simulator 的错误率调到 10%
curl -H 'Content-Type: application/json' -X PUT -d '{"error_rate": 10}' http://localhost:8080/error_rate
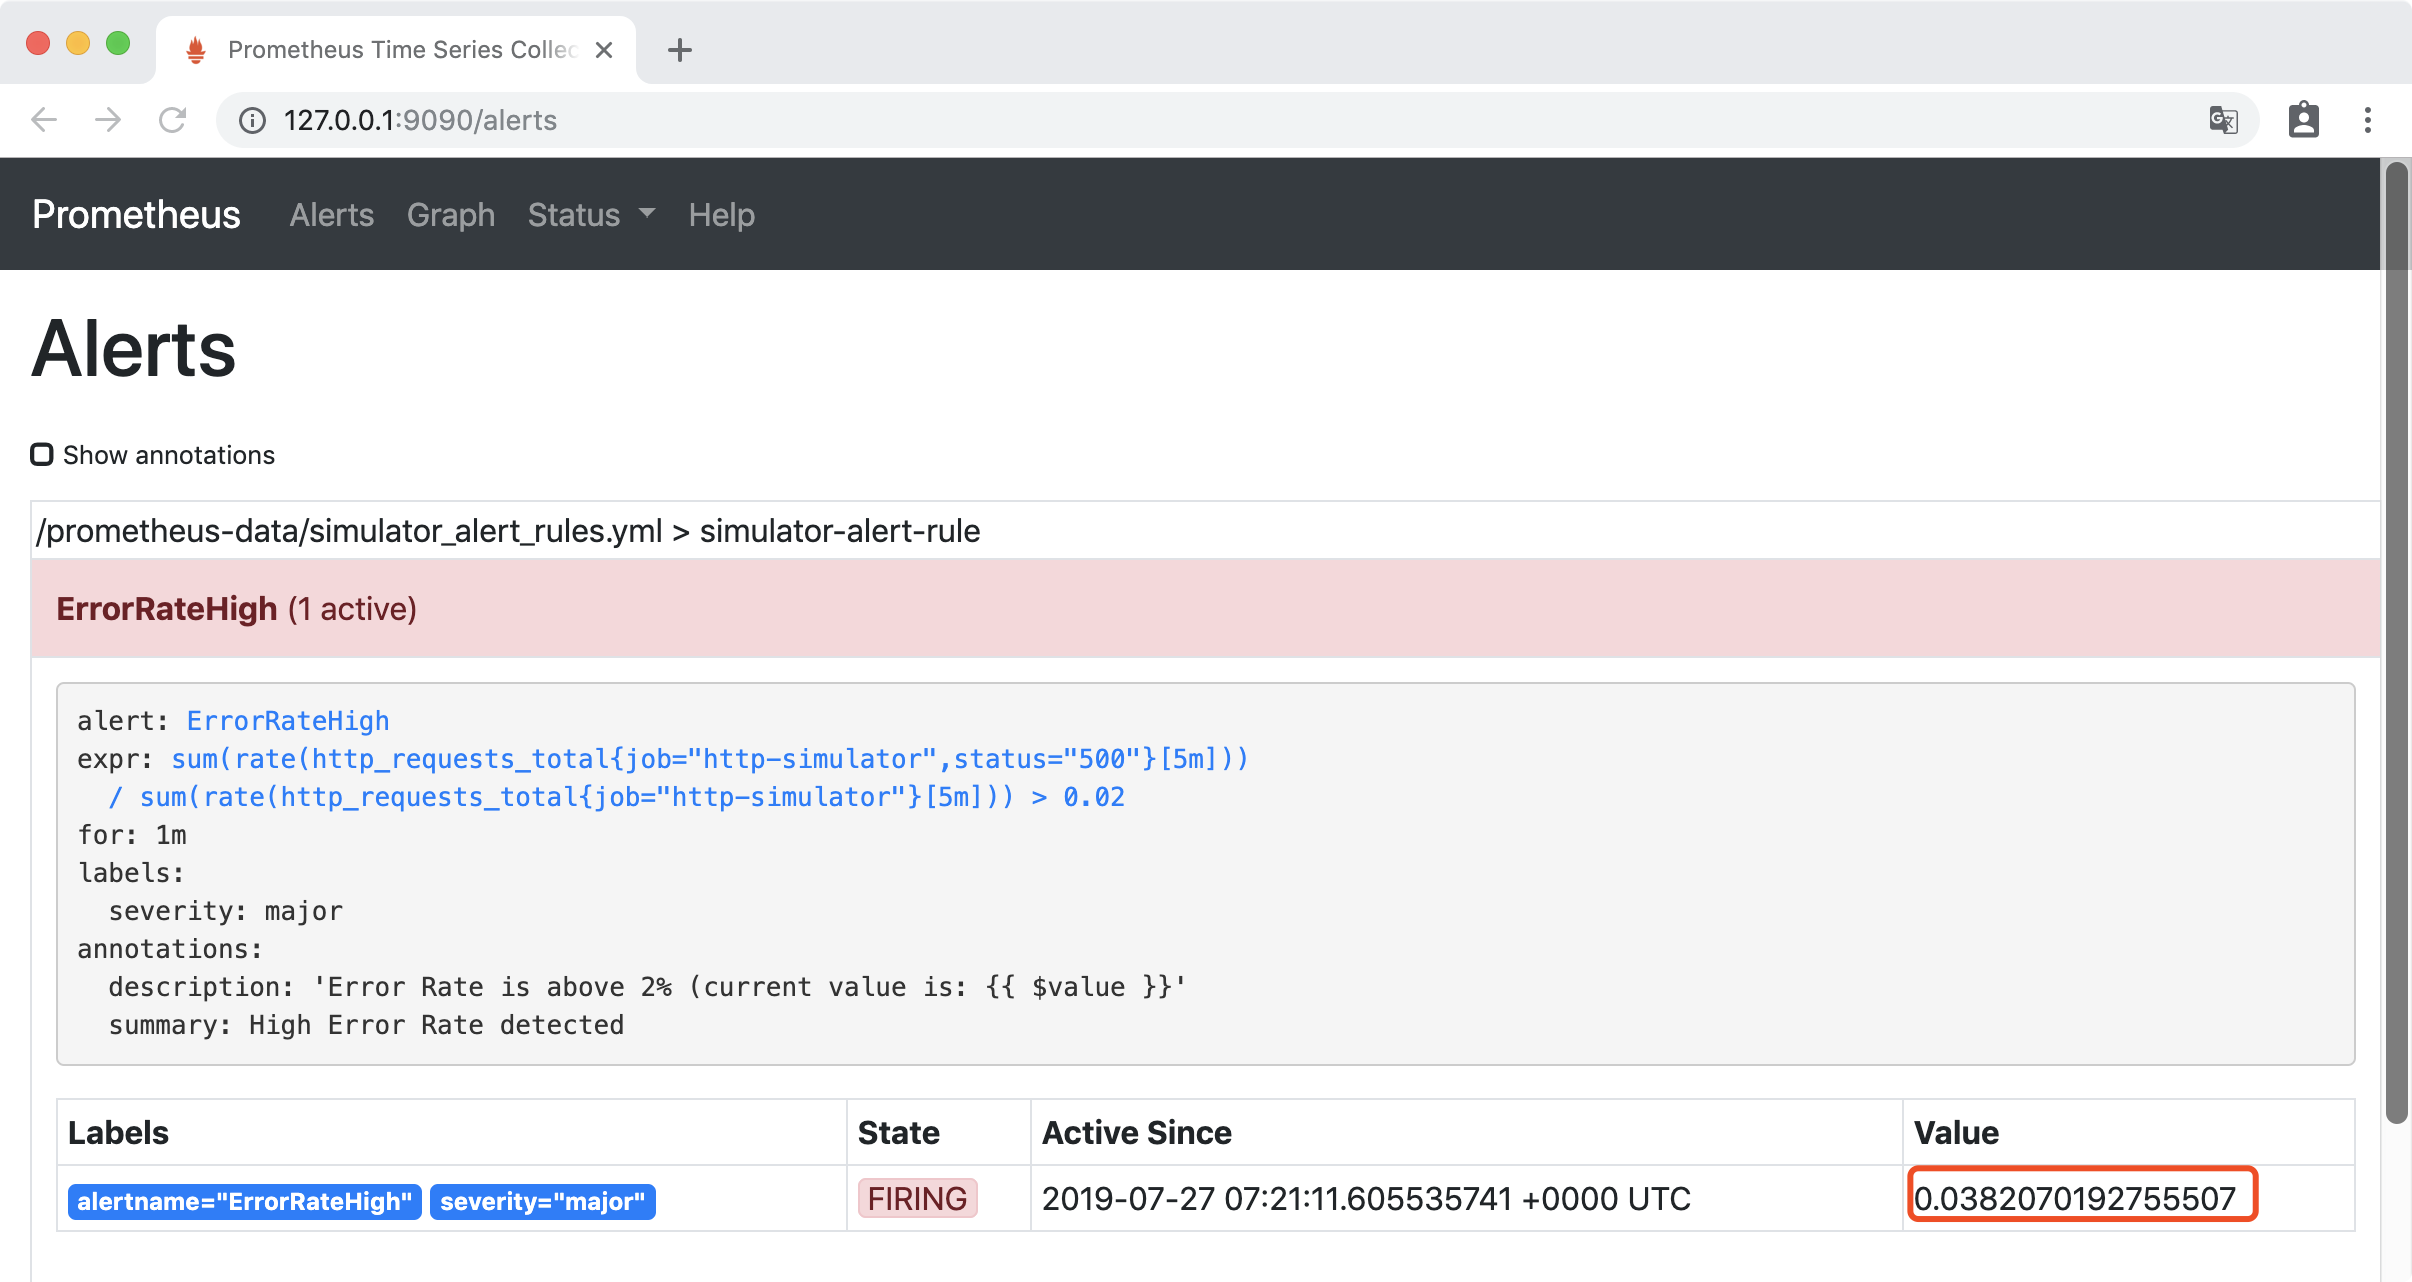
稍等一会后,访问http://127.0.0.1:9090/alerts, 可以看到错误率已经大2%,ErrorRateHigh 为红色的 FIRING 状态,报警已经被激活了。
安装和配置AlertManager
通过docker 挂载文件的方式安装AlertManager,在本地创建文件夹 alertmanager-data 文件夹,在其中创建 alertmanager.yml,内容如下:
global:

  smtp_smarthost: 'smtp.163.com:25'

  smtp_from: 'xxxxx@163.com'

  smtp_auth_username: 'xxxxx@163.com'

  smtp_auth_password: 'xxxxx'

route:

  group_interval: 1m   #当第一个报警发送后,等待'group_interval'时间来发送新的一组报警信息

  repeat_interval: 1m   # 如果一个报警信息已经发送成功了,等待'repeat_interval'时间来重新发送他们

  receiver: 'mail-receiver'

receivers:

- name: 'mail-receiver'

  email_configs:

    - to: 'xxxxxx@163.com'
启动 AlertManager:
docker run --name alertmanager -d -p 9093:9093 -v /Users/huanchu/Documents/alertmanager-data:/alertmanager-data \

       prom/alertmanager --config.file=/alertmanager-data/alertmanager.yml
在Prometheus目录下,修改prometheus.yml配置Alertmanager地址:
# Alertmanager configuration

alerting:

  alertmanagers:

  - static_configs:

    - targets:

      - 192.168.43.121:9093
更新Prometheus配置:
curl -X POST http://localhost:9090/-/reload
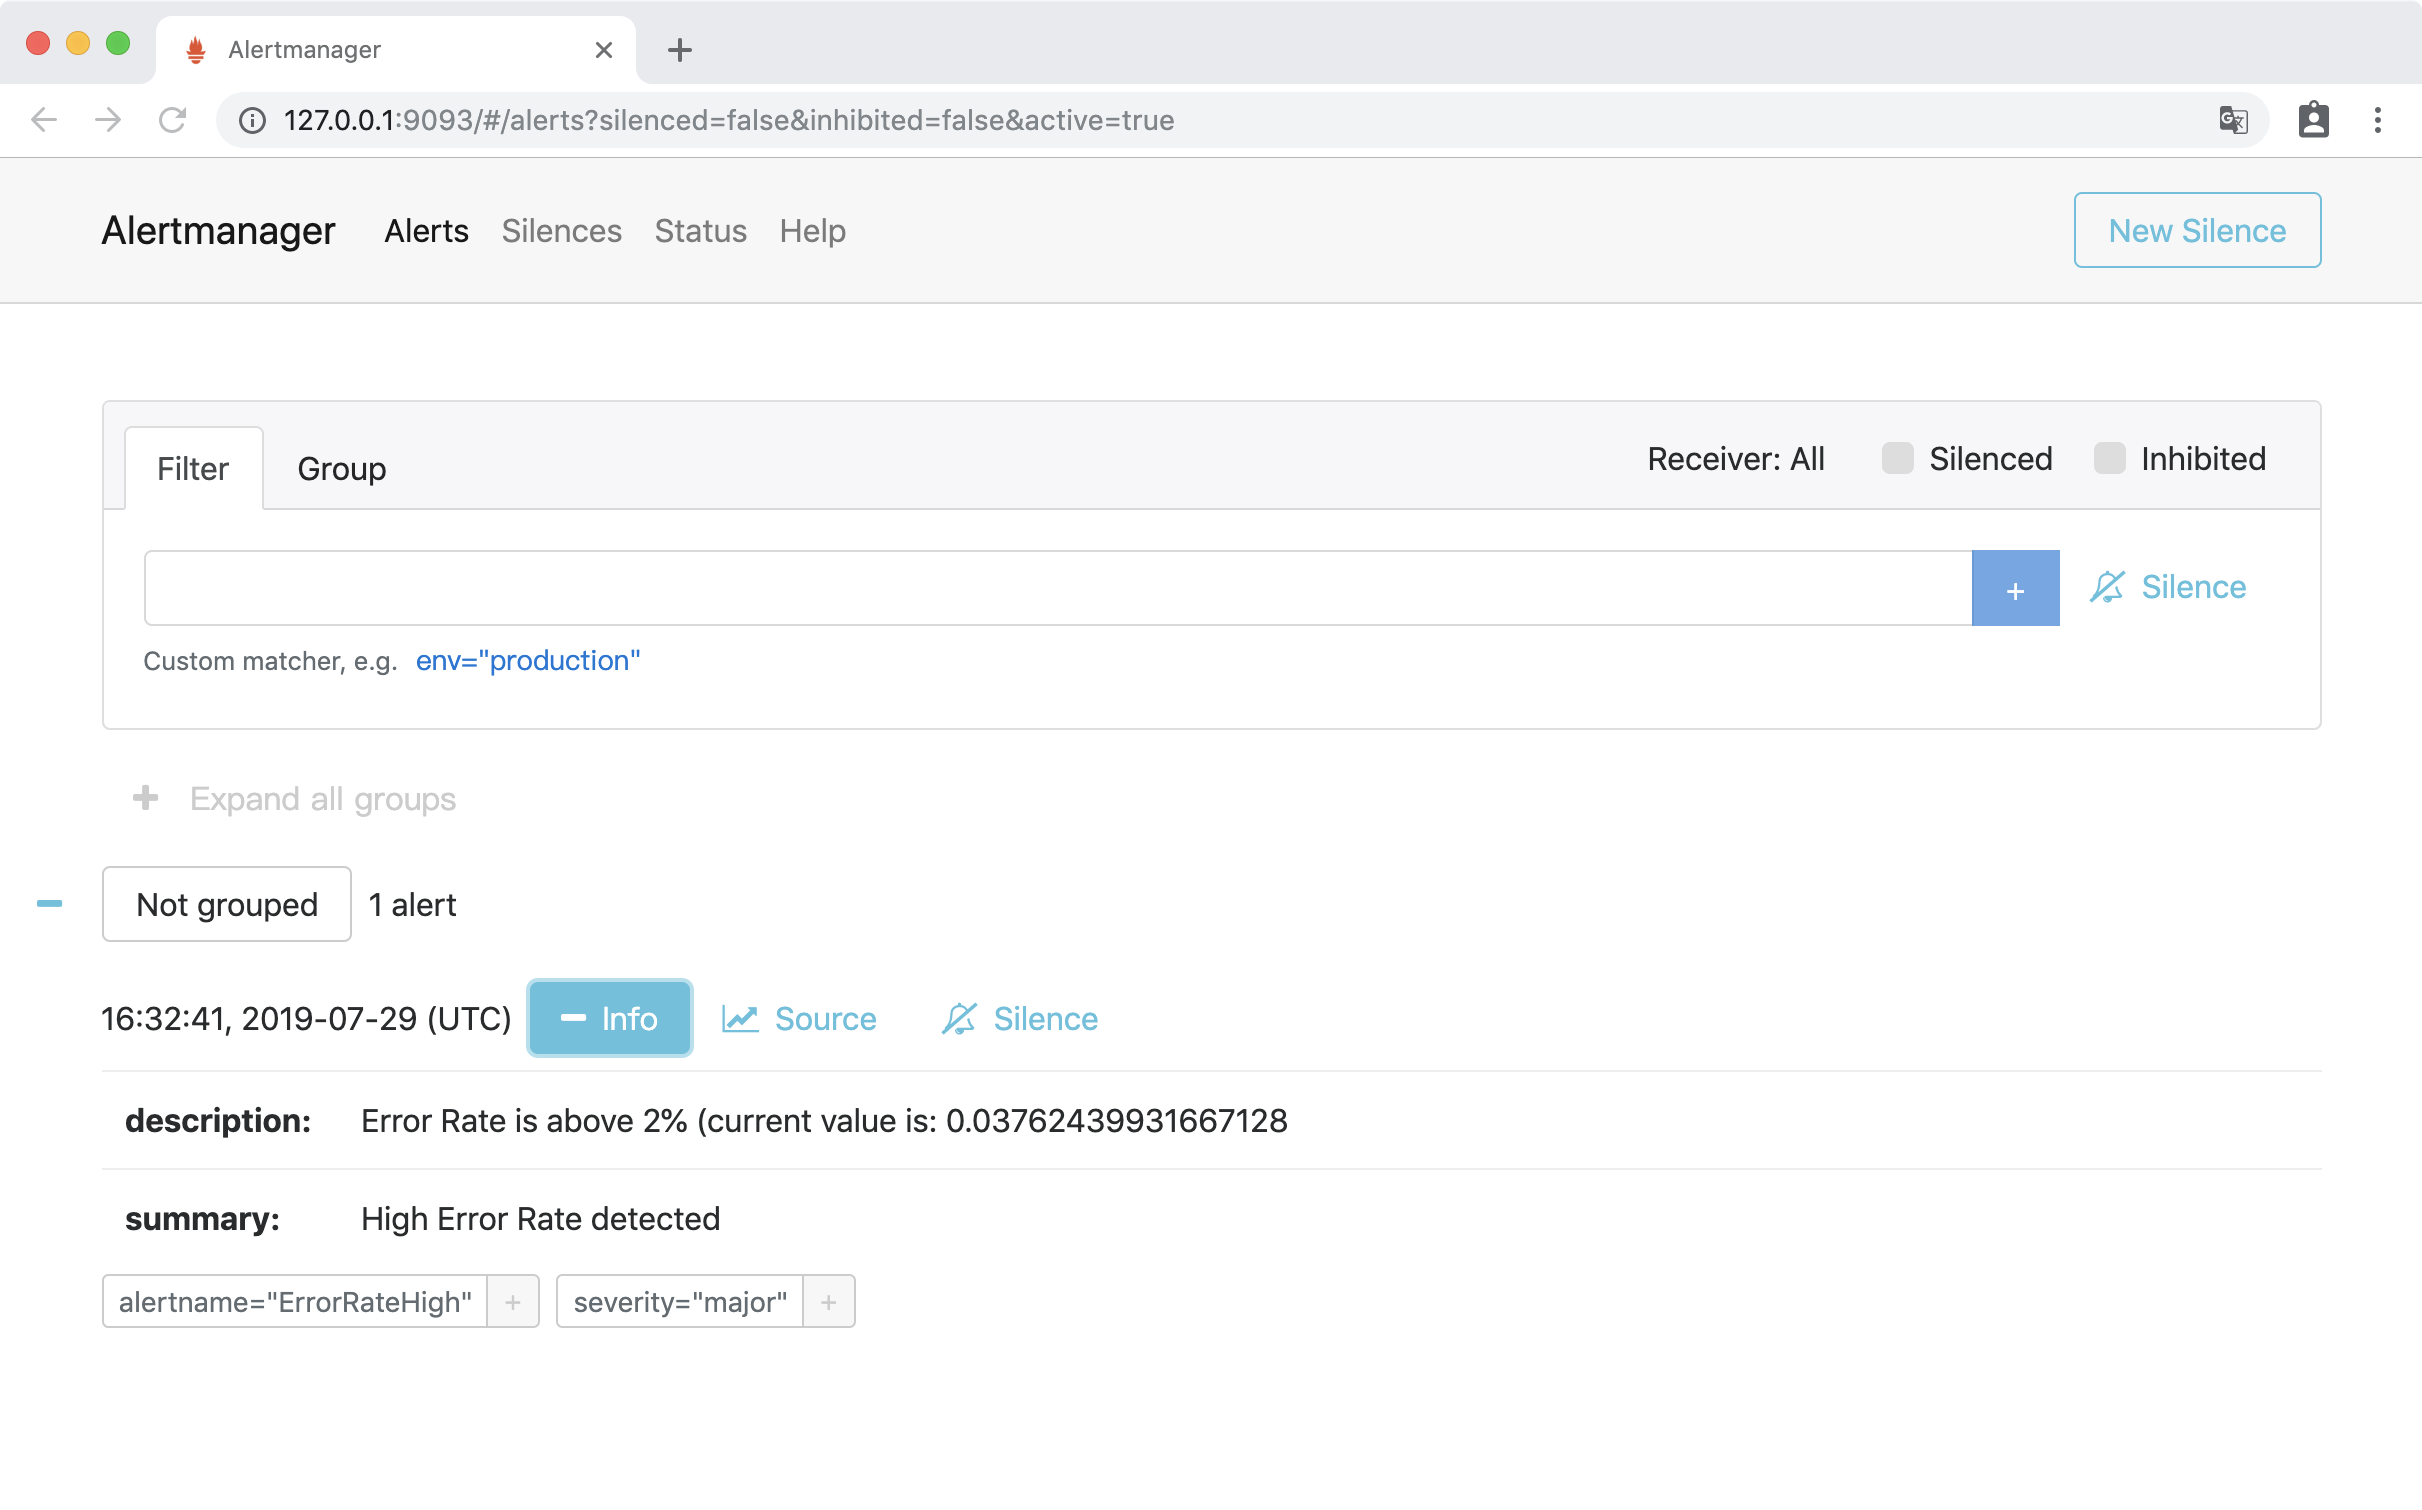
访问http://127.0.0.1:9093,访问Alertmanager UI界面,可以看到接收到ErrorRateHigh告警:
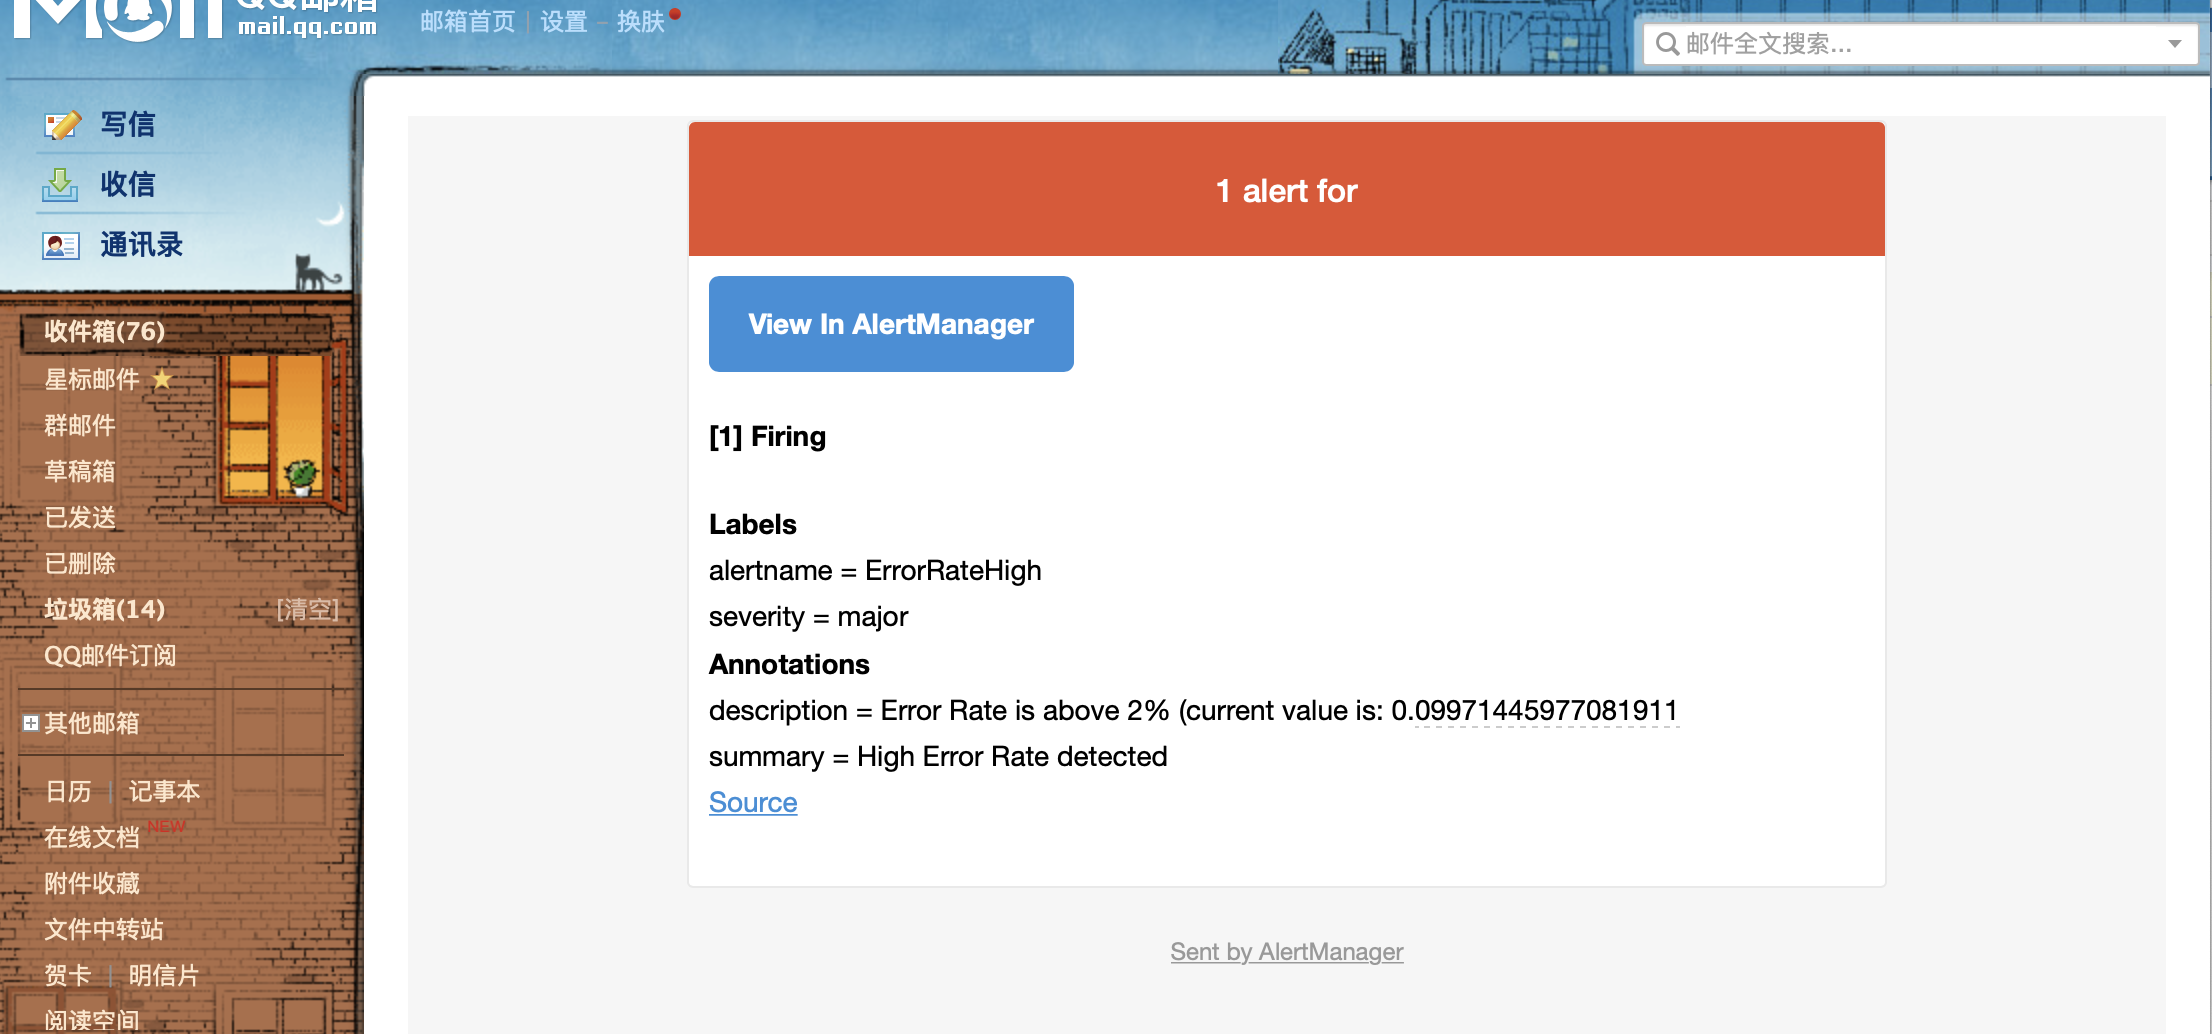
邮箱会收到告警信息:
欢迎扫码或微信搜索公众号《程序员果果》关注我,关注有惊喜~

Prometheus 整合 AlertManager的更多相关文章
- Prometheus 与 Alertmanager 通信
Prometheus 与 Alertmanager 通信 1.编辑Prometheus配置文件配置连接地址:vim prometheus.yml # Alertmanager configuratio ...
- Prometheus 安装Alertmanager集成
Prometheus 安装Alertmanager集成 # 下载地址 地址1:https://prometheus.io/download/ 地址2:https://github.com/promet ...
- prometheus学习系列十一: Prometheus和AlertManager的高可用
前面的系列中, prometheus和alertmanager都是单机部署的,会有单机宕机导致系统不可用情况发生.本文主要介绍下prometheus和alertmanager的高可用方案. 服务的高可 ...
- Prometheus 和 Alertmanager实战配置
Prometheus时序数据库 一.Prometheus 1.Prometheus安装 1)源码安装 prometheus安装包最新版本下载地址:https://prometheus.io/downl ...
- linux(centos8):prometheus使用alertmanager发送报警邮件(prometheus 2.18.1/alertmanager 0.20.0)
一,alertmanager的用途 1,Alertmanager的作用: Alertmanager是一个独立的报警模块, 它接收Prometheus等客户端发来的警报,并通过分组.删除重复等处理, 通 ...
- Prometheus+Grafana+Alertmanager实现告警推送教程 ----- 图文详解
前言 本文主要介绍的是Prometheus采集数据,通过Grafana加上PromQL语句实现数据可视化以及通过Alertmanage实现告警推送功能.温馨提示,本篇文章特长,2w多的文字加上几十张图 ...
- prometheus,alertmanager 报警配置详解
vim prometheus.yml global: scrape_interval: 15s external_labels: monitor: 'codelab-monitor' scrape_c ...
- 基于Prometheus+Grafana+AlertManager的监控系统
一.Prometheus 1.1 简介 Prometheus是一套开源的监控&报警&时间序列数据库的组合,基于应用的metrics来进行监控的开源工具 . 1.2 下载&安装 ...
- prometheus+grafana+Alertmanager邮箱告警
环境 系统:CentOS 7 软件:alertmanager-0.18.0.linux-amd64.tar.gz 安装 下载二进制包 地址:https://prometheus.io/download ...
随机推荐
- Python基础,day2
程序练习 程序:购物车程序 需求: 启动程序后,让用户输入工资,然后打印商品列表 允许用户根据商品编号购买商品 用户选择商品后,检测余额是否够,够就直接扣款,不够就提醒 可随时退出,退出时,打印已购买 ...
- ABP开发框架前后端开发系列---(12)配置模块的管理
一般来说,一个系统或多或少都会涉及到一些系统参数或者用户信息的配置,而ABP框架也提供了一套配置信息的管理模块,ABP框架的配置信息,必须提前定义好配置的各项内容,然后才能在系统中初始化或者通过接口查 ...
- PHP学习(一)
// php注释: // 单行注释 /*多行注释 多行注释*/ /** *姓名:李华 *时间:2016年 *内容:文档注释 */ #这是脚本注释--以下是注释代码 /*php的数据类型: 标量类型(4 ...
- SQL Server 2012设置某用户对某些表的记录限制其删除操作
第一步:用sa用户进入SSMS: 第二步:在安全性---用户上面点击右键---"属性": 第三步:在选择页中选择”安全对象“,点击”搜索“,弹出添加对象页面,这里默认为特定对象不用 ...
- mpvue 试水的一天
小程序经过了将近两年的锤炼,现在出现了许许多多的框架,来帮助我们进行快速开发,最近可能迷上了mpvue这个框架,所以就用公司的项目练练手. mpvue是用vue作为基础骨架的,所以他非常想vue,所以 ...
- VMware安装linux系统
- 【协议】TCP与UDP
转载地址:https://blog.csdn.net/qq_34988624/article/details/85856848 1.为什么会有TCP/IP协议 在世界上各地,各种各样的电脑运行着各自不 ...
- Appcan 日期控件
某个页面的onclick事件 <div id="topSendDate" class="ub ub-f1" onclick="appcan.wi ...
- SpringBoot使用Docker快速部署项目
1.简介 建议阅读本文最好对Dokcer有一些了解 首先我们先了解一下Docker是什么 Docker 属于 Linux 容器的一种封装,提供简单易用的容器使用接口.它是目前最流行的 Linux 容器 ...
- Mybatis 一对多分页踩坑 对collection的分析
背景描述: 产品和结算对象(结算名和结算金额)是一对多的关系,使用 collection 做一对多配置.但是出现一对多时,数据没有整合至一起,导致一个产品重复出现. class ResponseVo{ ...