
CBarChart柱形图类
在用VC做有关图表的时候,感觉不是那么方便,在codeproject找到一个柱形图的实用类,原文地址为:http://www.codeproject.com/KB/miscctrl/CBarChart.aspx。它可以很快速的生成柱状图,并且支持输出位图、支持打印、支持从数据库导入。
下面介绍下基本步骤:
1.添加BarChart.cpp 和 BarChart.h工程;
2.在需要使用的地方添加头文件
#include "BarChart.h"
3.定义一个CBarChart的变量;
CBarChart m_chart;
CBarChart m_chart;
4.在实现文件里面使用Create方法创建图表柱形图;
1).创建图表
// Create a bar chart control

    if (!m_chart.Create(

        rcBound,              // Bounding rectangle of the control

        this,                 // A pointer to the parent window to be shown on

        0 ))                  // ID of this control

    {

        // Error, can't create the chart

    }

    //If Create suceeds, it returns TRUE.
2).设置标题、背景颜色
m_chart.SetTitle("A test chart, displaying some dummy data...");

m_chart.SetBKColor(RGB(255, 255, 240));
3).添加柱形图表
m_chart.AddBar(

1600.356,           // A value to be shown at the top of the bar

"Jan",              // A label under the bar chart

RGB(255,255,0));    // Color of the bar
4).网格线显示、柱形描述、柱形提示
m_chart.ShowGrid(m_bShowGrid, TRUE);            // Show/Hide grids

m_chart.ShowBarText(1, m_bShowText, TRUE);      // Show/Hide values(top)

m_chart.ShowLabel(m_bShowLabel, TRUE);          // Show/Hide labels(bottom)

m_chart.ShowTooltip(m_bShowTip);                // Activate/deactivate tooltips
5).网格线大小
SetGridLines(

int nHorLineCount,      // Number of horizontal lines, 0 = ignore

int nVerLineCount,      // Number of vertical lines, 0 = ignore

BOOL bFixedSize,        // If TRUE, first 2 parameters will be ignored

int nFixedSize)         // A fixed value that defines distance between 2 lines,

                        // Will be used if previous parameter is set to TRUE
6).缩放
m_chart.SetAutoScale(m_bScale);         // Set chart to be auto scaled

// Reposition window, so it finds out the size to fit into

m_chart.SetWindowPos( 0, 0, 0,

rcClient.Width(),

rcClient.Height() , SWP_NOMOVE);

m_chart.Refresh();                      // Force the chart to redraw itself

// You might also need to override OnSize of the

// Parent to position the chart, so it is always at the size you like
7).删除柱形
m_chart.RemoveAt(nRemIndex);    // Removes the item indexed nRemIndex.

                                // Index is zero based.

m_chart.RemoveAll();            // Removes all bars
8).保存bmp文件
// Save chart as a bitmap file

if (!m_chart.SaveToFile())

    {

    AfxMessageBox(m_chart.GetLastErrorMessage());

    };
9).打印
m_chart.Print();        // Prints the whole chart fitted in the page.

// If you have a lot of bars, I recommend selecting landscape in the

// print dialog box.
10).连接数据库
//--------------------------------------------创建ODBC连接

// Use this form to call a stored procedure or a query and use

// result set as chart input

ReadFromDatabase("DS Name", "Stored proc/Query Name", "List of all parameters",

         "Bars Color", "UserName", "Password"));

// Note that the query or stored procedure MUST have at least 2 columns,

// First column MUST be of type char with maximum length of 50 and

// Second a double. These columns will be used as input data for the chart.

//--------------------------------------------连接数据库表

m_chart.ReadFromDatabase("DS Name", "Table name", "Filter",

"Laabel column name", "dValue column name",

Bars color , "username", "password");

//--------------------------------------------显示

if (!m_chart.ReadFromDatabase("CHTst", "SpChartGetSale", "1, 12",

                      RGB(0, 0, 0), "hamed", "hamed"))

    {

        AfxMessageBox(m_chart.GetLastDatabaseErrMessage());

    };

or

m_chart.ReadFromDatabase("CHTst", "Sales", "",

"Month", "SaleRate",

RGB(0, 0, 0) , "hamed", "hamed");
5.实例
CRect rcClient;

    GetClientRect(&rcClient);

    if (!m_chart.Create(CRect(110, 50,

            rcClient.Width()-10,

            rcClient.Height() - 50), this, 1050 ))

    {

        if (!m_chart.GetSafeHwnd())

        {

            AfxMessageBox("Unable to create the chart control");

            return;

        }

        m_chart.Reset();

        m_chart.SetAutoScale(FALSE);

    }

    m_chart.SetTitle("A test chart, displaying some dummy data...");

    m_chart.SetBKColor(RGB(255, 255, 240));

    m_chart.ShowTooltip(TRUE);

    m_chart.AddBar(1600.356,"Jan", RGB(255,255,0));

    m_chart.AddBar(2841.5468,"Feb", RGB(255,0,0));

    m_chart.AddBar(1045.3258,"Mar", RGB(100,100,200));

    m_chart.AddBar(1502.215,"Apr", RGB(0,255,0));

    m_chart.AddBar(1467,"MAY", RGB(255,255,255));

    m_chart.AddBar(1678.354,"JUN", RGB(200,255,255));

    m_chart.AddBar(1785.689,"JUL", RGB(255,240,40));

    m_chart.AddBar(1283.099,"AUG", RGB(255,60,130));

    m_chart.AddBar(1554.879,"SEP", RGB(255,255,200));

    m_chart.AddBar(1400.10,"OCT", RGB(130,235,250));

    m_chart.AddBar(1600.556,"NOV", RGB(100,150,200));

    m_chart.AddBar(1900.3546,"DES", RGB(150,240,80), TRUE);
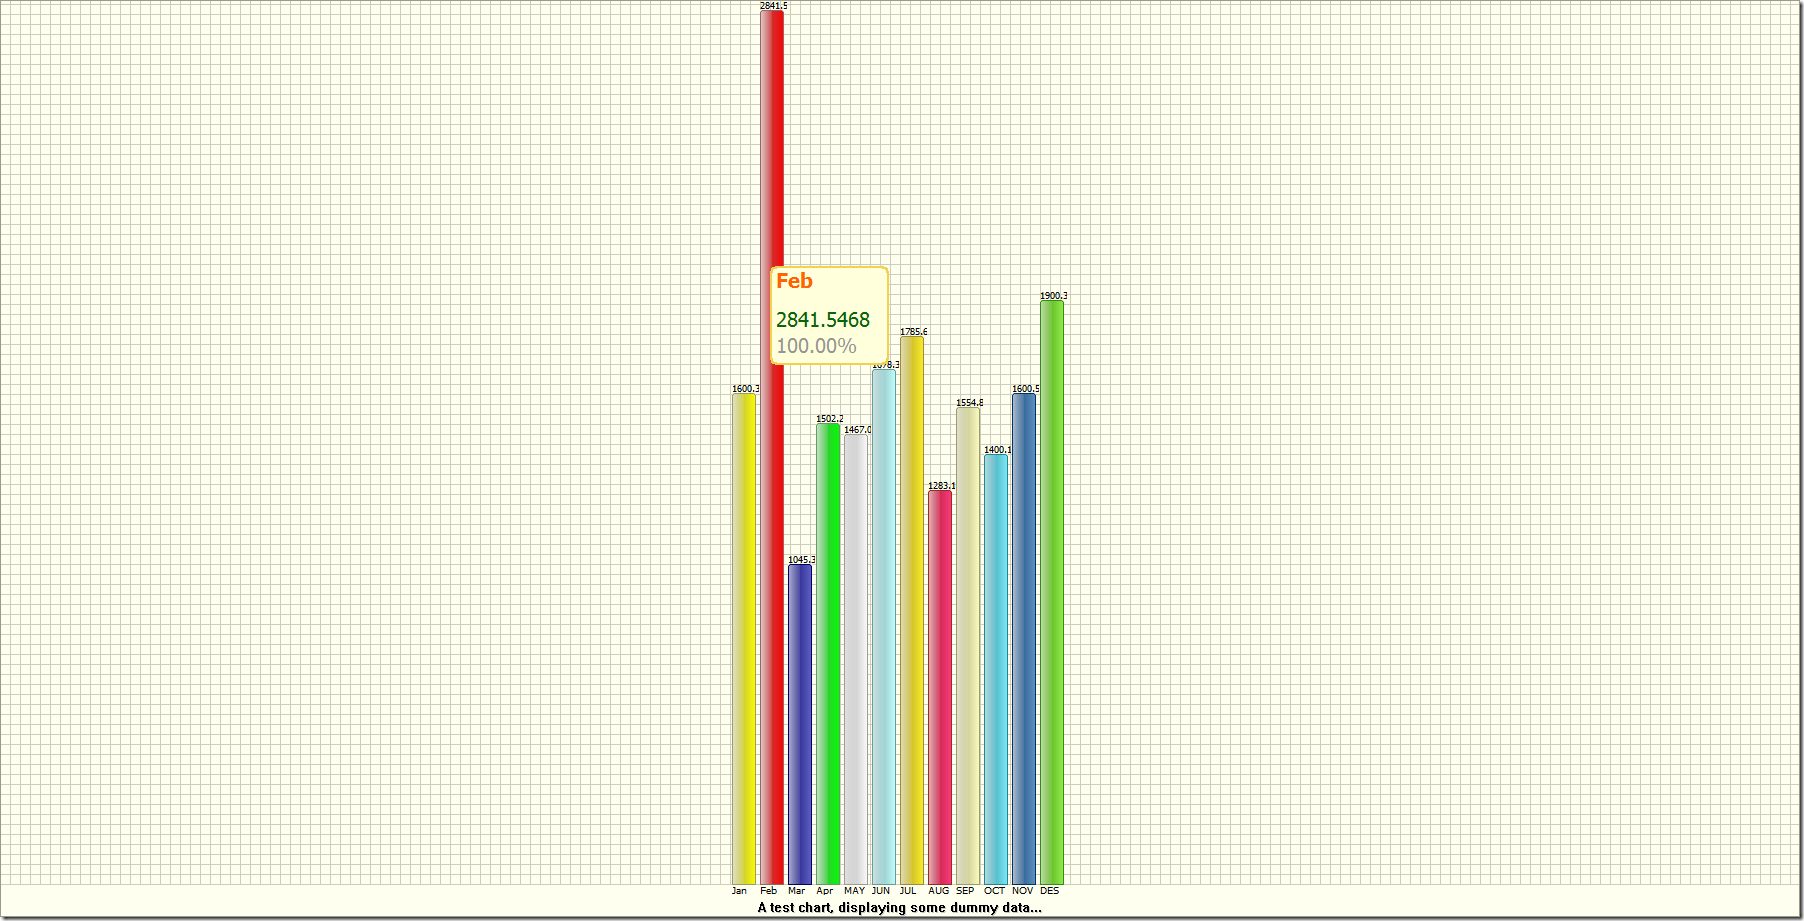
运行结果:
源文件下载:http://download.csdn.net/detail/wuyuan2011woaini/9592992
CBarChart柱形图类的更多相关文章
- Java类的继承与多态特性-入门笔记
相信对于继承和多态的概念性我就不在怎么解释啦!不管你是.Net还是Java面向对象编程都是比不缺少一堂课~~Net如此Java亦也有同样的思想成分包含其中. 继承,多态,封装是Java面向对象的3大特 ...
- ***百度统计图表Echarts的php实现类,支持柱形图、线形图、饼形图
/** * 百度数据统计图表echart的PHP实现类 * * 原作者: * @author: chenliujin <liujin.chen@qq.com> * @since 2013- ...
- AChartEngine 安卓折线图 柱形图等利器
http://www.eoeandroid.com/thread-548233-1-6.html 最近公司项目中要用到折线图,状态类型的图标要用到折线图,柱形图等,并且能够动态显示,在网上找了许多de ...
- iOS使用Charts框架绘制—柱形图
首先看一下最终要实现的效果: 最终效果 一.初始化barChartView 绘制柱形图需要用到BarChartView这个类,下面是初始化代码: self.barChartView = [[BarCh ...
- XCL-Charts图表库中柱形图的同源风格切换介绍
柱形图是被使用最多的图之中的一个,在写XCL-Charts这个Android图表库时,为它花费的时间相当多,不是由于有多难绘制,而是要在设计时怎样才干保证图基类能适应各种情况,能灵活满足足够多的需求, ...
- Android绘图机制(四)——使用HelloCharts开源框架搭建一系列炫酷图表,柱形图,折线图,饼状图和动画特效,抽丝剥茧带你认识图表之美
Android绘图机制(四)--使用HelloCharts开源框架搭建一系列炫酷图表,柱形图,折线图,饼状图和动画特效,抽丝剥茧带你认识图表之美 这里为什么不继续把自定义View写下去呢,因为最近项目 ...
- 关于echarts.js 柱形图
echarts.js官网: http://www.echartsjs.com/index.html 这是我所见整理最详细echarts.js 柱形图博客: https://blog.csdn.net/ ...
- High-speed Charting Control--MFC绘制图表(折线图、饼图、柱形图)控件
原文地址:https://www.codeproject.com/articles/14075/high-speed-charting-control 本文翻译在CodeProject上的介绍(主要还 ...
- 【207】WinForm Chart类
目录: 在工具箱中找到 Chart 控件并使用 设置 Chart 属性 代码中设置属性 属性中设置属性 Chart 类说明 ChartAreas ChartAreaCollection 类 Chart ...
随机推荐
- C#对象与XMl文件之间的相互转换
C#提供三种序列化方式,分别为: 1.是使用BinaryFormatter进行串行化: 2.使用SoapFormatter进行串行化: 3.使用XmlSerializer进行串行化.其中对于Binar ...
- C# 文字转声音
添加COM组件引用:Microsoft Speech object library private SpVoice voice; private void button1_Click(object s ...
- QCustomplot使用分享(一) 能做什么事
一.QCustomPlot简介 之前在Qt之自绘制饼图这篇文章的说明中我简单的描述了下目前依赖于qt的第三方绘图库,此后我会针对自己使用QCustomPlot的情况做一总结,以方便大家参考 QCust ...
- 关于 getWriter() has already been called for this response 的错误解决办法
java.lang.IllegalStateException: getWriter() has already been called for this response 今天在做显示图片的时候,( ...
- 由node-webkit想到
本人做为.NET的死忠也有些许年头.微软这几年被谷歌苹果之流打的有点招架不住..NET的前景也难免堪忧.虽然我认为就强类型语言方面,C#绝对是最强者.但是新技术的发展确实是可怕的,看看苹果几年就把no ...
- WPF 实际国际化多语言界面
前段时候写了一个WPF多语言界面处理,个人感觉还行,分享给大家.使用合并字典,静态绑定,动态绑定.样式等东西 效果图 定义一个实体类LanguageModel,实际INotifyPropertyCha ...
- 编程Bug集
(基础)将“/”用于取余符号,导致非预想结果——1小时后才找到错误原因 9.16
- csharp: Export DataSet into Excel and import all the Excel sheets to DataSet
/// <summary> /// Export DataSet into Excel /// </summary> /// <param name="send ...
- [PE结构分析] 8.输入表结构和输入地址表(IAT)
在 PE文件头的 IMAGE_OPTIONAL_HEADER 结构中的 DataDirectory(数据目录表) 的第二个成员就是指向输入表的.每个被链接进来的 DLL文件都分别对应一个 IMAGE_ ...
- [moka学习笔记]yii2.0数据库查询的多种方法(未完待整理)
方法一:(使用model) $modelCommunityMail = CommunityMail::find()->where(['com_id'=>$id])->all(); 方 ...