
用matplotlib获取雅虎股票数据并作图
matplotlib有一个finance子模块提供了一个获取雅虎股票数据的api接口:quotes_historical_yahoo_ochl
感觉非常好用!
示例一
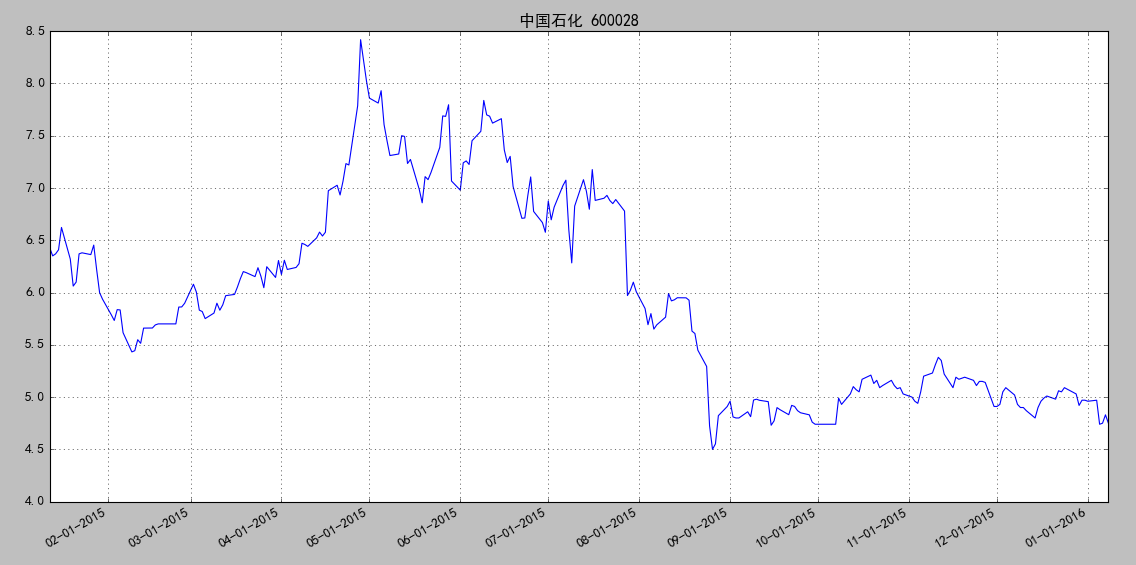
获取数据并作折线图
import matplotlib.pyplot as plt

from matplotlib.finance import quotes_historical_yahoo_ochl

from matplotlib.dates import YearLocator, MonthLocator, DateFormatter

import datetime

plt.rcParams['font.sans-serif'] = ['SimHei']

plt.rcParams['axes.unicode_minus'] = False

ticker = '600028.ss'

date1 = datetime.date( 2015, 1, 10 )

date2 = datetime.date( 2016, 1, 10 )

daysFmt  = DateFormatter('%m-%d-%Y')

quotes = quotes_historical_yahoo_ochl(ticker, date1, date2)

if len(quotes) == 0:

    raise SystemExit

print(quotes[1])

dates = [q[0] for q in quotes]

opens = [q[1] for q in quotes]

closes = [q[2] for q in quotes]

fig = plt.figure()

ax = fig.add_subplot(111)

ax.plot_date(dates, opens, '-')

# format the ticks

ax.xaxis.set_major_formatter(daysFmt)

ax.autoscale_view()

# format the coords message box

def price(x):

    return '$%1.2f'%x

ax.fmt_xdata = DateFormatter('%Y-%m-%d')

ax.fmt_ydata = price

ax.grid(True)

fig.autofmt_xdate()

plt.title('中国石化 600028')

plt.show()
效果图:
示例二
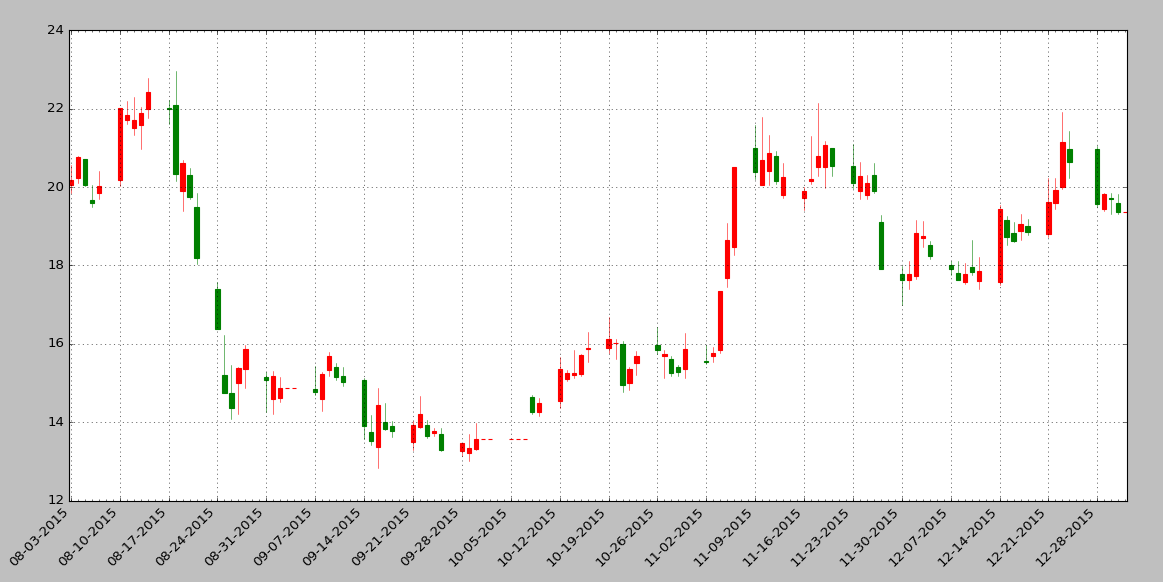
获取数据,并作蜡烛图
import matplotlib.pyplot as plt

from matplotlib.dates import DateFormatter, WeekdayLocator, DayLocator, MONDAY,YEARLY

from matplotlib.finance import quotes_historical_yahoo_ohlc, candlestick_ohlc

plt.rcParams['font.sans-serif'] = ['SimHei']

plt.rcParams['axes.unicode_minus'] = False

ticker = '' # 600028 是"中国石化"的股票代码

ticker += '.ss'   # .ss 表示上证 .sz表示深证

date1 = (2015, 8, 1) # 起始日期,格式:(年,月,日)元组

date2 = (2016, 1, 1)  # 结束日期,格式:(年,月,日)元组

mondays = WeekdayLocator(MONDAY)            # 主要刻度

alldays = DayLocator()                      # 次要刻度

#weekFormatter = DateFormatter('%b %d')     # 如:Jan 12

mondayFormatter = DateFormatter('%m-%d-%Y') # 如:2-29-2015

dayFormatter = DateFormatter('%d')          # 如:12

quotes = quotes_historical_yahoo_ohlc(ticker, date1, date2)

if len(quotes) == 0:

    raise SystemExit

fig, ax = plt.subplots()

fig.subplots_adjust(bottom=0.2)

ax.xaxis.set_major_locator(mondays)

ax.xaxis.set_minor_locator(alldays)

ax.xaxis.set_major_formatter(mondayFormatter)

#ax.xaxis.set_minor_formatter(dayFormatter)

#plot_day_summary(ax, quotes, ticksize=3)

candlestick_ohlc(ax, quotes, width=0.6, colorup='r', colordown='g')

ax.xaxis_date()

ax.autoscale_view()

plt.setp(plt.gca().get_xticklabels(), rotation=45, horizontalalignment='right')

ax.grid(True)

plt.title('中国石化 600028')

plt.show()
效果图:
示例三
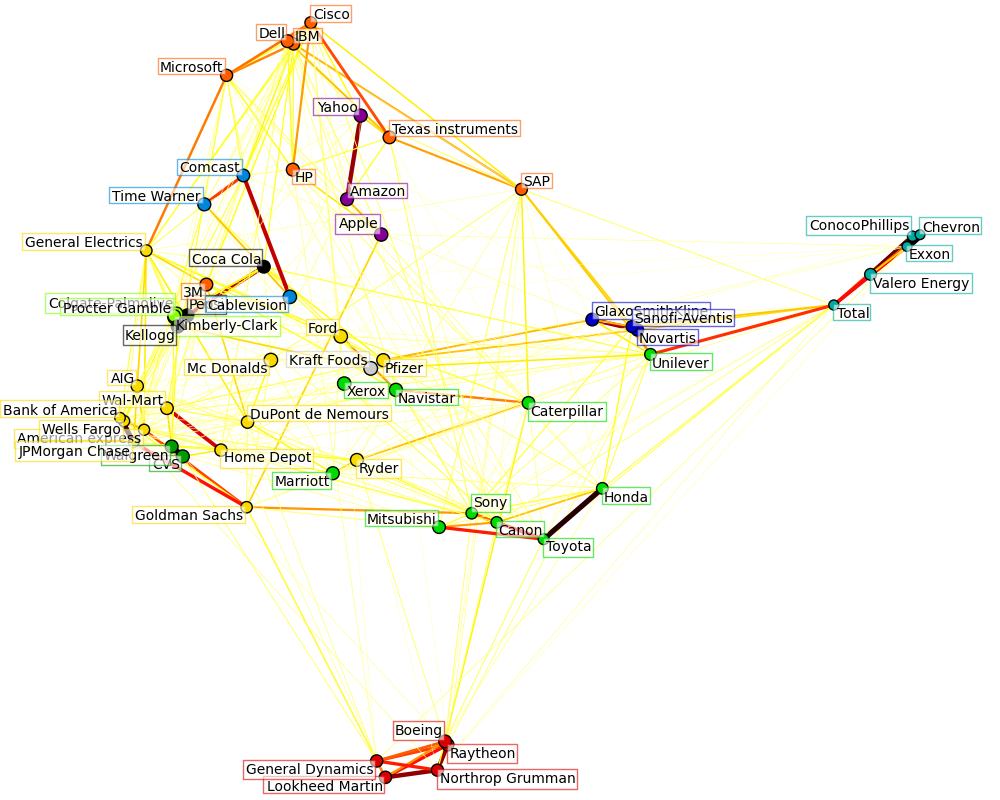
获取上证50成分股数据,进行聚类分析(看看那些股票价格关联性强),并作图
import datetime

import numpy as np

import matplotlib.pyplot as plt

from matplotlib.finance import quotes_historical_yahoo_ochl

from matplotlib.collections import LineCollection

from sklearn import cluster, covariance, manifold

plt.rcParams['font.sans-serif'] = ['SimHei']

plt.rcParams['axes.unicode_minus'] = False

###############################################################################

# Retrieve the data from Internet

# Choose a time period reasonably calm (not too long ago so that we get

# high-tech firms, and before the 2008 crash)

d1 = datetime.datetime(2015, 1, 1)

d2 = datetime.datetime(2016, 1, 1)

# 上证50成分股

symbol_dict = {

    "": "浦发银行",

    "": "包钢股份",

    "": "华夏银行",

    "": "民生银行",

    "": "上港集团",

    "": "中国石化",

    "": "中信证券",

    "": "招商银行",

    "": "保利地产",

    "": "中国联通",

    "": "特变电工",

    "": "上汽集团",

    "": "国金证券",

    "": "北方稀土",

    "": "中国船舶",

    "": "广汇能源",

    "": "国电南瑞",

    "": "康美药业",

    "": "贵州茅台",

    "": "海油工程",

    "": "海螺水泥",

    "": "东方明珠",

    "": "青岛海尔",

    "": "海通证券",

    "": "伊利股份",

    "": "中航动力",

    "": "东方证券",

    "": "招商证券",

    "": "大秦铁路",

    "": "中国神华",

    "": "兴业银行",

    "": "北京银行",

    "": "中国铁建",

    "": "农业银行",

    "": "中国平安",

    "": "交通银行",

    "": "中国中铁",

    "": "工商银行",

    "": "中国太保",

    "": "中国人寿",

    "": "中国建筑",

    "": "华泰证券",

    "": "中国中车",

    "": "中国交建",

    "": "光大银行",

    "": "中国石油",

    "": "方正证券",

    "": "中国银行",

    "": "中国重工",

    "": "中信银行"}

symbols, names = np.array(list(symbol_dict.items())).T

quotes = [quotes_historical_yahoo_ochl(symbol+".ss", d1, d2, asobject=True)

          for symbol in symbols]

open = np.array([q.open for q in quotes]).astype(np.float)

close = np.array([q.close for q in quotes]).astype(np.float)

# 每日价格浮动包含了重要信息!

variation = close - open

###############################################################################

# Learn a graphical structure from the correlations

edge_model = covariance.GraphLassoCV()

# standardize the time series: using correlations rather than covariance

# is more efficient for structure recovery

X = variation.copy().T

X /= X.std(axis=0)

edge_model.fit(X)

###############################################################################

# Cluster using affinity propagation

_, labels = cluster.affinity_propagation(edge_model.covariance_)

n_labels = labels.max()

for i in range(n_labels + 1):

    print('Cluster %i: %s' % ((i + 1), ', '.join(names[labels == i])))

###############################################################################

# Find a low-dimension embedding for visualization: find the best position of

# the nodes (the stocks) on a 2D plane

# We use a dense eigen_solver to achieve reproducibility (arpack is

# initiated with random vectors that we don't control). In addition, we

# use a large number of neighbors to capture the large-scale structure.

node_position_model = manifold.LocallyLinearEmbedding(

    n_components=2, eigen_solver='dense', n_neighbors=6)

embedding = node_position_model.fit_transform(X.T).T

###############################################################################

# Visualization

plt.figure(1, facecolor='w', figsize=(10, 8))

plt.clf()

ax = plt.axes([0., 0., 1., 1.])

plt.axis('off')

# Display a graph of the partial correlations

partial_correlations = edge_model.precision_.copy()

d = 1 / np.sqrt(np.diag(partial_correlations))

partial_correlations *= d

partial_correlations *= d[:, np.newaxis]

non_zero = (np.abs(np.triu(partial_correlations, k=1)) > 0.02)

# Plot the nodes using the coordinates of our embedding

plt.scatter(embedding[0], embedding[1], s=100 * d ** 2, c=labels,

            cmap=plt.cm.spectral)

# Plot the edges

start_idx, end_idx = np.where(non_zero)

#a sequence of (*line0*, *line1*, *line2*), where::

#            linen = (x0, y0), (x1, y1), ... (xm, ym)

segments = [[embedding[:, start], embedding[:, stop]]

            for start, stop in zip(start_idx, end_idx)]

values = np.abs(partial_correlations[non_zero])

lc = LineCollection(segments,

                    zorder=0, cmap=plt.cm.hot_r,

                    norm=plt.Normalize(0, .7 * values.max()))

lc.set_array(values)

lc.set_linewidths(15 * values)

ax.add_collection(lc)

# Add a label to each node. The challenge here is that we want to

# position the labels to avoid overlap with other labels

for index, (name, label, (x, y)) in enumerate(

        zip(names, labels, embedding.T)):

    dx = x - embedding[0]

    dx[index] = 1

    dy = y - embedding[1]

    dy[index] = 1

    this_dx = dx[np.argmin(np.abs(dy))]

    this_dy = dy[np.argmin(np.abs(dx))]

    if this_dx > 0:

        horizontalalignment = 'left'

        x = x + .002

    else:

        horizontalalignment = 'right'

        x = x - .002

    if this_dy > 0:

        verticalalignment = 'bottom'

        y = y + .002

    else:

        verticalalignment = 'top'

        y = y - .002

    plt.text(x, y, name, size=10,

             horizontalalignment=horizontalalignment,

             verticalalignment=verticalalignment,

             bbox=dict(facecolor='w',

                       edgecolor=plt.cm.spectral(label / float(n_labels)),

                       alpha=.6))

plt.xlim(embedding[0].min() - .15 * embedding[0].ptp(),

         embedding[0].max() + .10 * embedding[0].ptp(),)

plt.ylim(embedding[1].min() - .03 * embedding[1].ptp(),

         embedding[1].max() + .03 * embedding[1].ptp())

plt.title('上证50成分股')

plt.show()
效果图:
说明:
这个图是原例子的图,统计的是美股60只股票,我用原例运行是可以的。
但是我换成上证50成分股后,雅虎拒绝我的的连接,所以下载不了数据,因此就看不到效果!
抱歉了各位朋友。
有图为证:

另:
示例四
下载雅虎股票数据到本地保存
import os

import urllib.request

'''

雅虎历史数据请求

    请求地址:http://ichart.yahoo.com/table.csv?s=string&a=int&b=int&c=int&d=int&e=int&f=int&g=d&ignore=.csv

        或者:http://table.finance.yahoo.com/table.csv?a=%d&b=%d&c=%d&d=%d&e=%d&f=%d&s=%s&y=0&g=%s&ignore=.csv

        两者参数有点不一样

    说明:

        s — 股票名称

        a — 起始时间,月

        b — 起始时间,日

        c — 起始时间,年

        d — 结束时间,月

        e — 结束时间,日

        f — 结束时间,年

        g — 时间周期。

    Ø  参数g的取值范围:d->‘日’(day), w->‘周’(week),m->‘月’(mouth),v->‘dividends only’

    Ø  月份是从0开始的,如9月数据,则写为08。  <<<<<<<<<<<<<<<<<<<<<<<<<<<<<<<<<<<<<<<<<<<<<<<<<<

示例

    查询浦发银行2010.09.25 – 2010.10.8之间日线数据

    http://ichart.yahoo.com/table.csv?s=600000.SS&a=08&b=25&c=2010&d=09&e=8&f=2010&g=d

    查看国内沪深股市的股票,规则是:沪股代码末尾加.ss,深股代码末尾加.sz。如浦发银行的代号是:600000.SS

'''

ticker = '' # 600028 是"中国石化"的股票代码

ticker += '.ss'   # .ss 表示上证 .sz表示深证

date1 = ( 2015, 1, 1 ) #begining time

date2 = ( 2016, 1, 1 ) #ending time

d1 = (date1[1]-1, date1[2], date1[0])

d2 = (date2[1]-1, date2[2], date2[0])

g='d'

urlFmt = 'http://table.finance.yahoo.com/table.csv?a=%d&b=%d&c=%d&d=%d&e=%d&f=%d&s=%s&y=0&g=%s&ignore=.csv'

url =  urlFmt % (d1[0], d1[1], d1[2], d2[0], d2[1], d2[2], ticker, g)  #the url of historical data

filename = 'data.csv'                #file name

filename = os.path.join(os.path.dirname(__file__), filename)   #located file

urllib.request.urlretrieve(url, filename)        #下载,保存
用matplotlib获取雅虎股票数据并作图的更多相关文章
- ajax从新浪获取实时股票数据
最近在给公司做一个报表展示,然后领导要求上面加上一些股票的实时数据展示. 一开始同事给我一个聚合数据的网址,说从这上面可以获取到.我一看,哟呵,API接口什么的都提供好了,确实方便.然后想用的时候才发 ...
- Python爬虫抓取东方财富网股票数据并实现MySQL数据库存储
Python爬虫可以说是好玩又好用了.现想利用Python爬取网页股票数据保存到本地csv数据文件中,同时想把股票数据保存到MySQL数据库中.需求有了,剩下的就是实现了. 在开始之前,保证已经安装好 ...
- 【机器学习】Pandas库练习-获取yahoo金融苹果公司的股票数据
# 获取yahoo金融苹果公司的股票数据. # 1.分析拉取的数据,找到收盘数据列的列名. # 2.绘制收盘价格柱状图. # 3.分析拉取的数据涨跌率,股价移动平均和波动率. # 4. 找出开盘价和收 ...
- 获取sina,baidu,google财经历史和实时股票数据接口
实时股票数据接口 股票数据的获取目前有如下两种方法可以获取:1. http/javascript接口取数据2. web-service接口1.http/javascript接口取数据1.1Sina股票 ...
- python分别使用多线程和多进程获取所有股票实时数据
python分别使用多线程和多进程获取所有股票实时数据 前一天简单介绍了python怎样获取历史数据和实时分笔数据,那么如果要获取所有上市公司的实时分笔数据,应该怎么做呢? 肯定有人想的是,用一个 ...
- 实时获取股票数据,免费!——Python爬虫Sina Stock实战
更多精彩内容,欢迎关注公众号:数量技术宅,也可添加技术宅个人微信号:sljsz01,与我交流. 实时股票数据的重要性 对于四大可交易资产:股票.期货.期权.数字货币来说,期货.期权.数字货币,可以从交 ...
- R获取股票数据
R中好几个Pkg都提供了股票数据的在线下载方法,如果非得在其中找出一个最好的,那么quantmod当之无愧!举一个例子,譬如下载沪市大盘数据,代码可以是: library(quantmod)SSE & ...
- 用Python浅析股票数据
用Python浅析股票数据 本文将使用Python来可视化股票数据,比如绘制K线图,并且探究各项指标的含义和关系,最后使用移动平均线方法初探投资策略. 数据导入 这里将股票数据存储在stockData ...
- 用Python爬取股票数据,绘制K线和均线并用机器学习预测股价(来自我出的书)
最近我出了一本书,<基于股票大数据分析的Python入门实战 视频教学版>,京东链接:https://item.jd.com/69241653952.html,在其中用股票范例讲述Pyth ...
随机推荐
- PHP接收IOS post过来的json数据无法解析的问题
在本地环境下运行解析OK 换到线上的环境解析失败 开始怀疑各种编码问题,解决均无效. 查看phpinfo 发现magic_quotes_gpc =on 终于找到问题所在,更改php.ini文件 mag ...
- win10下vs2015配置Opencv3.1.0过程详解(转)
下载安装Opencv3.1.0 下载Opencv3.1.0,进入官网,点击opencv for windows即可下载. 点击运行下载好的文件.实际上,opencv的安装程序就是解压缩文件,个人因为 ...
- Oracle EBS AR 更新客户
DECLARE l_return_status ); l_msg_count NUMBER; l_msg_data ); l_rec_type hz ...
- 分析VoltDB内存数据库
转自https://blog.csdn.net/olidrop/article/details/7065384 https://blog.csdn.net/ransom0512/article/det ...
- GIT学习---GIT&github的使用
GIT&github入门 版本控制的原理: 根据md5进行文件的校验[MD5的特性就是每次的输入一致则输出也一致],对于每次的修改进行一次快照 版本控制的2个功能: 版本管理 + 协作开 ...
- Linux vim命令详解
vi: o 处于下一行编辑模式 A 处于编辑的后面 ==>END gg 文件的开头 98gg 跳转到第98行 Shift + G 文件结尾 $ 文件行结尾 ^ 文件行开头 ==> ...
- Office 365实现单点登录系列(5)—配置单点登录
这是单点登录系列的最后一篇文章,前面4篇文章其实都是在为这篇文章的内容做准备,我把这四篇文章的链接放在下面,如果大家有需要,可以参考我以下的链接: Office 365实现单点登录系列(1)—域环境搭 ...
- Unity调用安卓中的方法遇到的问题
最近在用U3D做一个简单的迷宫游戏,在项目中利用Unity制作游戏场景,在android中调用游戏场景,并在游戏结束后调用安卓方法,传递参数,退出游戏场景 查找网上资料,基本上Unity调用安卓的写法 ...
- 【原创】修改最大用户进程限制 "ulimit -u"
centos 6.x 内核版本2.6.32以上,修改/etc/security/limits.d/90-nproc.conf:因为系统是先读/etc/security/limits.conf的值,在用 ...
- LA5713 秦始皇修路 (mst)
题意: 秦朝有n个城市,需要修路让每个城市都互相连通,现在可以免费修一条路,秦始皇希望他除了这条免费修的路外所需修的路的总和B最短,同时这条免费的路连接的人口之和A尽可能大,求最大的A/B是多少,城市 ...