
学习小记: Kaggle Learn - Machine Learning Explainability
| Method | Feature(s) | Sample(s) | Result Value/Feature |
| Permutation Importance | 1 | all validation samples | Single Scale |
| Partial Dependence Plots | 1~2 | all validation samples | Vector(reasults vs feature) |
| SHAP Values | N | individual sample | 每个feature对当前结果的贡献(相对于baseline) |
| Advanced Uses of SHAP Values- Summary Plots | N | all | 绘制每个feature在每个样本预测结果中的贡献(相对于baseline) |
| Advanced Uses of SHAP Values- SHAP Dependence Contribution Plots | 2 | all | 绘制2个feature在所有样本也测结果中的贡献(相对于baseline) |
参考: https://www.kaggle.com/learn/machine-learning-explainability
这个课程将讲解如何从复杂的机器学习模型中解释这些发现。
- 模型认为数据中的哪些特征是最重要的?
- 对于来自模型的任何单个预测,数据中的每个特性如何影响该特定预测
- 每个特性如何影响模型的整体预测(当考虑大量可能的预测时,它的典型影响是什么?)
- 调试,理解模型所发现的模式将帮助您识别那些与您对真实世界的认识不一致的地方
- 为特征工程提供信息
- 指导未来的数据收集
- 为人的决策提供信息
- 建立信任,提高产品在用户中的接受度。
Permutation Importance置换重要性
统计每个feature的重要程度,训具体步骤如下:
- 正常训练完模型。
- 对原始validation数据,依次shuffle每个feature的原始数据。
- 根据得到的模型参数,对shuffle后的数据进行预测,计算性能(准确度)下降程度。
- 对每个feature重复2-3,最后得出每个feature的重要程度(shuffle它后性能下降程度)
用eli5库实现的置换重要性计算
import numpy as np

import pandas as pd

from sklearn.model_selection import train_test_split

from sklearn.ensemble import RandomForestClassifier

data = pd.read_csv('../input/fifa-2018-match-statistics/FIFA 2018 Statistics.csv')

y = (data['Man of the Match'] == "Yes")  # Convert from string "Yes"/"No" to binary

feature_names = [i for i in data.columns if data[i].dtype in [np.int64]]

X = data[feature_names]

train_X, val_X, train_y, val_y = train_test_split(X, y, random_state=1)

my_model = RandomForestClassifier(random_state=0).fit(train_X, train_y)


import eli5

from eli5.sklearn import PermutationImportance

perm = PermutationImportance(my_model, random_state=1).fit(val_X, val_y)

eli5.show_weights(perm, feature_names = val_X.columns.tolist())
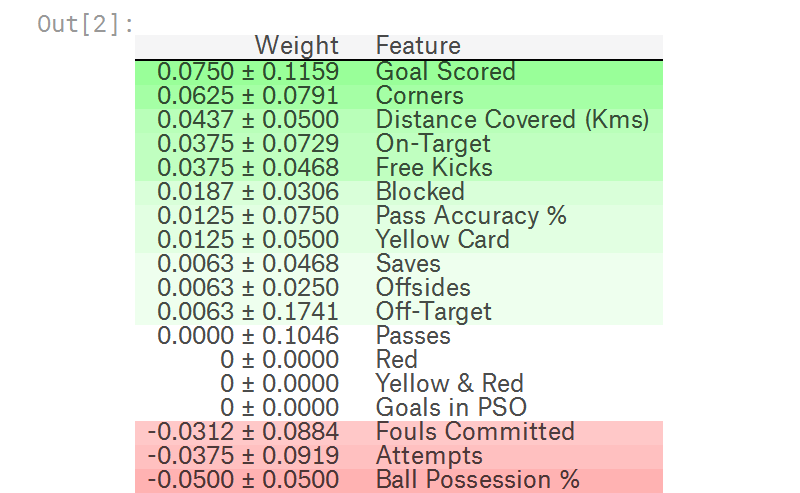
官方例程输出如下,其中排在前面的是更重要的feature,排在后面的是不那么重要的feature,最后偶然出现负数,也是正常现象。
毕竟是shuffle feature data,对一些不太重要的feature,偶尔出现shuffle后比shuffle前更准确也时有发生。
Partial Dependence Plots
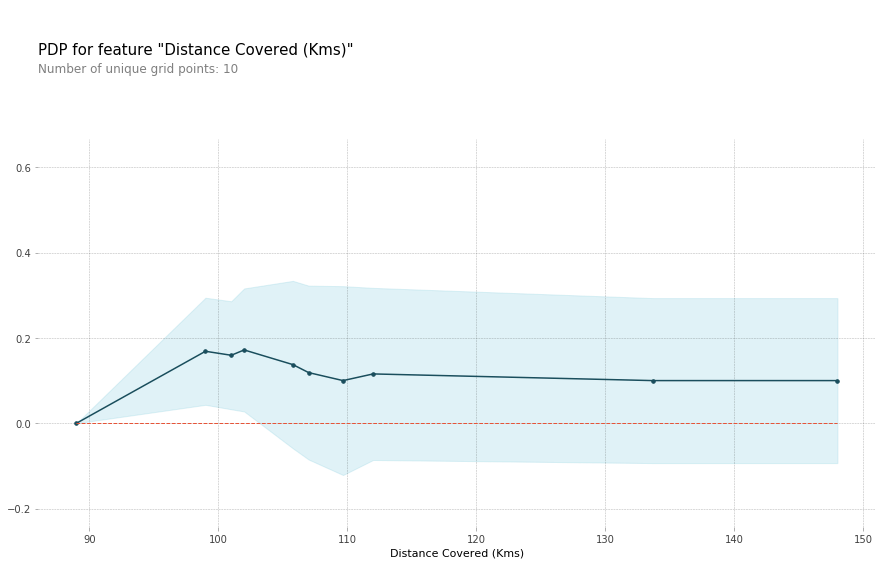
用于统计feature(s)如何影响predictions,用pdpbox库
单个feature的影响
# Build Random Forest model

rf_model = RandomForestClassifier(random_state=0).fit(train_X, train_y)

pdp_dist = pdp.pdp_isolate(model=rf_model, dataset=val_X, model_features=feature_names, feature=feature_to_plot)

pdp.pdp_plot(pdp_dist, feature_to_plot)

plt.show()
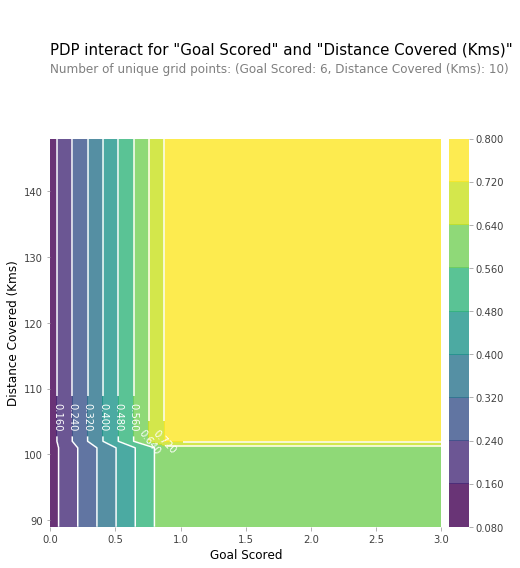
两个features的组合影响
# Similar to previous PDP plot except we use pdp_interact instead of pdp_isolate and pdp_interact_plot instead of pdp_isolate_plot

features_to_plot = ['Goal Scored', 'Distance Covered (Kms)']

inter1  =  pdp.pdp_interact(model=tree_model, dataset=val_X, model_features=feature_names, features=features_to_plot)

pdp.pdp_interact_plot(pdp_interact_out=inter1, feature_names=features_to_plot, plot_type='contour')

plt.show()
SHAP Values, SHapley Additive exPlanations
对于特定sample的预测,解释每个feature在其中的影响,正负都有。
可用于:
- 一个模型说银行不应该借钱给别人,法律要求银行解释每笔贷款被拒的原因。
- 医疗服务提供者想要确定,是什么因素导致了每个病人患某些疾病的风险,这样他们就可以通过有针对性的健康干预,直接解决这些风险因素
使用shap库,代码片段如下,其中KernelExplainer 结果和TreeExplainer不完全一样,但是比较接近,结果中表达的意思相同。
import shap  # package used to calculate Shap values

# Create object that can calculate shap values

explainer = shap.TreeExplainer(my_model)

# Calculate Shap values

shap_values = explainer.shap_values(data_for_prediction)

shap.initjs()

shap.force_plot(explainer.expected_value[1], shap_values[1], data_for_prediction)

# use Kernel SHAP to explain test set predictions

k_explainer = shap.KernelExplainer(my_model.predict_proba, train_X)

k_shap_values = k_explainer.shap_values(data_for_prediction)

shap.force_plot(k_explainer.expected_value[1], k_shap_values[1], data_for_prediction)
运行结果的图表类似如下图形,
- 其中左边(红色)代表当前样本相对于baseline增加的预测值
- 右边(蓝色)代表当前样本相对于baseline减少的预测值
- 左边(红色) - 右边(蓝色) => output_value - base_value

Advanced Uses of SHAP Values
Summary Plots
import shap  # package used to calculate Shap values

# Create object that can calculate shap values

explainer = shap.TreeExplainer(my_model)

# calculate shap values. This is what we will plot.

# Calculate shap_values for all of val_X rather than a single row, to have more data for plot.

shap_values = explainer.shap_values(val_X)

# Make plot. Index of [1] is explained in text below.

shap.summary_plot(shap_values[1], val_X)
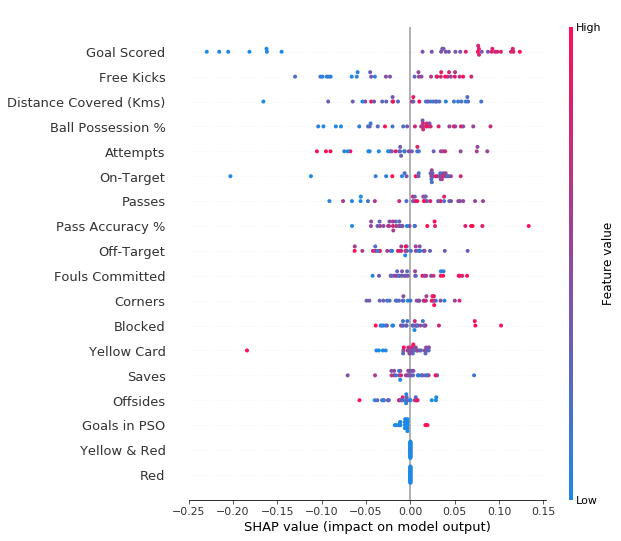
结果如下图所示:
- 每个点代表一个sample
- 垂直方向是特征
- 水平方向是该特征对应的SHAP Value
- 颜色代表该特征的数值大小
SHAP Dependence Contribution Plots
import shap  # package used to calculate Shap values

# Create object that can calculate shap values

explainer = shap.TreeExplainer(my_model)

# calculate shap values. This is what we will plot.

shap_values = explainer.shap_values(X)

# make plot.

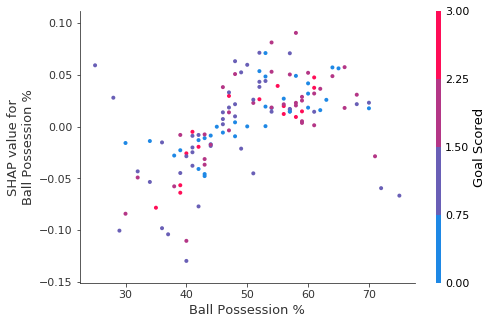
shap.dependence_plot('Ball Possession %', shap_values[1], X, interaction_index="Goal Scored")
运行结果图简介:
- 横坐标表示Ball Possession %特征的值
- 纵坐标表示SHAP Value值
- 颜色(如右边注释)表示Goal Scored特征的值
学习小记: Kaggle Learn - Machine Learning Explainability的更多相关文章
- How do I learn machine learning?
https://www.quora.com/How-do-I-learn-machine-learning-1?redirected_qid=6578644 How Can I Learn X? ...
- ML Lecture 0-2: Why we need to learn machine learning?
在Github上也po了这个系列学习笔记(MachineLearningCourseNote),觉得写的不错的小伙伴欢迎来给项目点个赞哦~~ ML Lecture 0-2: Why we need t ...
- kaggle _Titanic: Machine Learning from Disaster
A Data Science Framework: To Achieve 99% Accuracy https://www.kaggle.com/ldfreeman3/a-data-science-f ...
- Kaggle:Titanic: Machine Learning from Disaster
一直想着抓取股票的变化,偶然的机会在看股票数据抓取的博客看到了kaggle,然后看了看里面的题,感觉挺新颖的,就试了试. 题目如图:给了一个train.csv,现在预测test.csv里面的Passa ...
- 李宏毅老师机器学习课程笔记_ML Lecture 0-2: Why we need to learn machine learning?
引言: 最近开始学习"机器学习",早就听说祖国宝岛的李宏毅老师的大名,一直没有时间看他的系列课程.今天听了一课,感觉非常棒,通俗易懂,而又能够抓住重点,中间还能加上一些很有趣的例子 ...
- 机器学习案例学习【每周一例】之 Titanic: Machine Learning from Disaster
下面一文章就总结几点关键: 1.要学会观察,尤其是输入数据的特征提取时,看各输入数据和输出的关系,用绘图看! 2.训练后,看测试数据和训练数据误差,确定是否过拟合还是欠拟合: 3.欠拟合的话,说明模 ...
- How do I learn mathematics for machine learning?
https://www.quora.com/How-do-I-learn-mathematics-for-machine-learning How do I learn mathematics f ...
- 【机器学习Machine Learning】资料大全
昨天总结了深度学习的资料,今天把机器学习的资料也总结一下(友情提示:有些网站需要"科学上网"^_^) 推荐几本好书: 1.Pattern Recognition and Machi ...
- In machine learning, is more data always better than better algorithms?
In machine learning, is more data always better than better algorithms? No. There are times when mor ...
随机推荐
- 测试龙芯 LoongArch .NET之 使用 FastTunnel 做内网穿透远程计算机
龙芯3A5000 已经上市,与龙芯3A5000配套的三大编译器GCC.LLVM.GoLang和三大虚拟机Java.JavaScript..NET均已完成开发,从老伙计哪里搞来一台3A5000 机器,安 ...
- jvm源码解读--10 enum WKID 枚举
源码中对于枚举类型WKID的使用 static bool initialize_wk_klass(WKID id, int init_opt, TRAPS); static void initiali ...
- videojs踩过的坑
1.videojs-contrib-hls 在webpack中不能用,解决方法:window.videojs = videojs:出处 https://github.com/videojs/video ...
- 开源ERP和其它ERP软件比较
现在有许多企业将ERP项目,在企业中没有实施好,都归咎于软件产品不好.其实,这只是你们的借口.若想要将ERP软件真正与企业融合一体,首先得考虑企业的自身情况,再去选择适合的 ERP软件. 如果你的企业 ...
- 一文读懂Spring动态配置多数据源---源码详细分析
Spring动态多数据源源码分析及解读 一.为什么要研究Spring动态多数据源 期初,最开始的原因是:想将答题服务中发送主观题答题数据给批改中间件这块抽象出来, 但这块主要使用的是mq消息的方式 ...
- Mybatis学习笔记-日志
日志工厂 如果一个数据库操作出现异常,在排错时,则需要日志 SLF4J Apache Commons Logging(COMMONS_LOGGING) LOG4J LOG4J2 JDK logging ...
- [.NET大牛之路 005] .NET 的执行模型
.NET大牛之路 • 王亮@精致码农 • 2021.07.06 前面我们介绍 .NET 历史时讲过,微软基于 .NET Framework 重新设计并创造了跨平台的 .NET Core,目前已经发展到 ...
- [Ynoi2011]初始化 题解
第一道Ynoi,纪念一下. 众所周知,Ynoi会进行惨无人道的卡常操作,所以我们可以使用暴力去做Ynoi. 于是乎,我们考虑分块+暴力. 对于操作2,不难发现是道裸的分块,可以抄P3372的代码. 对 ...
- alpakka-kafka(6)-kafka应用案例,用户接口
了解了kafka原理之后,对kafka的的应用场景有了一些想法.在下面的一系列讨论中把最近一个项目中关于kafka的应用介绍一下. 先介绍一下使用kafka的起因:任何进销存系统,销售开单部分都应该算 ...
- C++//菱形继承 //俩个派生类继承同一个基类 //又有某个类同时继承俩个派生类 //成为 菱形继承 或者 钻石 继承//+解决
1 //菱形继承 2 //俩个派生类继承同一个基类 3 //又有某个类同时继承俩个派生类 4 //成为 菱形继承 或者 钻石 继承 5 6 #include <iostream> 7 #i ...