利用openxml在Excel中插入图表
using System.Collections.Generic;
using System.Linq;
using DOD = DocumentFormat.OpenXml.Drawing;
using DODC = DocumentFormat.OpenXml.Drawing.Charts;
using DODS = DocumentFormat.OpenXml.Drawing.Spreadsheet;
using DOS = DocumentFormat.OpenXml.Spreadsheet;
using DOX = DocumentFormat.OpenXml;
using pkg = DocumentFormat.OpenXml.Packaging; namespace InsertChartTest
{
class Program
{
const string fileName = @"C:\Users\Administrator\source\repos\OpenXMLStudy\OpenXMLStudy\Sum100.xlsx"; static void Main(string[] args)
{
string worksheetName = "Joe";
string title = "New Chart";
Dictionary<string, int> data = new Dictionary<string, int>();
data.Add("abc", );
data.Add("dsa", );
InsertChartInSpreadsheet(fileName, worksheetName, title, data); } private static void InsertChartInSpreadsheet(string docName, string worksheetName, string title,
Dictionary<string, int> data)
{
using (pkg.SpreadsheetDocument document = pkg.SpreadsheetDocument.Open(docName, true))
{
IEnumerable<DOS.Sheet> sheets = document.WorkbookPart.Workbook.Descendants<DOS.Sheet>(); if (sheets == null || sheets.Count() <= )
return; pkg.WorksheetPart worksheetPart = (pkg.WorksheetPart)document.WorkbookPart.GetPartById(sheets.First().Id); System.Diagnostics.Debug.WriteLine("SheetID:{0}", sheets.First().Id); // DOS.Worksheet worksheet = worksheetPart.Worksheet;
pkg.DrawingsPart drawingsPart = worksheetPart.AddNewPart<pkg.DrawingsPart>(); worksheetPart.Worksheet.Append(new DOS.Drawing()
{
Id = worksheetPart.GetIdOfPart(drawingsPart)
});
worksheetPart.Worksheet.Save(); pkg.ChartPart chartPart = drawingsPart.AddNewPart<pkg.ChartPart>(); //图表实例
chartPart.ChartSpace = new DODC.ChartSpace(); chartPart.ChartSpace.Append(
new DODC.EditingLanguage()
{
Val = new DOX.StringValue("en-US")
}); //图表最外层
DODC.Chart chart = chartPart.ChartSpace.AppendChild<DODC.Chart>(new DODC.Chart()); //图形区
DODC.PlotArea plotArea = chart.AppendChild<DODC.PlotArea>(new DODC.PlotArea()); //布局
DODC.Layout layout = plotArea.AppendChild<DODC.Layout>(new DODC.Layout()); //柱形图
DODC.BarChart barChart = plotArea
.AppendChild<DODC.BarChart>(
new DODC.BarChart(
new DODC.BarDirection()
{
Val = new DOX.EnumValue<DODC.BarDirectionValues>(DODC.BarDirectionValues.Column)
},
new DODC.BarGrouping()
{
Val = new DOX.EnumValue<DODC.BarGroupingValues>(DODC.BarGroupingValues.Clustered)
})); uint i = ; foreach (string key in data.Keys)
{
//柱形图序列
DODC.BarChartSeries barChartSeries = barChart
.AppendChild<DODC.BarChartSeries>(
new DODC.BarChartSeries(//柱形图序列
new DODC.Index()
{
Val = new DOX.UInt32Value(i)
},
new DODC.Order()
{
Val = new DOX.UInt32Value(i)
},
new DODC.SeriesText( //系列文本
new DODC.NumericValue()
{
Text = key
})
)); //字符串常值
DODC.StringLiteral strLit = barChartSeries
.AppendChild<DODC.CategoryAxisData>(
new DODC.CategoryAxisData())
.AppendChild<DODC.StringLiteral>(
new DODC.StringLiteral()); strLit.Append(new DODC.PointCount()
{
Val = new DOX.UInt32Value(1U)
}); strLit.AppendChild<DODC.StringPoint>(new DODC.StringPoint()
{
Index = new DOX.UInt32Value(0U)
})
.Append(new DODC.NumericValue(key)); //原为title //值常值
DODC.NumberLiteral numLit = barChartSeries
.AppendChild<DODC.Values>(new DODC.Values()
).AppendChild<DODC.NumberLiteral>(new DODC.NumberLiteral()
); numLit.Append(new DODC.FormatCode("General")); numLit.Append(new DODC.PointCount()
{
Val = new DOX.UInt32Value(1U)
}); numLit.AppendChild<DODC.NumericPoint>(new DODC.NumericPoint()
{
Index = new DOX.UInt32Value(0u)
}).Append(new DODC.NumericValue(data[key].ToString())); i++;
} barChart.Append(new DODC.AxisId()
{
Val = new DOX.UInt32Value(48650112u)
}); barChart.Append(new DODC.AxisId()
{
Val = new DOX.UInt32Value(48672768u)
}); //分类坐标值
DODC.CategoryAxis catAx = plotArea.AppendChild<DODC.CategoryAxis>(
new DODC.CategoryAxis(
new DODC.AxisId()
{
Val = new DOX.UInt32Value(48650112u)
},
new DODC.Scaling(new DODC.Orientation()
{
Val = new DOX.EnumValue<DODC.OrientationValues>(DODC.OrientationValues.MinMax)
}),
new DODC.AxisPosition()//坐标值位置
{
Val = new DOX.EnumValue<DODC.AxisPositionValues>(DODC.AxisPositionValues.Bottom)
},
new DODC.TickLabelPosition()//标签位置
{
Val = new DOX.EnumValue<DODC.TickLabelPositionValues>(DODC.TickLabelPositionValues.NextTo)
},
new DODC.CrossingAxis()
{
Val = new DOX.UInt32Value(48672768U)
},
new DODC.Crosses()
{
Val = new DOX.EnumValue<DODC.CrossesValues>(DODC.CrossesValues.AutoZero)
},
new DODC.AutoLabeled()
{
Val = new DOX.BooleanValue(true)
},
new DODC.LabelAlignment()
{
Val = new DOX.EnumValue<DODC.LabelAlignmentValues>(DODC.LabelAlignmentValues.Center)
},
new DODC.LabelOffset()
{
Val = new DOX.UInt16Value((ushort))
}
)); //值坐标值
DODC.ValueAxis valAx = plotArea.AppendChild<DODC.ValueAxis>(
new DODC.ValueAxis(
new DODC.AxisId()
{
Val = new DOX.UInt32Value(48672768u)
},
new DODC.Scaling(
new DODC.Orientation()
{
Val = new DOX.EnumValue<DODC.OrientationValues>(DODC.OrientationValues.MinMax)
}),
new DODC.AxisPosition()
{
Val = new DOX.EnumValue<DODC.AxisPositionValues>(DODC.AxisPositionValues.Left)
},
new DODC.MajorGridlines(),
new DODC.NumberingFormat()
{
FormatCode = new DOX.StringValue("General"),
SourceLinked = new DOX.BooleanValue(true)
},
new DODC.TickLabelPosition()
{
Val = new DOX.EnumValue<DODC.TickLabelPositionValues>(DODC.TickLabelPositionValues.NextTo)
},
new DODC.CrossingAxis()
{
Val = new DOX.UInt32Value(48650112U)
},
new DODC.Crosses()
{
Val = new DOX.EnumValue<DODC.CrossesValues>(DODC.CrossesValues.AutoZero)
},
new DODC.CrossBetween()
{
Val = new DOX.EnumValue<DODC.CrossBetweenValues>(DODC.CrossBetweenValues.Between)
})); //图例
DODC.Legend legend = chart.AppendChild<DODC.Legend>(
new DODC.Legend(
new DODC.LegendPosition()
{
Val = new DOX.EnumValue<DODC.LegendPositionValues>(DODC.LegendPositionValues.Right) //图例位置
})); //图可见
chart.Append(new DODC.PlotVisibleOnly()
{
Val = new DOX.BooleanValue(true)
}); chartPart.ChartSpace.Save(); drawingsPart.WorksheetDrawing = new DODS.WorksheetDrawing(); //图例和图形区域大小
DODS.TwoCellAnchor twoCellAnchor = drawingsPart.WorksheetDrawing.AppendChild<DODS.TwoCellAnchor>(new DODS.TwoCellAnchor()); //图形区域大小
twoCellAnchor.Append(new DODS.FromMarker(new DODS.ColumnId(""),
new DODS.ColumnOffset(""),
new DODS.RowId(""),
new DODS.RowOffset(""))); //图例区域大小
twoCellAnchor.Append(new DODS.ToMarker(new DODS.ColumnId(""),
new DODS.ColumnOffset(""),
new DODS.RowId(""),
new DODS.RowOffset(""))); //添加图形和图例到区域中
//图形框架
DODS.GraphicFrame graphicFrame =
twoCellAnchor.AppendChild<DODS.GraphicFrame>(new DODS.GraphicFrame());
graphicFrame.Macro = ""; //图表标题
graphicFrame.Append(
new DODS.NonVisualGraphicFrameProperties(
new DODS.NonVisualDrawingProperties()
{
Id = new DOX.UInt32Value(2u),
Name = "Chart 1"
},
new DODS.NonVisualGraphicFrameDrawingProperties()
)); //区域坐标
graphicFrame.Append(
new DODS.Transform(
new DOD.Offset()
{
X = 0L,
Y = 0L
},
new DOD.Extents()
{
Cx = 0L,
Cy = 0L
}
)); //把图形添加到区域中
graphicFrame.Append(
new DOD.Graphic(
new DOD.GraphicData(
new DODC.ChartReference()
{
Id = drawingsPart.GetIdOfPart(chartPart)//指定图形ID
})
{ Uri = "http://schemas.openxmlformats.org/drawingml/2006/chart" }
)); twoCellAnchor.Append(new DODS.ClientData()); drawingsPart.WorksheetDrawing.Save(); }
}
}
}
运行上面代码得到图表如图:
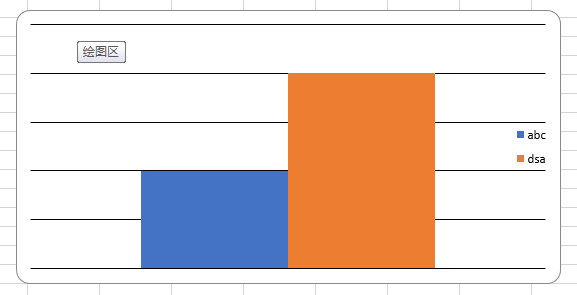
注意:上面代码不支持重复运行
利用openxml在Excel中插入图表的更多相关文章
- java 在Excel中插入图片 POI实现
一.POI简介 Jakarta POI 是apache的子项目,目标是处理ole2对象.它提供了一组操纵Windows文档的Java API 目前比较成熟的是HSSF接口,处理MS Excel(97- ...
- java POI实现向Excel中插入图片
做Web开发免不了要与Excel打交道.今天老大给我一个任务-导出Excel.开始想的还是蛮简单的,无非就是查找,构建Excel,response下载即可.但是有一点不同,就是要加入图片, ...
- 利用POI获取Excel中图片和图片位置
利用POI获取Excel中图片和图片位置(支持excel2003or2007多sheet) 转自:http://blog.csdn.net/delongcpp/article/details/8833 ...
- 如何使用VSTO自动将Excel中的图表复制到Word
如何使用VSTO自动将Excel中的图表复制到Word 原文地址:https://code.msdn.microsoft.com/How-to-copy-Chart-in-Excel-a29f9029 ...
- 利用Kettle 从Excel中抽取数据写入SQLite
SQLite作为一种数据库可以配置为Kettle的数据输入和输出,这个例子是从Excel中抽取数据然后写入到SQLite中 配置测试并成功后如下 下面是配置步骤: Excel输入配置 sqlite配置 ...
- Java 添加、读取、删除Excel中的图表趋势线
本文以Java示例介绍如何在Excel中添加趋势线,以及读取趋势线公式.通过文中的方法可支持添加6种不同类型的趋势线,包括Linear.Exponential.Logarithmic.Moving A ...
- 使用OpenXml把Excel中的数据导出到DataSet中
public class OpenXmlHelper { /// <summary> /// 读取Excel数据到DataSet中,默认读取所有Sheet中的数据 /// </sum ...
- 利用VBA查找excel中一行某列第一次不为空与最后一列不为空的列数
昨日同事有需求,想知道每个商品第一次销售的月份,以及最后一次销售的月份. 本想通过什么excel函数来解决,但是找了半天也没找到合适的,最后还是通过VBA来解决吧. 使用方法: Excel工具-宏-V ...
- 使用Npoi向Excel中插入图片
先把数据库中的数据都导入到Excel表格中,把图片地址的路径全部转成绝对路径. 使用Npoi读取刚导出的Excle表格,把图片那个单元格的图片路径读出来,然后用文件流读取图片,然后通过Npoi把图片放 ...
随机推荐
- LVS+nginx负载均衡知识点1
lvs+nginx负载均衡 1 学习目标 掌握什么是负载均衡及负载均衡的作用和意义. 了解lvs负载均衡的三种模式. 了解lvs-DR负载均衡部署方法. 掌握nginx实现负载均衡的方法. ...
- Java框架spring Boot学习笔记(七):@Configuration,@bean注解
@Configuration作用在类上,相当于一个xml文件 @bean作用于方法上,相当于xml配置中的<bean>标签 一个例子: 新建一个Springboot工程 新建一个User类 ...
- 解题(DirGraCheckPath--有向图的遍历(深度搜索))
题目描述 对于一个有向图,请实现一个算法,找出两点之间是否存在一条路径. 给定图中的两个结点的指针DirectedGraphNode* a, DirectedGraphNode* b(请不要在意数据类 ...
- React中this.props的主要属性
this.props主要包含:history属性.location属性.match属性 ①history属性又包含 ②location属性又包含 ③match属性又包含
- 词根:lun = moon, 表示“月亮”
词根:lun = moon, 表示“月亮” lunar [lun月亮,-ar形容词后缀,…的] 月亮的,太阴的,似月的,新月形的 semilunar [semi-半,lun月亮,-ar形容词后缀,…的 ...
- java基础 ---- 一维数组
为什么要使用数组: 因为不使用数组计算多个变量的时候太繁琐,不利于数据的处理. -------- 数组也是一个变量,是存储一组相同类型的变量 声明一个变量就是在内存中划出一块合适的空间 声明一个数 ...
- mysql 悲观锁与乐观锁的理解
悲观锁与乐观锁是人们定义出来的概念,你可以理解为一种思想,是处理并发资源的常用手段. 不要把他们与mysql中提供的锁机制(表锁,行锁,排他锁,共享锁)混为一谈. 一.悲观锁 顾名思义,就是对于数据的 ...
- ionic3自定义android原生插件
一.创建一个android项目,编写插件功能,并测试ok,这里以一个简单的调用原生Toast.makeText为例. 1.新建android项目 2.编写插件类 package com.plugin. ...
- P2880 [USACO07JAN]平衡的阵容Balanced Lineup(RMQ的倍增模板)
题面:P2880 [USACO07JAN]平衡的阵容Balanced Lineup RMQ问题:给定一个长度为N的区间,M个询问,每次询问Li到Ri这段区间元素的最大值/最小值. RMQ的高级写法一般 ...
- python基础之Day23
1.封装 什么是? 封:明确地把属性隐藏起来 ,对外隐藏,对内开放 申请名称空间,往里面装入一系列名字 /属性(类比 类 和对象 只是装的概念) 为什么要用? __init__往对象里丢属性 封装 ...