HTML5 Chart.js 框架
HTML5 Chart.js 框架
版权声明:未经博主授权,内容严禁转载 !
Chart.js 概述:
chart.js 是一个简单的、面向对象、为设计者开发者准备的图表绘制工具。

chart.js 的特点
基于 HTML5
chart.js 基于 HTML5 canvas 技术,支持所有主流浏览器。
针对 IE7/IE8 提供了降级解决方案。
简单灵活
chart.js 不依赖任何外部工具库,轻量级(压缩后仅仅4.5K)。
提供了加载外部参数的方法。
chart.js 的功能
chart.js 可以用不同的方式让数据变得可视化。
每种类型的图标都有动画效果。
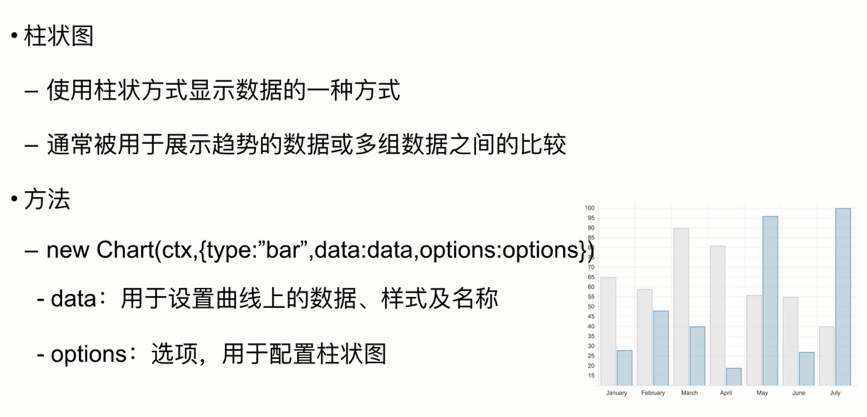
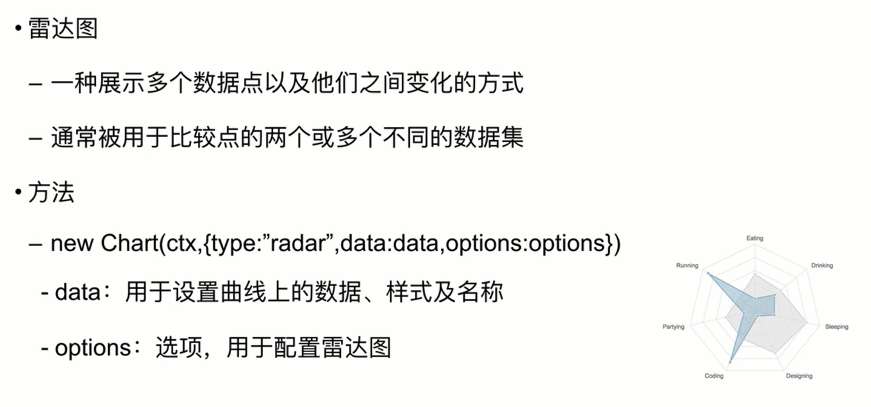
图标的类型:
- 柱状图 - 曲线图 - 雷达图 - 饼状图 - 极地区域图 - 环形图
chart.js 基础
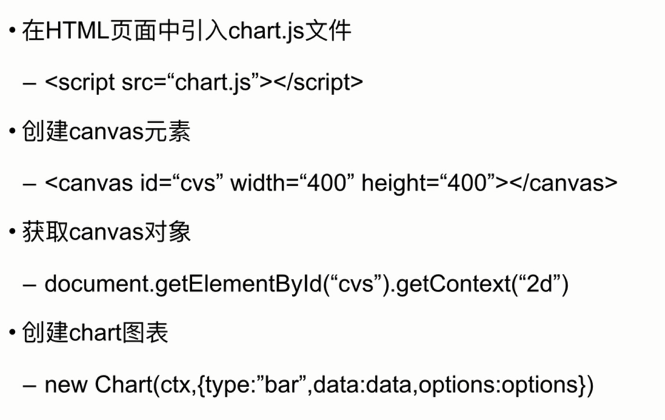


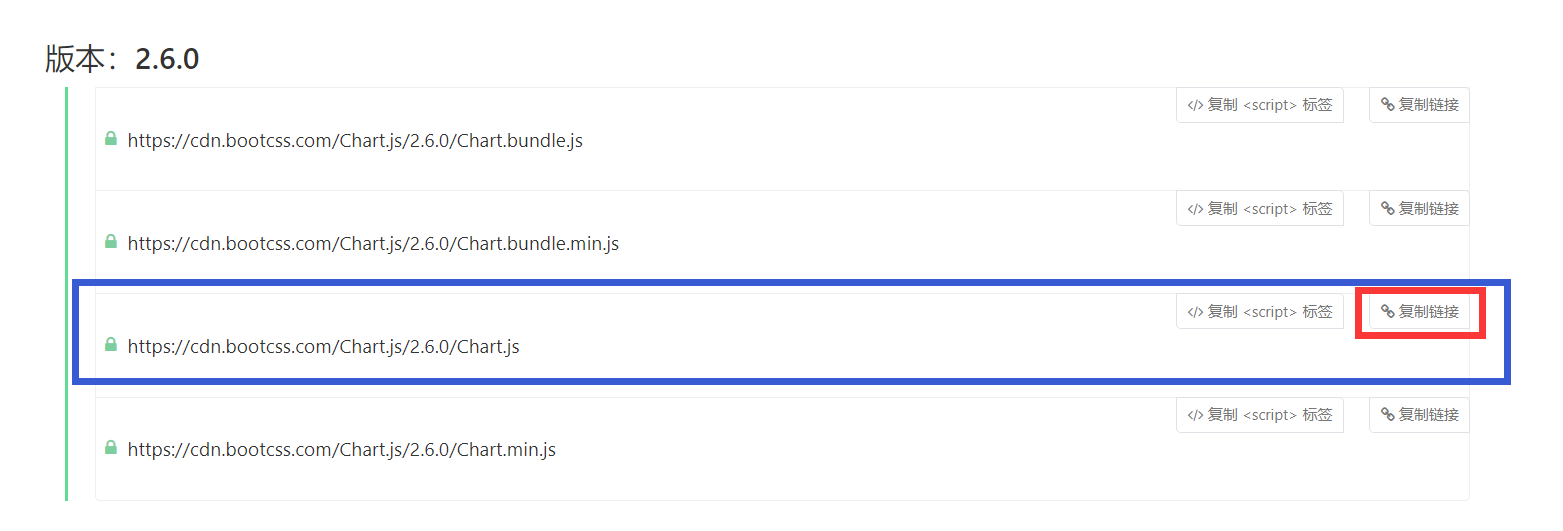
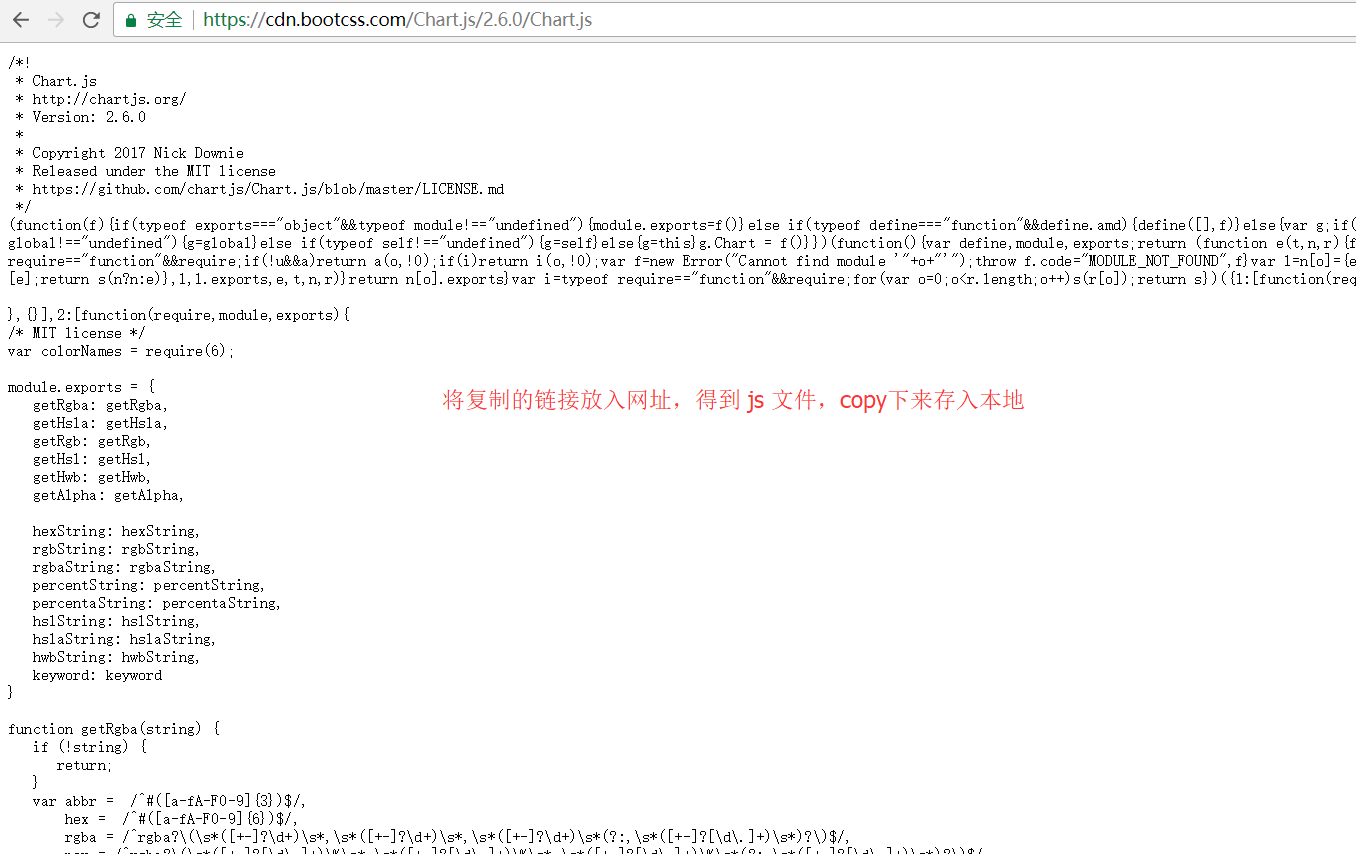

OK,以后就可以在本地使用 chart.js 文件了,不需要再导入网址,没网也可以用了。
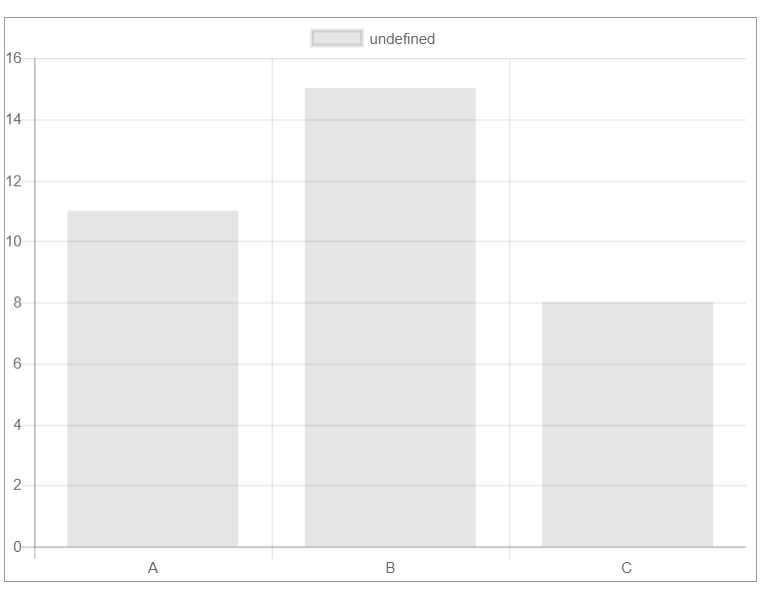
简单基础案例代码
<!-- 导入之前讲解保存好的 js 文件 -->

<script src="mychat.js"></script>

<p style="border: 1px solid #999999; width:600px ;height:450px">

  <canvas id="canvas" width="600" height="450"></canvas>

</p>

<script type="text/javascript">

  var ctx = document.getElementById("canvas").getContext("2d");

  // 创建一个Chart对象

  var mychart = new Chart(ctx,{

    type:"bar",  // 柱状图

    data:{   // 数据:json集合

      labels:["A","B","C"],  // 横坐标轴

      datasets:[   // 各个列数据 : json

        {

          data:[11,15,8]

        }

      ]

    },

    options:{

      scales:{

        yAxes:[

          {

            ticks:{

              beginAtZero:true

            }

          }

        ]

      }

    }

  })

</script>
查看官方文档
就进入了 chart.js 的官方文档,但是比较慢,哈哈,等吧,但是还有一个问题,就是他这个文档是英文的。对 ! English!
官网文档基础案例
<canvas id="myChart" width="400" height="400"></canvas>

<script>

var ctx = document.getElementById("myChart").getContext('2d');

var myChart = new Chart(ctx, {

    type: 'bar',

    data: {

        labels: ["Red", "Blue", "Yellow", "Green", "Purple", "Orange"],

        datasets: [{

            label: '# of Votes',

            data: [12, 19, 3, 5, 2, 3],

            backgroundColor: [

                'rgba(255, 99, 132, 0.2)',

                'rgba(54, 162, 235, 0.2)',

                'rgba(255, 206, 86, 0.2)',

                'rgba(75, 192, 192, 0.2)',

                'rgba(153, 102, 255, 0.2)',

                'rgba(255, 159, 64, 0.2)'

            ],

            borderColor: [

                'rgba(255,99,132,1)',

                'rgba(54, 162, 235, 1)',

                'rgba(255, 206, 86, 1)',

                'rgba(75, 192, 192, 1)',

                'rgba(153, 102, 255, 1)',

                'rgba(255, 159, 64, 1)'

            ],

            borderWidth: 1

        }]

    },

    options: {

        scales: {

            yAxes: [{

                ticks: {

                    beginAtZero:true

                }

            }]

        }

    }

});

</script>
chart.js 基础案例
<!-- 导入之前讲解保存好的 js 文件 -->

<script src="mychat.js"></script>

<p style="border: 1px solid #999999; width:600px ;height:450px">

  <canvas id="canvas" width="600" height="450"></canvas>

</p>

<script type="text/javascript">

  var ctx = document.getElementById("canvas").getContext("2d");

  // 创建一个Chart对象

  var mychart = new Chart(ctx,{

    type:"bar",  // 柱状图

    data:{   // 数据:json集合

      labels:["A","B","C"],  // 帮助我们创出X轴坐标点内容

      datasets:[  // 一个统计图表可以有多个图表

        {

          label:"hhh",   // 标题

          data:[11,15,8],  // X轴各坐标点的数值

          backgroundColor: [  //  条形图 颜色

               'rgba(255, 99, 132, 0.2)',

               'rgba(54, 162, 235, 0.2)',

               'rgba(255, 206, 86, 0.2)'

           ],

           borderColor: [  // 条形图 边框颜色

               'rgba(255,99,132,1)',

               'rgba(54, 162, 235, 1)',

               'rgba(255, 206, 86, 1)'

           ],

           borderWidth: 3 // 边框宽度

        },

        {

          label:"hhh",   // 标题

          data:[11,15,8],  // X轴各坐标点的数值

          backgroundColor: [  //  条形图 颜色

               'rgba(255, 99, 132, 0.2)',

               'rgba(54, 162, 235, 0.2)',

               'rgba(255, 206, 86, 0.2)'

           ],

           borderColor: [  // 条形图 边框颜色

               'rgba(255,99,132,1)',

               'rgba(54, 162, 235, 1)',

               'rgba(255, 206, 86, 1)'

           ],

           borderWidth: 3 // 边框宽度

        }

      ]

    },

    options:{

      scales:{  // 刻度 - Y轴刻度

        yAxes:[

          {

            ticks:{

              beginAtZero:true  // 刻度从 0 开始。

            }

          }

        ]

      },

      layout:{

        padding:{  // 设置内边距

          left:50,

          right:0,

          top:0,

          bottom:0

        }

      },

      legend:{  // 设置标题的颜色

        display:true,

        labels:{

          fontColor :"rgb(255,99,132)"

        }

      },

      title:{  // 设置标题

        display:true,

        text:"这是个标题"

      }

    }

  });

</script>
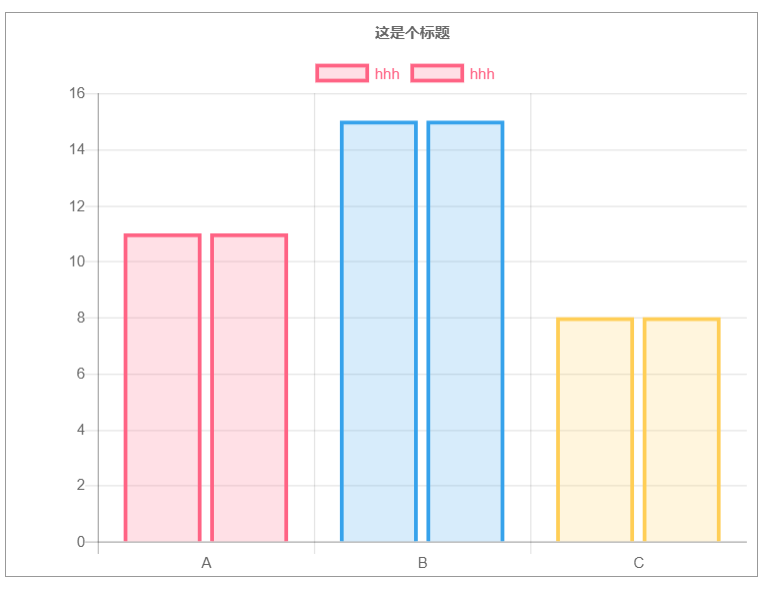
chart.js 的使用
chart.js 曲线图 line

代码案例
<style>

  .chart-container{

    position: relative;

    border: 1px solid #999999;

    margin: auto;

    width: 80vw;

    height: 80vh;

    text-align: center;

  }

</style>

 <script src="mychat.js"></script>

<p class="chart-container">

  <select id="type" class="" name="type">

    <option value="line">曲线图</option>

  </select>

  <button type="button" onclick="changetype()" >生成图表</button>

  <canvas id="myChart"></canvas>

</p>

<script type="text/javascript">

  var ctx = document.getElementById("myChart").getContext("2d");

  var  t = document.getElementById('type').value;

  var d={

    // X 轴显示的文本

    labels:["Sun","Mon","Tue","Wed","Thr","Fri","Sat"],

    datasets:[

      {

        label:"大蜥蜴",

        // 数据集

        data:[parseInt(Math.random()*100),parseInt(Math.random()*100),parseInt(Math.random()*100),parseInt(Math.random()*100),parseInt(Math.random()*100),parseInt(Math.random()*100),parseInt(Math.random()*100)],

        // 边框宽度

        borderWidth:1,

        backgroundColor:[

          'rgba(132,99,244,0.2)',

          'rgba(235,33,244,0.2)',

          'rgba(132,145,158,0.2)',

          'rgba(111,99,54,0.2)',

          'rgba(132,99,144,0.2)',

          'rgba(145,32,25,0.2)',

          'rgba(58,125,222,0.2)'

        ],

        borderColor:[

          'rgba(132,99,244,1)',

          'rgba(235,33,244,1)',

          'rgba(132,145,158,1)',

          'rgba(111,99,54,1)',

          'rgba(132,99,144,1)',

          'rgba(145,32,25,1)',

          'rgba(58,125,222,1)'

        ]

      },

      {

        label:"猪猪侠",

        data:[parseInt(Math.random()*100),parseInt(Math.random()*100),parseInt(Math.random()*100),parseInt(Math.random()*100),parseInt(Math.random()*100),parseInt(Math.random()*100),parseInt(Math.random()*100)],

        borderWidth:1

      }

    ]

  };

  var o ={

    maintainAspectRation:false, // 自动适配,自动根据父容器调整大小。

    scales:{  // 刻度

      yAxes:[

        {

          // ticks:{beginAtZero:true} // 刻度从零开始。

          gridLines:{

            display:false

          }  // 显示竖线。

        }

      ],

      xAxes:[

        {

          gridLines:{

            display:false

          }

        }

      ]

    }

  };

  function changetype() {

    t = document.getElementById('type').value;

    new Chart( ctx , { type: t , data: d , options: o } );

  }

</script>
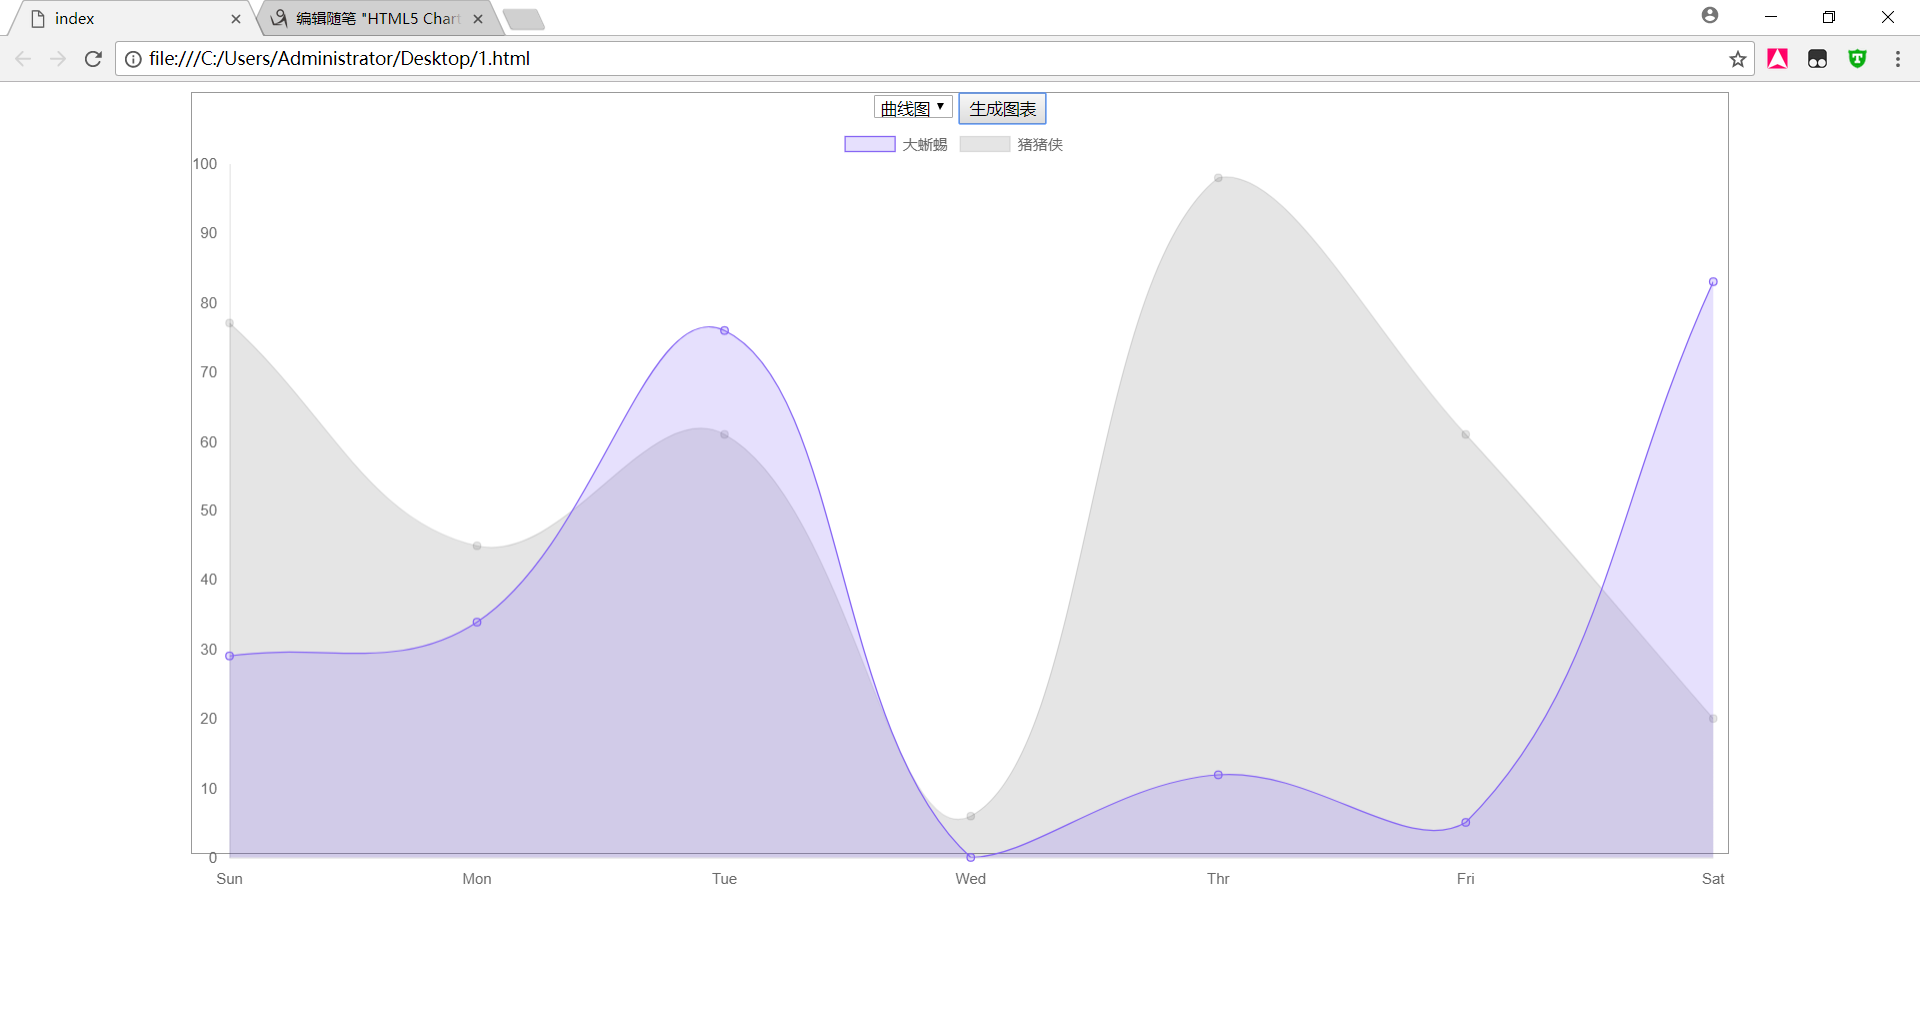
chart.js 柱状图 bar
案例代码
<style>

  .chart-container{

    position: relative;

    border: 1px solid #999999;

    margin: auto;

    width: 80vw;

    height: 80vh;

    text-align: center;

  }

</style>

 <script src="mychat.js"></script>

<p class="chart-container">

  <select id="type" class="" name="type">

    <option value="line">曲线图</option>

    <option value="bar">柱状图</option>

  </select>

  <button type="button" onclick="changetype()" >生成图表</button>

  <canvas id="myChart"></canvas>

</p>

<script type="text/javascript">

  var ctx = document.getElementById("myChart").getContext("2d");

  var  t = document.getElementById('type').value;

  var d={

    // X 轴显示的文本

    labels:["Sun","Mon","Tue","Wed","Thr","Fri","Sat"],

    datasets:[

      {

        label:"大蜥蜴",

        // 数据集

        data:[parseInt(Math.random()*100),parseInt(Math.random()*100),parseInt(Math.random()*100),parseInt(Math.random()*100),parseInt(Math.random()*100),parseInt(Math.random()*100),parseInt(Math.random()*100)],

        // 边框宽度

        borderWidth:1,

        backgroundColor:[

          'rgba(132,99,244,0.2)',

          'rgba(235,33,244,0.2)',

          'rgba(132,145,158,0.2)',

          'rgba(111,99,54,0.2)',

          'rgba(132,99,144,0.2)',

          'rgba(145,32,25,0.2)',

          'rgba(58,125,222,0.2)'

        ],

        borderColor:[

          'rgba(132,99,244,1)',

          'rgba(235,33,244,1)',

          'rgba(132,145,158,1)',

          'rgba(111,99,54,1)',

          'rgba(132,99,144,1)',

          'rgba(145,32,25,1)',

          'rgba(58,125,222,1)'

        ]

      },

      {

        label:"猪猪侠",

        data:[parseInt(Math.random()*100),parseInt(Math.random()*100),parseInt(Math.random()*100),parseInt(Math.random()*100),parseInt(Math.random()*100),parseInt(Math.random()*100),parseInt(Math.random()*100)],

        borderWidth:1

      }

    ]

  };

  var o ={

    maintainAspectRation:false, // 自动适配,自动根据父容器调整大小。

    scales:{  // 刻度

      yAxes:[

        {

          // ticks:{beginAtZero:true} // 刻度从零开始。

          gridLines:{

            display:false

          }  // 显示竖线。

        }

      ],

      xAxes:[

        {

          gridLines:{

            display:false

          }

        }

      ]

    }

  };

  function changetype() {

    t = document.getElementById('type').value;

    new Chart( ctx , { type: t , data: d , options: o } );

  }

</script>
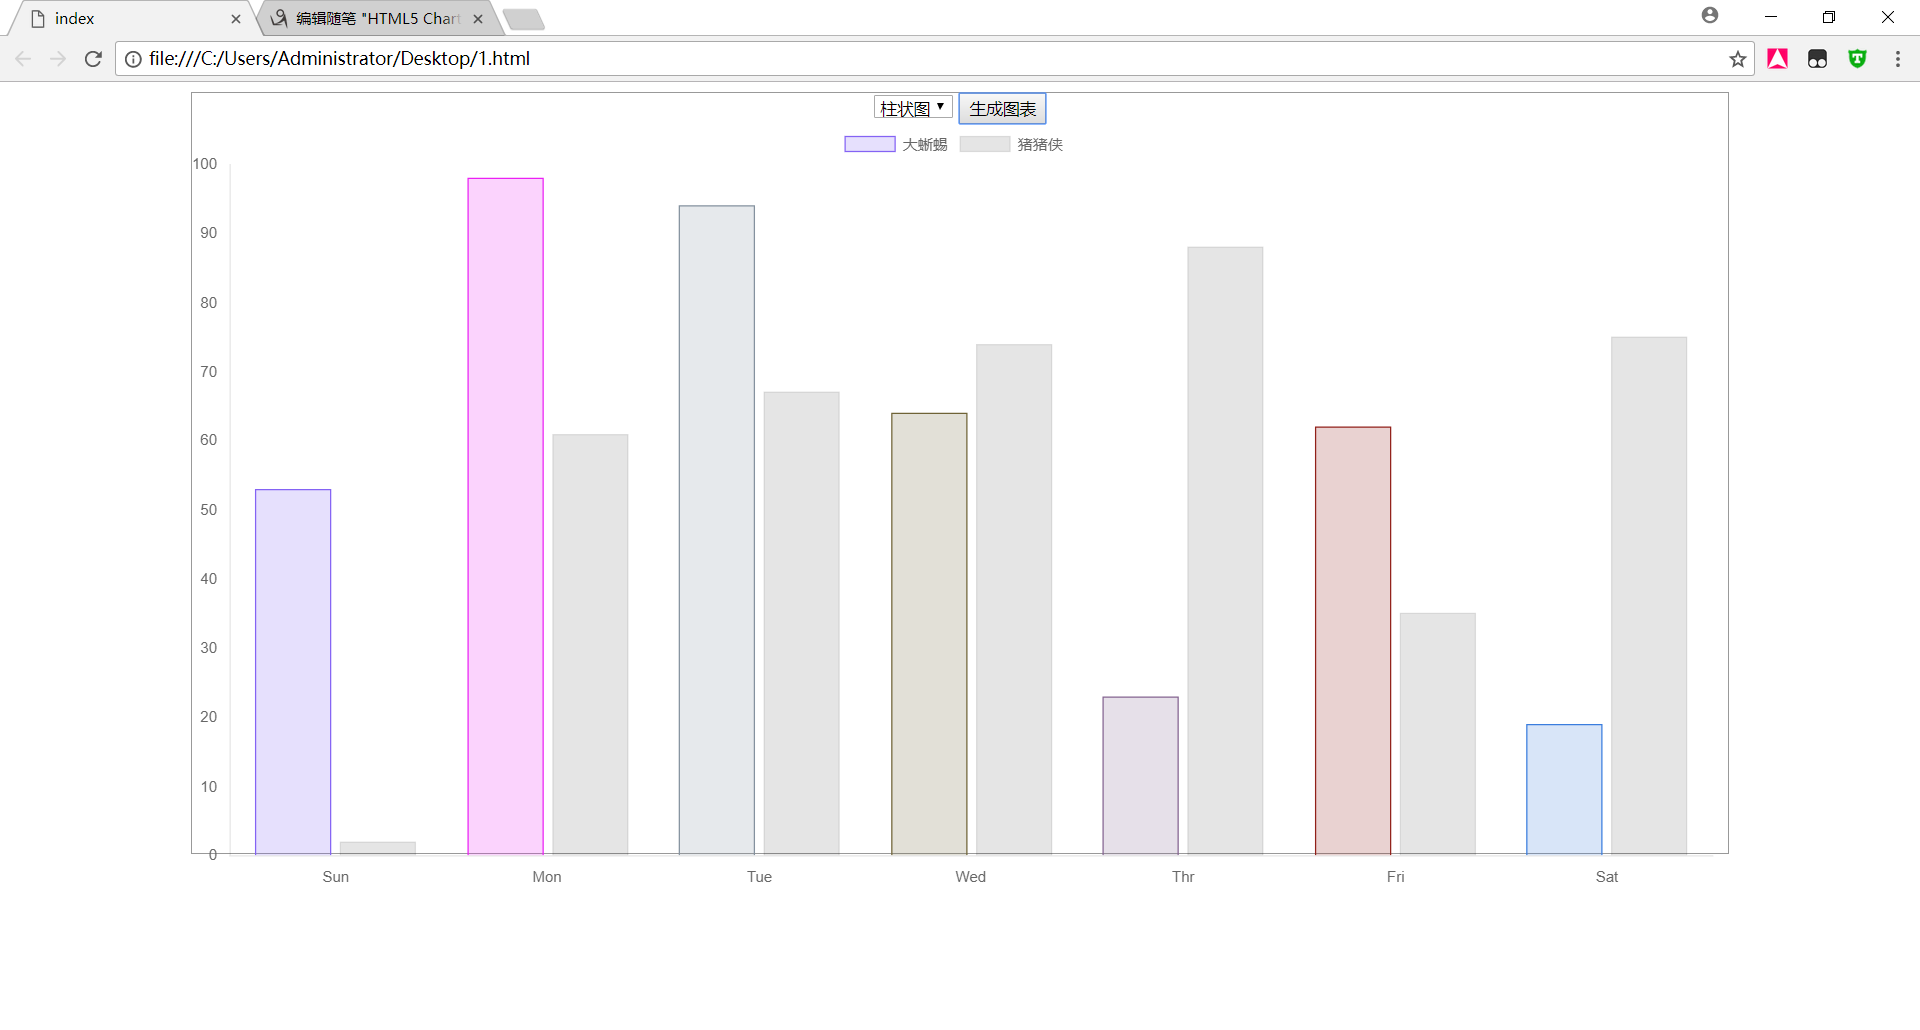
chart.js 饼状图 pie
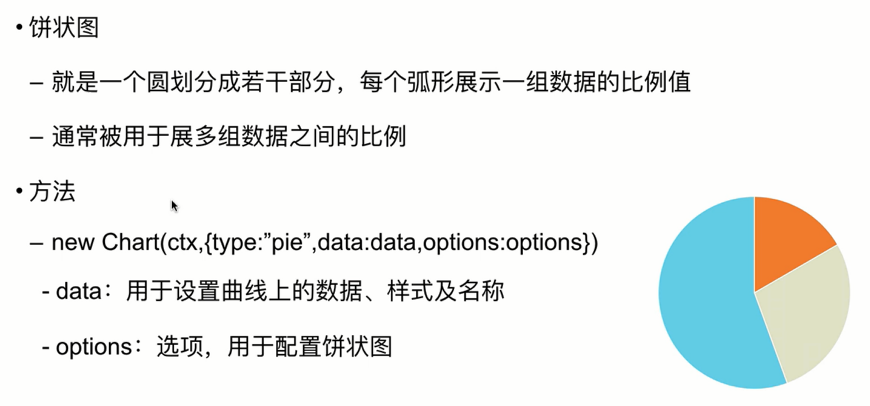
案例代码
<style>

  .chart-container{

    position: relative;

    border: 1px solid #999999;

    margin: auto;

    width: 80vw;

    height: 80vh;

    text-align: center;

  }

</style>

 <script src="mychat.js"></script>

<p class="chart-container">

  <select id="type" class="" name="type">

    <option value="line">曲线图</option>

    <option value="bar">柱状图</option>

    <option value="pie">饼图</option>

  </select>

  <button type="button" onclick="changetype()" >生成图表</button>

  <canvas id="myChart"></canvas>

</p>

<script type="text/javascript">

  var ctx = document.getElementById("myChart").getContext("2d");

  var  t = document.getElementById('type').value;

  var d={

    // X 轴显示的文本

    labels:["Sun","Mon","Tue","Wed","Thr","Fri","Sat"],

    datasets:[

      {

        label:"大蜥蜴",

        // 数据集

        data:[parseInt(Math.random()*100),parseInt(Math.random()*100),parseInt(Math.random()*100),parseInt(Math.random()*100),parseInt(Math.random()*100),parseInt(Math.random()*100),parseInt(Math.random()*100)],

        // 边框宽度

        borderWidth:1,

        backgroundColor:[

          'rgba(132,99,244,0.2)',

          'rgba(235,33,244,0.2)',

          'rgba(132,145,158,0.2)',

          'rgba(111,99,54,0.2)',

          'rgba(132,99,144,0.2)',

          'rgba(145,32,25,0.2)',

          'rgba(58,125,222,0.2)'

        ],

        borderColor:[

          'rgba(132,99,244,1)',

          'rgba(235,33,244,1)',

          'rgba(132,145,158,1)',

          'rgba(111,99,54,1)',

          'rgba(132,99,144,1)',

          'rgba(145,32,25,1)',

          'rgba(58,125,222,1)'

        ]

      },

      {

        label:"猪猪侠",

        data:[parseInt(Math.random()*100),parseInt(Math.random()*100),parseInt(Math.random()*100),parseInt(Math.random()*100),parseInt(Math.random()*100),parseInt(Math.random()*100),parseInt(Math.random()*100)],

        borderWidth:1

      }

    ]

  };

  var o ={

    maintainAspectRation:false, // 自动适配,自动根据父容器调整大小。

    scales:{  // 刻度

      yAxes:[

        {

          // ticks:{beginAtZero:true} // 刻度从零开始。

          gridLines:{

            display:false

          }  // 显示竖线。

        }

      ],

      xAxes:[

        {

          gridLines:{

            display:false

          }

        }

      ]

    }

  };

  function changetype() {

    t = document.getElementById('type').value;

    new Chart( ctx , { type: t , data: d , options: o } );

  }

</script>
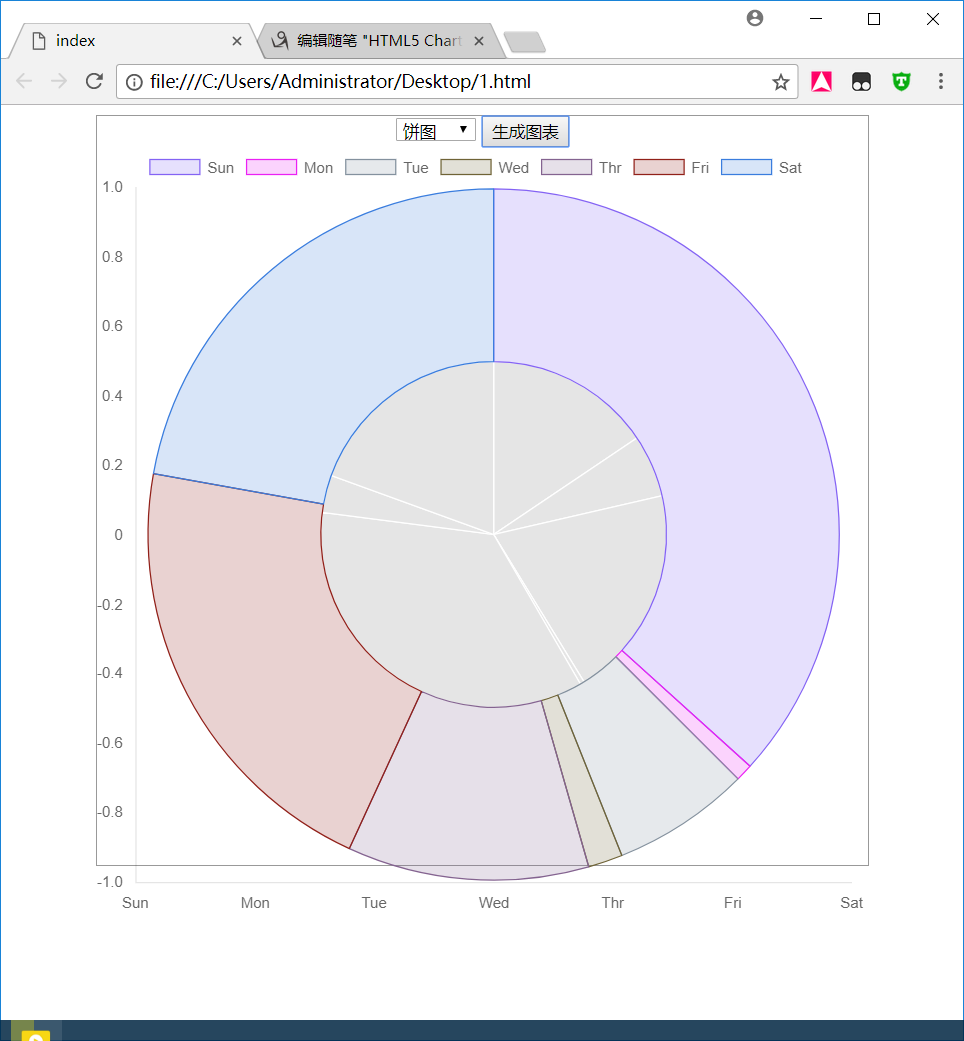
chart.js 雷达图 radar
案例代码
<style>

  .chart-container{

    position: relative;

    border: 1px solid #999999;

    margin: auto;

    width: 80vw;

    height: 80vh;

    text-align: center;

  }

</style>

 <script src="mychat.js"></script>

<p class="chart-container">

  <select id="type" class="" name="type">

    <option value="line">曲线图</option>

    <option value="bar">柱状图</option>

    <option value="pie">饼图</option>

    <option value="radar">雷达图</option>

  </select>

  <button type="button" onclick="changetype()" >生成图表</button>

  <canvas id="myChart"></canvas>

</p>

<script type="text/javascript">

  var ctx = document.getElementById("myChart").getContext("2d");

  var  t = document.getElementById('type').value;

  var d={

    // X 轴显示的文本

    labels:["Sun","Mon","Tue","Wed","Thr","Fri","Sat"],

    datasets:[

      {

        label:"大蜥蜴",

        // 数据集

        data:[parseInt(Math.random()*100),parseInt(Math.random()*100),parseInt(Math.random()*100),parseInt(Math.random()*100),parseInt(Math.random()*100),parseInt(Math.random()*100),parseInt(Math.random()*100)],

        // 边框宽度

        borderWidth:1,

        backgroundColor:[

          'rgba(132,99,244,0.2)',

          'rgba(235,33,244,0.2)',

          'rgba(132,145,158,0.2)',

          'rgba(111,99,54,0.2)',

          'rgba(132,99,144,0.2)',

          'rgba(145,32,25,0.2)',

          'rgba(58,125,222,0.2)'

        ],

        borderColor:[

          'rgba(132,99,244,1)',

          'rgba(235,33,244,1)',

          'rgba(132,145,158,1)',

          'rgba(111,99,54,1)',

          'rgba(132,99,144,1)',

          'rgba(145,32,25,1)',

          'rgba(58,125,222,1)'

        ]

      },

      {

        label:"猪猪侠",

        data:[parseInt(Math.random()*100),parseInt(Math.random()*100),parseInt(Math.random()*100),parseInt(Math.random()*100),parseInt(Math.random()*100),parseInt(Math.random()*100),parseInt(Math.random()*100)],

        borderWidth:1

      }

    ]

  };

  var o ={

    maintainAspectRation:false, // 自动适配,自动根据父容器调整大小。

    scales:{  // 刻度

      yAxes:[

        {

          // ticks:{beginAtZero:true} // 刻度从零开始。

          gridLines:{

            display:false

          }  // 显示竖线。

        }

      ],

      xAxes:[

        {

          gridLines:{

            display:false

          }

        }

      ]

    }

  };

  function changetype() {

    t = document.getElementById('type').value;

    new Chart( ctx , { type: t , data: d , options: o } );

  }

</script>
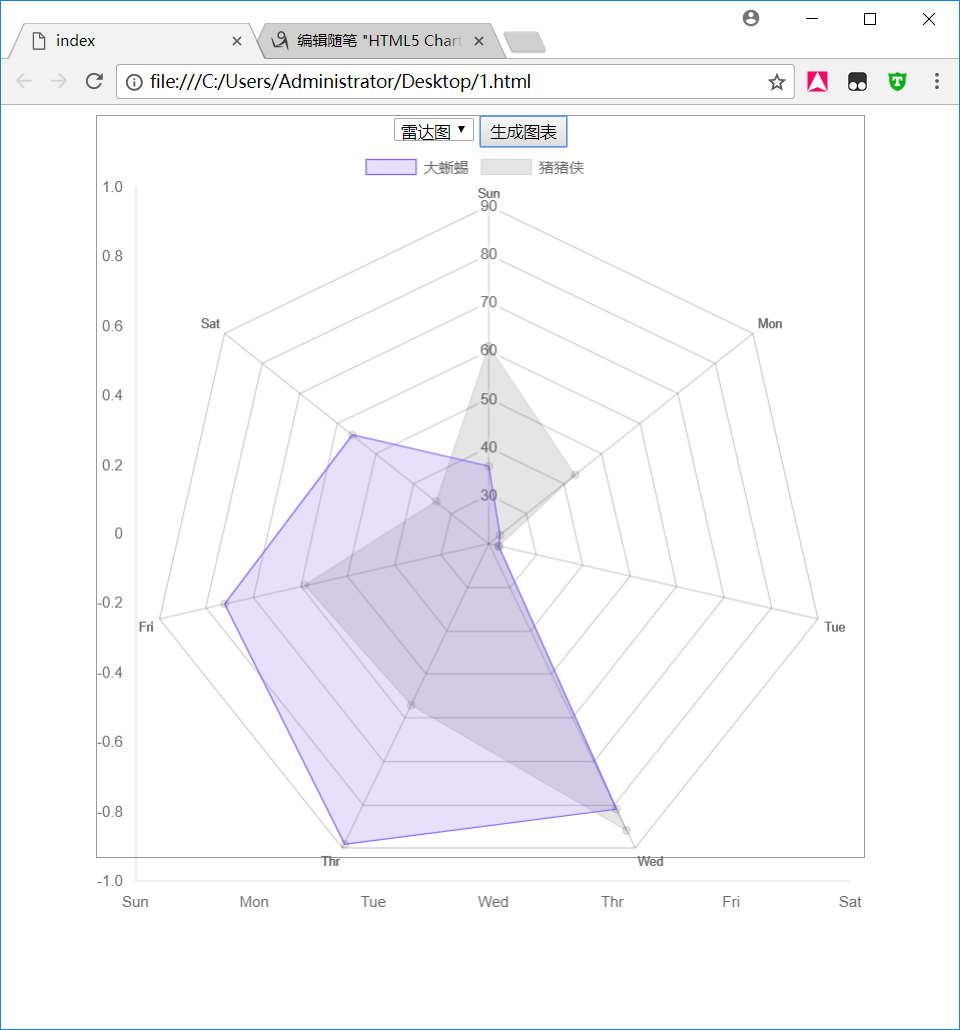
chart.js 极地区域图 polarArea

案例代码
<style>

  .chart-container{

    position: relative;

    border: 1px solid #999999;

    margin: auto;

    width: 80vw;

    height: 80vh;

    text-align: center;

  }

</style>

 <script src="mychat.js"></script>

<p class="chart-container">

  <select id="type" class="" name="type">

    <option value="line">曲线图</option>

    <option value="bar">柱状图</option>

    <option value="pie">饼图</option>

    <option value="radar">雷达图</option>

    <option value="polarArea">极地区域图</option>

  </select>

  <button type="button" onclick="changetype()" >生成图表</button>

  <canvas id="myChart"></canvas>

</p>

<script type="text/javascript">

  var ctx = document.getElementById("myChart").getContext("2d");

  var  t = document.getElementById('type').value;

  var d={

    // X 轴显示的文本

    labels:["Sun","Mon","Tue","Wed","Thr","Fri","Sat"],

    datasets:[

      {

        label:"大蜥蜴",

        // 数据集

        data:[parseInt(Math.random()*100),parseInt(Math.random()*100),parseInt(Math.random()*100),parseInt(Math.random()*100),parseInt(Math.random()*100),parseInt(Math.random()*100),parseInt(Math.random()*100)],

        // 边框宽度

        borderWidth:1,

        backgroundColor:[

          'rgba(132,99,244,0.2)',

          'rgba(235,33,244,0.2)',

          'rgba(132,145,158,0.2)',

          'rgba(111,99,54,0.2)',

          'rgba(132,99,144,0.2)',

          'rgba(145,32,25,0.2)',

          'rgba(58,125,222,0.2)'

        ],

        borderColor:[

          'rgba(132,99,244,1)',

          'rgba(235,33,244,1)',

          'rgba(132,145,158,1)',

          'rgba(111,99,54,1)',

          'rgba(132,99,144,1)',

          'rgba(145,32,25,1)',

          'rgba(58,125,222,1)'

        ]

      },

      {

        label:"猪猪侠",

        data:[parseInt(Math.random()*100),parseInt(Math.random()*100),parseInt(Math.random()*100),parseInt(Math.random()*100),parseInt(Math.random()*100),parseInt(Math.random()*100),parseInt(Math.random()*100)],

        borderWidth:1

      }

    ]

  };

  var o ={

    maintainAspectRation:false, // 自动适配,自动根据父容器调整大小。

    scales:{  // 刻度

      yAxes:[

        {

          // ticks:{beginAtZero:true} // 刻度从零开始。

          gridLines:{

            display:false

          }  // 显示竖线。

        }

      ],

      xAxes:[

        {

          gridLines:{

            display:false

          }

        }

      ]

    }

  };

  function changetype() {

    t = document.getElementById('type').value;

    new Chart( ctx , { type: t , data: d , options: o } );

  }

</script>
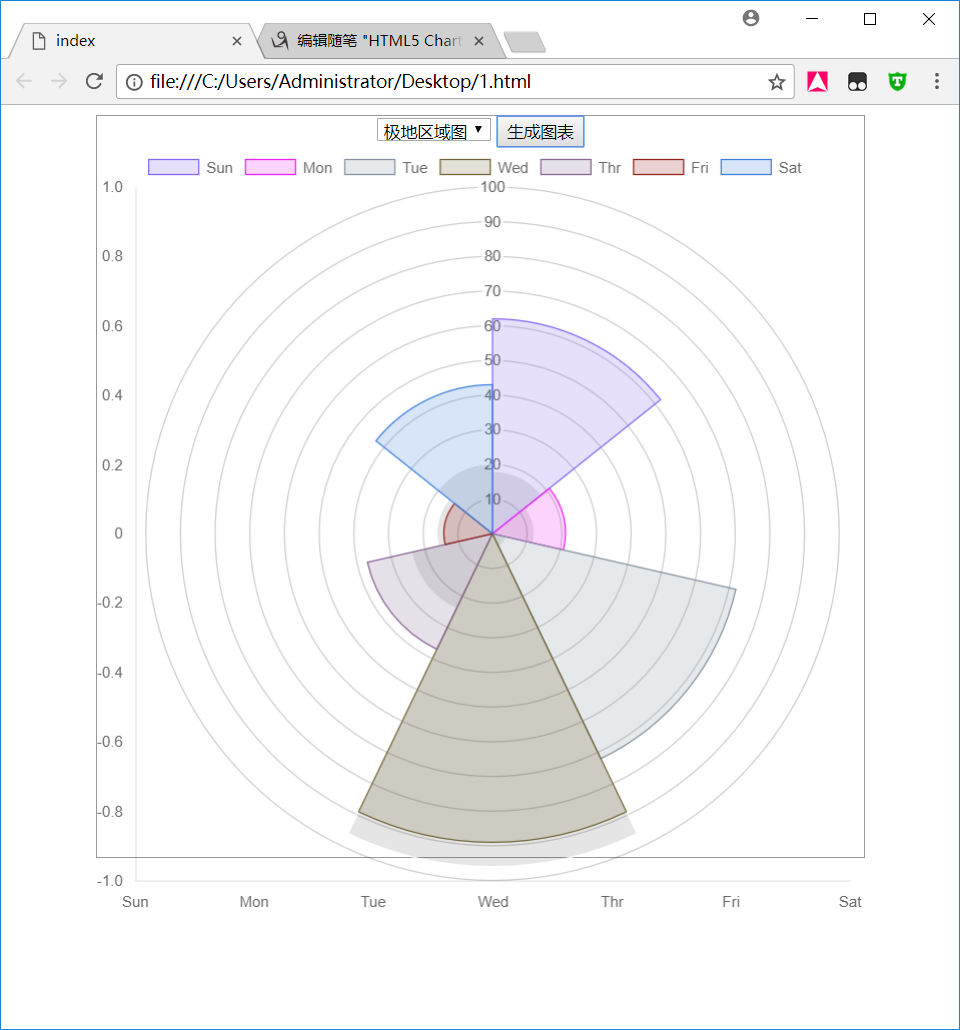
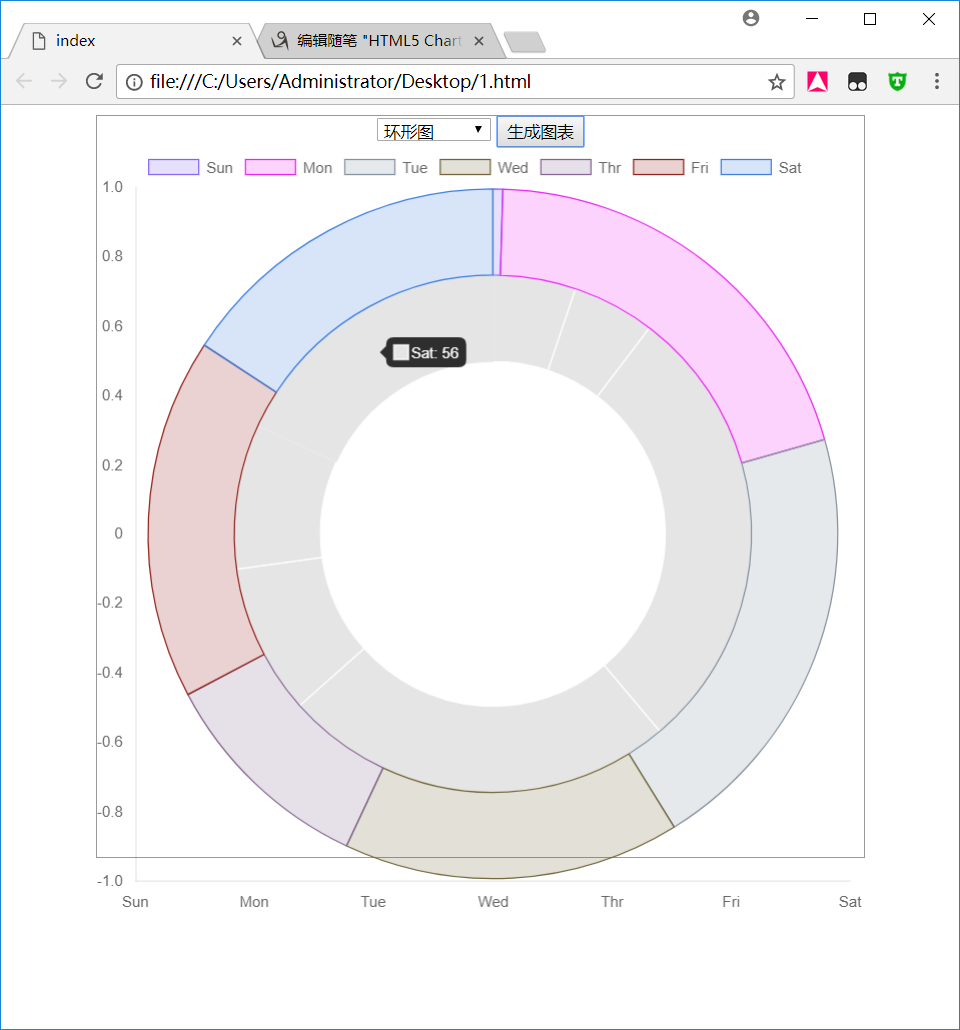
chart.js 环形图 doughnut
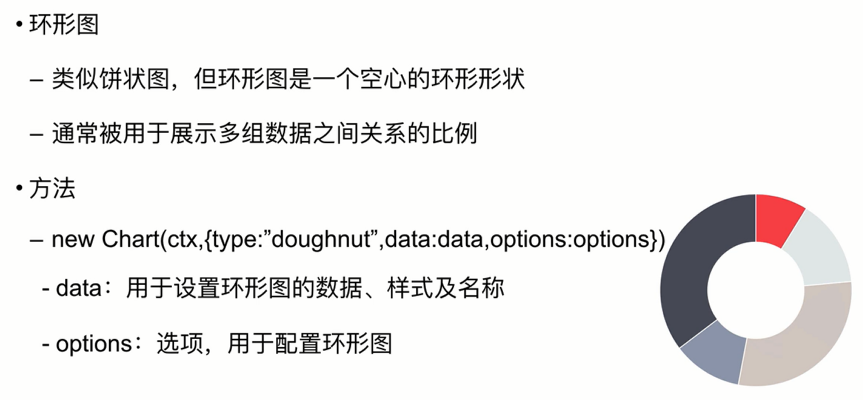
案例代码
<style>

  .chart-container{

    position: relative;

    border: 1px solid #999999;

    margin: auto;

    width: 80vw;

    height: 80vh;

    text-align: center;

  }

</style>

 <script src="mychat.js"></script>

<p class="chart-container">

  <select id="type" class="" name="type">

    <option value="line">曲线图</option>

    <option value="bar">柱状图</option>

    <option value="pie">饼图</option>

    <option value="radar">雷达图</option>

    <option value="polarArea">极地区域图</option>

    <option value="doughnut">环形图</option>

  </select>

  <button type="button" onclick="changetype()" >生成图表</button>

  <canvas id="myChart"></canvas>

</p>

<script type="text/javascript">

  var ctx = document.getElementById("myChart").getContext("2d");

  var  t = document.getElementById('type').value;

  var d={

    // X 轴显示的文本

    labels:["Sun","Mon","Tue","Wed","Thr","Fri","Sat"],

    datasets:[

      {

        label:"大蜥蜴",

        // 数据集

        data:[parseInt(Math.random()*100),parseInt(Math.random()*100),parseInt(Math.random()*100),parseInt(Math.random()*100),parseInt(Math.random()*100),parseInt(Math.random()*100),parseInt(Math.random()*100)],

        // 边框宽度

        borderWidth:1,

        backgroundColor:[

          'rgba(132,99,244,0.2)',

          'rgba(235,33,244,0.2)',

          'rgba(132,145,158,0.2)',

          'rgba(111,99,54,0.2)',

          'rgba(132,99,144,0.2)',

          'rgba(145,32,25,0.2)',

          'rgba(58,125,222,0.2)'

        ],

        borderColor:[

          'rgba(132,99,244,1)',

          'rgba(235,33,244,1)',

          'rgba(132,145,158,1)',

          'rgba(111,99,54,1)',

          'rgba(132,99,144,1)',

          'rgba(145,32,25,1)',

          'rgba(58,125,222,1)'

        ]

      },

      {

        label:"猪猪侠",

        data:[parseInt(Math.random()*100),parseInt(Math.random()*100),parseInt(Math.random()*100),parseInt(Math.random()*100),parseInt(Math.random()*100),parseInt(Math.random()*100),parseInt(Math.random()*100)],

        borderWidth:1

      }

    ]

  };

  var o ={

    maintainAspectRation:false, // 自动适配,自动根据父容器调整大小。

    scales:{  // 刻度

      yAxes:[

        {

          // ticks:{beginAtZero:true} // 刻度从零开始。

          gridLines:{

            display:false

          }  // 显示竖线。

        }

      ],

      xAxes:[

        {

          gridLines:{

            display:false

          }

        }

      ]

    }

  };

  function changetype() {

    t = document.getElementById('type').value;

    new Chart( ctx , { type: t , data: d , options: o } );

  }

</script>
结束,谢谢!
HTML5 Chart.js 框架的更多相关文章
- 超酷HTML5 Canvas图表应用Chart.js自定义提示折线图
超酷HTML5 Canvas图表应用Chart.js自定义提示折线图 效果预览 实例代码 <div class="htmleaf-container"> <div ...
- 让IE8支持HTML5及canvas功能!chart.js图表绘制工具库IE8上兼容方案
第一步,我们加上对html5的支持. <!--[if IE]> <script src="/public/html5.js" type="text/ja ...
- Chart.js | HTML5 Charts for your website.
Chart.js | HTML5 Charts for your website. Chart.js
- PhoneGap或者Cordova框架下实现Html5中JS调用Android原生代码
PhoneGap或者Cordova框架下实现Html5中JS调用Android原生代码 看看新闻网>看引擎>开源产品 0人收藏此文章, 发表于8小时前(2013-09-06 00:39) ...
- 基于html5 canvas 的强大图表插件【Chart.js】
名词解释 Chart.js:是基于html5和canvas的强大图表插件,支持多样的图表形式,柱状线性饼环极地雷达等等: canvas:只兼容到IE9 excanvas.js:强大的第三方兼容插件,可 ...
- Chart.js – 效果精美的 HTML5 Canvas 图表库
Chart.js 是一个令人印象深刻的 JavaScript 图表库,建立在 HTML5 Canvas 基础上.目前,它支持6种图表类型(折线图,条形图,雷达图,饼图,柱状图和极地区域区).而且,这是 ...
- 你需要了解的JS框架
excanvas.js/Chart.js/cubism.js/d3.js/dc.js/dx.chartjs.js/echarts.js/flot.js 用途:构建数据统计图表,兼容多浏览器 ...
- [转]Chart.js入门教程
Chart.js是一个简单.面向对象.为设计者和开发者准备的图表绘制工具库. 相信大部分人都一样,看到一大筐用文本或者表格形式呈现的数据就头疼.因为这种呈现方式也太无聊了吧...而且这对于我们处理原始 ...
- Chart.js入门教程
Chart.js是一个简单.面向对象.为设计者和开发者准备的图表绘制工具库. 相信大部分人都一样,看到一大筐用文本或者表格形式呈现的数据就头疼.因为这种呈现方式也太无聊了吧...而且这对于我们处理原始 ...
随机推荐
- opengl学习笔记(五):组合变换,绘制一个简单的太阳系
创建太阳系模型 描述的程序绘制一个简单的太阳系,其中有一颗行星和一颗太阳,用同一个函数绘制.需要使用glRotate*()函数让这颗行星绕太阳旋转,并且绕自身的轴旋转.还需要使用glTranslate ...
- Cocos2d比较好的博客
1 .http://blog.csdn.net/bill_man/article/details/7202458 学习笔记 2.http://cocos2d-x.org/ 官网 3.http://ww ...
- flask操作简章
https://blog.csdn.net/u011054333/article/details/70151857
- 完美解决onchange不能实时的监听
我们大家都知道onchange有时候很不好用,因为onchange事件是离开焦点后才会被触发,而不是实时去监听! 那么oninput()事件和onpropertychange()完美的解决了问题:(o ...
- sass,less的安装及sass的教程
装scss(window) 首相安装ruby http://www.sasschina.com/install/ scss转译css http://www.cnblogs.com/52css/arch ...
- sql server 存储机制
1.区段 区段(extent)是用来为表和索引分配空间的基本存储单元.它由8个连续的64KB数据页组成. 基于区段(而不是实际使用空间)分配空间的概念的要点: 一旦区段已满,那么下一记录将要占据的空间 ...
- 用Delphi写一个UTF8编码格式的文本文件
... var f: TextFile; begin AssignFile(f, 'test.txt'); Rewrite(f); write(f, #$EF+#$BB+#$BF); // UTF-8 ...
- mathType插入公式编号,及对公式编号的字体进行修改。调整公式上下间距。
一:插入 公式编号. 1:首先设置公式格式.点击 mathtype>insert number >format 2:有简单格式和 高级格式: https://we ...
- 实习培训——Java基础(2)
实习培训——Java基础(2) 1 Java 变量类型 在Java语言中,所有的变量在使用前必须声明.声明变量的基本格式如下: type identifier [ = value][, identi ...
- poj1753Flip Game(dfs)
Flip Game 思想很不成熟, #include <stdio.h>#include <string.h>#include <stdlib.h>int map ...