matplotlib绘图难题解决
# coding=utf-8
import pandas as pd
import yagmail
import requests
import arrow
import numpy as np
import matplotlib as mpl
from matplotlib.font_manager import _rebuild _rebuild() # reload一下
mpl.rcParams['font.sans-serif'] = ['SimHei']
mpl.rcParams['font.serif'] = ['SimHei'] now = arrow.now()
start_time = now.format("YYYY-MM-DD")
end_time = now.shift(days=7).format("YYYY-MM-DD")
filter = '''[{"cxxx"}]''' % (
start_time, end_time) brand_url = 'hxxx} headers = {xxx
} def get_brand_info(tar):
visible_flag = True
info = requests.post(brand_url, data=data, headers=headers)
df_data = info.json()['data']['records']
df = pd.DataFrame(df_data)
df_8 = df[df['ad_zone_id'] == 8]
df_105 = df[df['ad_zone_id'] == 105] df_8 = df_8[['ptdate', 'fill_rate']]
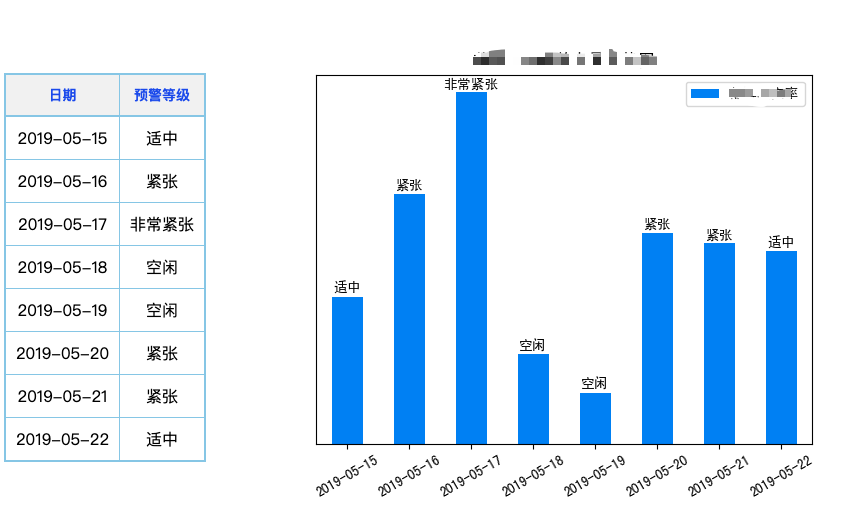
df_105 = df_105[['ptdate', 'fill_rate']] df_8['预xxx级'] = pd.cut(df_8['fill_rate'], bins=[0, 0.05, 0.10, 0.15, np.inf], labels=['空闲', '适中', '紧张', '非常紧张'])
df_105['预xxx级'] = pd.cut(df_105['fill_rate'], bins=[0, 0.05, 0.10, 0.15, np.inf], labels=['空闲', '适中', '紧张', '非常紧张']) df_8.rename(columns={'ptdate': '日期', 'fill_rate': '品xxxx率'}, inplace=True)
df_105.rename(columns={'ptdate': '日期', 'fill_rate': '品xxx率'}, inplace=True) if tar == 'inner':
ax_8 = df_8.plot('日期', '品xxxx率', kind='bar', title='首页未来xxxx图', rot=30,
color='#0f88eb')
vals_8 = ax_8.get_yticks()
ax_8.set_yticklabels(['{:,.2%}'.format(x) for x in vals_8])
ax_8.set_xticklabels(df_8['日期'].tolist())
for i, v in enumerate(df_8['品xxx率'].tolist()):
ax_8.text(i, v + 0.002, str(df_8['预xx级'].tolist()[i]), ha='center', fontweight='bold')
ax_8.yaxis.set_visible(visible_flag)
fig_8 = ax_8.get_figure()
fig_8.savefig('fig8_inner.png') ax_105 = df_105.plot('日期', '品牌填充率', kind='bar', title='回xxxx图', rot=30,
color='#0f88eb')
vals_105 = ax_105.get_yticks()
ax_105.set_yticklabels(['{:,.2%}'.format(x) for x in vals_105])
ax_105.set_xticklabels(df_105['日期'].tolist())
for index, value in enumerate(df_105['品xx率'].tolist()):
ax_105.text(index, value + 0.002, str(df_105['预xxx等级'].tolist()[index]), ha='center', fontweight='bold')
ax_105.yaxis.set_visible(visible_flag)
fig_105 = ax_105.get_figure()
fig_105.savefig('fig105_inner.png')
df_8['品xxxx充率'] = round(df_8['品xxxx率'] * 100, 2).apply(str) + '%'
df_105['xxxx率'] = round(df_105['品xxx率'] * 100, 2).apply(str) + '%' if tar == 'outter': visible_flag = False
ax_8 = df_8.plot('日期', '品xxxx充率', kind='bar', title='首xxxxx图', rot=30,
color='#0f88eb')
vals_8 = ax_8.get_yticks()
ax_8.set_yticklabels(['{:,.2%}'.format(x) for x in vals_8])
ax_8.set_xticklabels(df_8['日期'].tolist())
for i, v in enumerate(df_8['品xxxx率'].tolist()):
ax_8.text(i, v + 0.002, str(df_8['预xxx级'].tolist()[i]), ha='center', fontweight='bold')
ax_8.yaxis.set_visible(visible_flag)
fig_8 = ax_8.get_figure()
fig_8.savefig('fig8_outter.png') ax_105 = df_105.plot('日期', '品xxx率', kind='bar', title='回xxxx量走势图', rot=30,
color='#0f88eb')
vals_105 = ax_105.get_yticks()
ax_105.set_yticklabels(['{:,.2%}'.format(x) for x in vals_105])
ax_105.set_xticklabels(df_105['日期'].tolist())
for index, value in enumerate(df_105['品xxxx率'].tolist()):
ax_105.text(index, value + 0.002, str(df_105['xxx级'].tolist()[index]), ha='center', fontweight='bold')
ax_105.yaxis.set_visible(visible_flag)
fig_105 = ax_105.get_figure()
fig_105.savefig('fig105_outter.png')
df_8.drop('品xxxxx率', axis=1, inplace=True)
df_105.drop('品xxx率', axis=1, inplace=True) all_html_8 = df_8.to_html(escape=False, index=False).replace("\n", "")
all_html_105 = df_105.to_html(escape=False, index=False).replace("\n", "")
body = \
"""
<body>
<div align="center" class="header">
<!--标题部分的信息-->
<h1 align="center">您好,以下为xxxx占量情况!</h1>
</div>
<hr>
<div class="content">
<!--正文内容-->
<div>
<h4>近一xxxxxx量数据</h4>
{}
<div style="float:left;margin-left:30px;">
<img src='./fig8_{}.png' />
</div>
</div>
<br/>
<br/>
<div style="clear:both"></div>
<div>
<h4>近xxx据</h4>
{}
<div style="float:left;margin-left:30px;">
<img src='./fig105_{}.png' />
</div>
</div>
<div style="clear:both"></div>
<hr>
<p style="text-align: left">
—— 本次报告完 ——
</p>
</div>
</body>
""".format(all_html_8, tar,all_html_105,tar) head = \
'''
<head>
<meta charset="utf-8">
<STYLE TYPE="text/css" MEDIA=screen> table.dataframe {
border-collapse: collapse;
border: 2px solid #a19da2;
float:left;
margin-top:56px;
/*居中显示整个表格*/
/*margin: auto;*/
} table.dataframe thead {
border: 2px solid #91c6e1;
background: #f1f1f1;
padding: 10px 10px 10px 10px;
color: #333333;
} table.dataframe tbody {
border: 2px solid #91c6e1;
padding: 10px 10px 10px 10px;
} table.dataframe tr { } table.dataframe th {
vertical-align: top;
font-size: 14px;
padding: 10px 10px 10px 10px;
color: #105de3;
font-family: 微软雅黑;
text-align: center;
} table.dataframe td {
text-align: center;
padding: 10px 10px 10px 10px;
} body {
font-family: 微软雅黑;
} h1 {
color: blue;
} div.header h2 {
color: #0002e3;
font-family: 微软雅黑;
} h3 {
font-size: 22px;
background-color: rgba(0, 2, 227, 0.71);
text-shadow: 2px 2px 1px #de4040;
color: rgba(239, 241, 234, 0.99);
line-height: 1.5;
} h4 {
color: blue;
font-family: 微软雅黑;
font-size: 20px;
text-align: left;
} </STYLE>
</head>
''' foot = \
'''
<br/>
<p>
<br/>
</p>
'''
html_msg = "<html>" + head + body + foot + "</html>"
html_msg = html_msg.replace("\n", "")
with open('./' + tar + '.html', 'w', encoding='UTF-8', newline='') as fout:
fout.write(html_msg)
print(df_8.head())
print(df_105.head()) def send_week_mail(tar):
yag = yagmail.SMTP(user="xxxx@zhihu.com", password="cxxxx", host='smtp.xxxx.com')
print('正在准xxxx...')
if tar == 'inner':
# 链接邮箱服务器
# zhihu_staff = [xxx]
yag.send(to=zhihu_staff, subject='未来xxxx页占量',
contents=open('./' + tar + '.html', 'r', encoding='UTF-8', newline='').read())
print('内部xxxx发送!')
else:
# agent_staff = ['cxxx']
agent_staff = ['zxxxx']
yag.send(to=agent_staff, subject='未来xxxxx页占量',
contents=open('./' + tar + '.html', 'r', encoding='UTF-8', newline='').read())
print('外部每日xxxx发送!') def main():
target = ['inner', 'outter']
for tar in target:
get_brand_info(tar)
send_week_mail(tar) if __name__ == '__main__':
main()
matplotlib绘图难题解决的更多相关文章
- matplotlib 绘图
http://blog.csdn.net/jkhere/article/details/9324823 都打一遍 5 matplotlib-绘制精美的图表 matplotlib 是python最著名的 ...
- ssh调用matplotlib绘图报错RuntimeError: Invalid DISPLAY variable
1.问题:在本地用matplotlib绘图可以,但是在ssh远程绘图的时候会报错 RuntimeError: Invalid DISPLAY variable 2.原因:matplotlib的默认ba ...
- python实战学习之matplotlib绘图续
学习完matplotlib绘图可以设置的属性,还需要学习一下除了折线图以外其他类型的图如直方图,条形图,散点图等,matplotlib还支持更多的图,具体细节可以参考官方文档:https://matp ...
- matplotlib绘图的基本操作
转自:Laumians博客园 更简明易懂看Matplotlib Python 画图教程 (莫烦Python)_演讲•公开课_科技_bilibili_哔哩哔哩 https://www.bilibili. ...
- python中利用matplotlib绘图可视化知识归纳
python中利用matplotlib绘图可视化知识归纳: (1)matplotlib图标正常显示中文 import matplotlib.pyplot as plt plt.rcParams['fo ...
- matplotlib绘图基本用法-转自(http://blog.csdn.net/mao19931004/article/details/51915016)
本文转载自http://blog.csdn.net/mao19931004/article/details/51915016 <!DOCTYPE html PUBLIC "-//W3C ...
- python实战学习之matplotlib绘图
matplotlib 是最流行的Python底层绘图库,主要做数据可视化图表 可以将数据可视化,能够更直观的呈现数据 matplotlib绘图基本要点 首先实现一个简单的绘图 # 导入pyplot f ...
- 【原】在Matplotlib绘图中添加Latex风格公式
Matplotlib绘图的过程中,可以为各个轴的Label,图像的Title.Legend等元素添加Latex风格的公式. 只需要在Latex公式的文本前后各增加一个$符号,Matplotlib就可以 ...
- Matplotlib绘图双纵坐标轴设置及控制设置时间格式
双y轴坐标轴图 今天利用matplotlib绘图,想要完成一个双坐标格式的图. fig=plt.figure(figsize=(20,15)) ax1=fig.add_subplot(111) ax1 ...
随机推荐
- sublime text 文件列表如何忽略特定格式的文件名
1.只需要Preferences (中文首选项)里面找到setting-default(设置默认) 2.在设置面板里面找到 "folder_exclude_patterns" ...
- Spring Boot JDBC:加载DataSource过程的源码分析及yml中DataSource的配置
装载至:https://www.cnblogs.com/storml/p/8611388.html Spring Boot实现了自动加载DataSource及相关配置.当然,使用时加上@EnableA ...
- LODOP打印图片水平居中
其他居中,查看本博客相关博文:LODOP中打印项水平居中简短问答.图片也属于超文本打印项,因此如果想把图片居中,也需要图片本身内容相对于图片打印项宽度居中,然后再设置打印项居中.如图,同一张图片,都设 ...
- Python删除文件,空文件夹,非空文件夹
首先,在Python中文件路径是这种格式: file_path1 = r'F:\test\1' 删除文件,命令 os.remove(file_path1) 删除空文件夹,命令 os.rmdir(fil ...
- linux减少服务器带宽的方法
linux减少服务器带宽的方法用百度静态资源公共库http://cdn.code.baidu.com/ 不仅可以不使用服务器流量 而且还有cdn加速比方说http://apps.bdimg.com/l ...
- 自定义注解实现简单的orm映射框架
package com.mj; import javax.xml.bind.Element; import java.lang.annotation.*; import java.lang.refle ...
- fineui 模拟右下角弹窗
<!DOCTYPE html> <html xmlns="http://www.w3.org/1999/xhtml"> <head runat=&qu ...
- SQL Server 中日志的的作用(Redo和Undo)
简介 之前我已经写了一个关于SQL Server日志的简单系列文章.本篇文章会进一步挖掘日志背后的一些概念,原理以及作用. 数据库的可靠性 在关系数据库系统中,我们需要数据库可靠,所谓的可靠就是当遇见 ...
- Java学习之旅(二):生病的狗1(逻辑推导)
前言:本篇文章属于个人笔记,例化了一些代码,不知是否合理,请指教. 中午看到一位同学的面试题,觉得很烧脑,烧脑不能一个人烧,要大家一起烧. 村子中有50个人,每人有一条狗.在这50条狗中有病狗(这种病 ...
- 长乐国庆集训Day3
T1 动态逆序对 题目 [题目描述] 给出一个长度为n的排列a(1~n这n个数在数列中各出现1次).每次交换两个数,求逆序对数%2的结果. 逆序对:对于两个数a[i],a[j](i<j),若a[ ...