Prometheus学习笔记(2)Prometheus部署
Prometheus的安装配置启动
1、Prometheus二进制安装
Prometheus下载链接:https://prometheus.io/download/
Prometheus本身的存储是通过时间序列化存储的,所以对时间是很有要求的,系统时间需要通过ntp进行同步,避免因为时间造成数据无法显示。
# 时间同步

[root@prometheus ~]# ntpdate ntp1.aliyun.com

[root@prometheus ~]# crontab -e

*/5 * * * * ntpdate ntp1.aliyun.com &> /dev/null

# 下载

[root@prometheus ~]# wget https://github.com/prometheus/prometheus/releases/download/v2.14.0/prometheus-2.14.0.linux-amd64.tar.gz

# 解压

[root@prometheus ~]# tar -zxf prometheus-2.14.0.linux-amd64.tar.gz -C /usr/local

[root@prometheus ~]# mv /usr/local/prometheus-2.14.0.linux-amd64 /usr/local/prometheus-2.14.0

[root@prometheus ~]# ln -sv /usr/local/prometheus-2.14.0 /usr/local/prometheus

# 配置自我监控

[root@prometheus ~]# cd /usr/local/prometheus

[root@prometheus ~]# vim prometheus.yaml

global:

  scrape_interval:     15s # 全局配置,默认15s收集一次数据.

  # 配置外部标签

  external_labels:

    monitor: 'codelab-monitor'

# 监控配置

scrape_configs:

  # 监控任务名称,KV形式.

  - job_name: 'prometheus'

    # 覆盖前面的全局配置,以5s收集一次数据.

    scrape_interval: 5s

    # 目标监控主机和收集数据的端口

    static_configs:

      - targets: ['localhost:9090']

# 启动

[root@prometheus prometheus]# ./prometheus &

[root@prometheus prometheus]# netstat -tulnp |grep 9090

[root@prometheus prometheus]# netstat -tulnp |grep 9090

tcp6       0      0 :::9090                 :::*                    LISTEN      21407/./prometheus
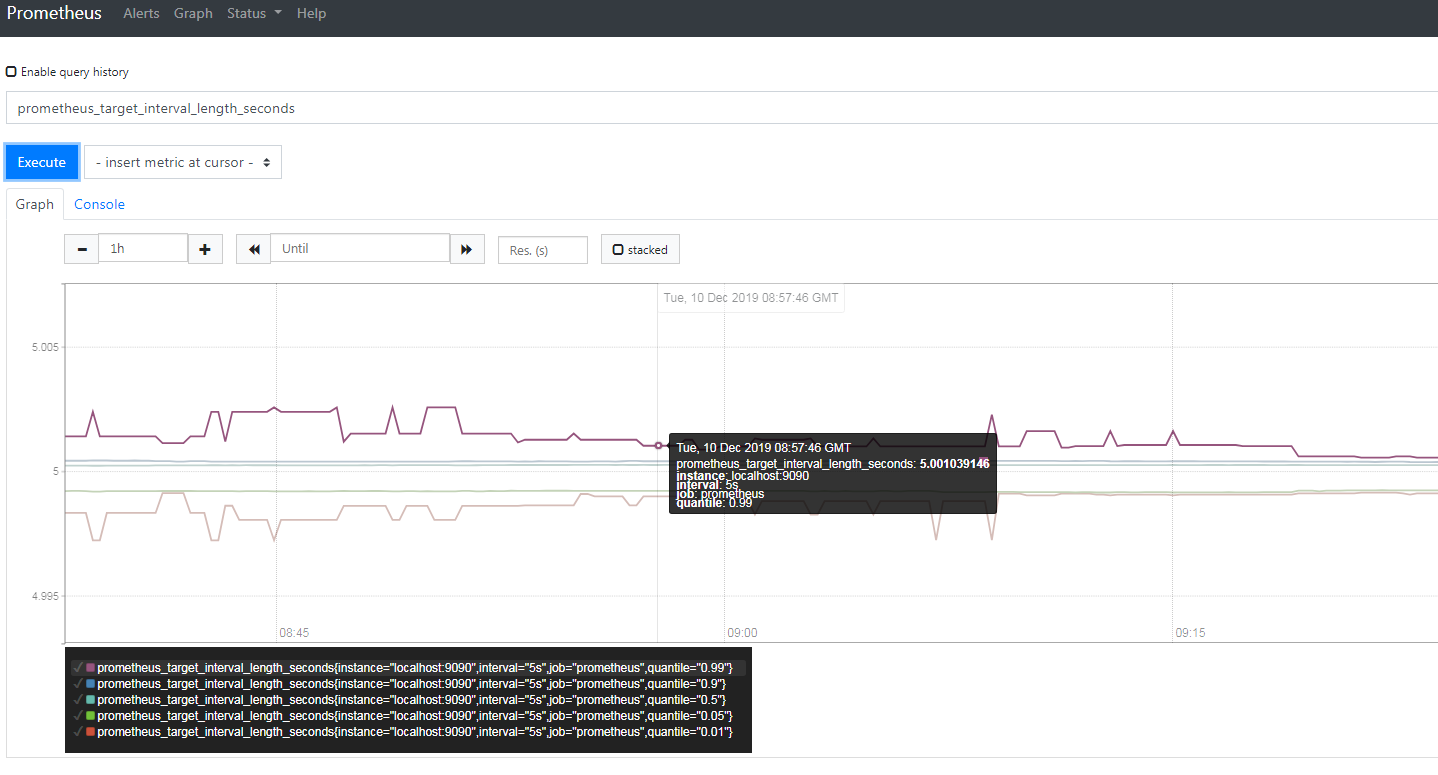
上面可以看到监听了9090端口,即可通过localhost:9090/metrics来获取指标数据,也可以通过浏览器直接访问localhost:9090通过web界面来查看数据。
Prometheus的安装还是比较简单的,但是由于Prometheus没有使用systemd来进行管理,用./的方式启动并不方便,这里虽然使用&、nohup的挂起方式也不尽完美,那么这里再来2种守护进程方式运行prometheus。如下:
- (1)安装screen工具,将prometheus放入后台运行
[root@prometheus prometheus]# yum install screen -y

[root@prometheus prometheus]# screen

[root@prometheus prometheus]# ./prometheus

#按Ctrl+a+d后进入后台运行模式

[root@prometheus prometheus]# screen -ls

There is a screen on:

	28915.pts-0.prometheus	(Detached)

1 Socket in /var/run/screen/S-root.

[root@prometheus prometheus]# ps -ef |grep prometheus

root     28927 28916  6 15:07 pts/2    00:00:01 ./prometheus
- (2)使用systemd进行管理
[root@prometheus ~]# vim /usr/lib/systemd/system/prometheus.service

[Unit]

Description=prometheus

Documentation=https://prometheus.io/docs/introduction/overview

After=network-online.target remote-fs.target nss-lookup.target

Wants=network-online.target

[Service]

Type=simple

PIDFile==/var/run/prometheus.pid

ExecStart=/usr/local/prometheus/prometheus --config.file=/usr/local/prometheus/prometheus.yml --web.read-timeout=5m --web.max-connections=512 --storage.tsdb.retention=15d --storage.tsdb.path="data/" --query.max-concurrency=20 --query.timeout=2m

ExecReload=/bin/kill -s HUP $MAINPID

ExecStop=/bin/kill -s TERM $MAINPID

[Install]

WantedBy=multi-user.target

[root@prometheus ~]# systemctl daemon-reload

[root@prometheus ~]# systemctl start prometheus

[root@prometheus ~]# ps -ef |grep prometheus

root     29688     1  1 16:31 ?        00:00:00 /usr/local/prometheus/prometheus --config.file=/usr/local/prometheus/prometheus.yml --web.read-timeout=5m --web.max-connections=512 --storage.tsdb.retention=15d --storage.tsdb.path="data/" --query.max-concurrency=20 --query.timeout=2m

[root@prometheus ~]# netstat -tulnp |grep 9090

tcp6       0      0 :::9090                 :::*                    LISTEN      29707/prometheus
这里需要了解的几个启动优化的参数:
--config.file:指定prometheus的配置文件路径
--web.read-timeout:请求链接的最大等待时间,为了防止过多查询链接请求或太多的空闲链接占用资源
--web.max-connections:最大连接数设置
--storage.tsdb.retention:prometheus采集数据后会保存在内存和硬盘当中,设定保留数据的时长,避免高消耗
--storage.tsdb.path:指定采集监控数据保存的磁盘路径
--query.max-concurrency --query.timeout:这两个参数是用于在用户执行查询时,防止太多用户同时查询,也防止用户执行过大的查询而不退出,导致资源过载。
2、Prometheus容器化安装
直接使用官方的镜像启动,并映射prometheus.yml配置文件到本地进行管理
[root@prometheus ~]# docker run -p 9090:9090 -v /tmp/prometheus.yml:/etc/prometheus/prometheus.yml prom/prometheus
还有另外一种方式是通过自定义镜像方式启动Prometheus
[root@prometheus ~]# vim dockerfile

FROM prom/prometheus

ADD prometheus.yml /etc/prometheus/

[root@prometheus ~]# docker build -t my-prometheus .

[root@prometheus ~]# docker run -p 9090:9090 my-prometheus
Prometheus学习笔记(2)Prometheus部署的更多相关文章
- ActionBarSherlock学习笔记 第一篇——部署
ActionBarSherlock学习笔记 第一篇--部署 ActionBarSherlock是JakeWharton编写的一个开源框架,使用这个框架,可以实现在所有的Android ...
- OGG学习笔记04-OGG复制部署快速参考
OGG学习笔记04-OGG复制部署快速参考 源端:Oracle 10.2.0.5 RAC + ASM 节点1 Public IP地址:192.168.1.27 目标端:Oracle 10.2.0.5 ...
- Prometheus监控学习笔记之Prometheus的Relabel,SD以及Federation功能
0x00 k8s 的监控设计 k8s 默认以及推荐的监控体系是它自己的一套东西:Heapster + cAdvisor + Influxdb + Grafana,具体可以看 这里 . 包括 k8s 自 ...
- Prometheus监控学习笔记之prometheus的federation机制
0x00 概述 有时候对于一个公司,k8s集群或是所谓的caas只是整个技术体系的一部分,往往这个时候监控系统不仅仅要k8s集群以及k8s中部署的应用,而且要监控传统部署的项目.也就是说整个监控系统不 ...
- Prometheus监控学习笔记之Prometheus存储
0x00 概述 Prometheus之于kubernetes(监控领域),如kubernetes之于容器编排.随着heapster不再开发和维护以及influxdb 集群方案不再开源,heapster ...
- Prometheus监控学习笔记之Prometheus普罗米修斯监控入门
0x00 概述 视频讲解通过链接网易云课堂·IT技术快速入门学院进入,更多关于Prometheus的文章. Prometheus是最近几年开始流行的一个新兴监控告警工具,特别是kubernetes的流 ...
- Prometheus监控学习笔记之Prometheus监控简介
0x00 Prometheus容器监控解决方案 Prometheus(普罗米修斯)是一个开源系统监控和警报工具,最初是在SoundCloud建立的.它是一个独立的开放源码项目,并且独立于任何公司.不同 ...
- Prometheus学习笔记(6)Alertmanager告警
目录 一.Alertmanager简介 二.Alertmanager部署 三.Alertmanager配置 四.自定义告警规则和发送 五.自定义告警模板 一.Alertmanager简介 Promet ...
- Prometheus监控学习笔记之Prometheus从1.x升级到2.x
详细参考这篇文章 https://cloud.tencent.com/developer/article/1171434 prometheus 2.0于2017-11-08发布,主要是存储引擎进行了优 ...
随机推荐
- ESA2GJK1DH1K升级篇: STM32远程乒乓升级,基于(GPRS模块AT指令TCP透传方式),定时访问升级(兼容Air202,SIM800)
实现功能概要 单片机定时使用http访问云端的程序版本, 如果版本不一致,然后通过http下载最新的升级文件,实现远程升级STM32. 兼容Air202,SIM800 测试准备工作(默认访问我的服务器 ...
- Debian9下安装Python3 pip
Debian9下安装Python3 pip 使用apt-get安装Python3-pip包 apt-get install python3-pip
- 浅谈C/C++回调函数(Callback)& 函数指针
摘要:回调函数就是一个通过函数指针调用的函数.如果你把函数的指针(地址)作为参数传递给另一个函数,当这个指针被用来调用其所指向的函数时,我们就说这是回调函数.回调函数不是由该函数的实现方直接调用,而是 ...
- 未能加载文件或程序集“***”或它的某一个依赖项,拒绝访问 <解决方法>
报错信息如下: 注:为了部分隐私安全需要,已将有问题文件名替换为filename,系统win2008R2,Microsoft .NET Framework 版本:4.0.30319; ASP.NET ...
- JAVA锁的膨胀过程和优化(阿里)
阿里的人问什么是锁膨胀,答不上来,回来做了总结: 关于锁的膨胀,synchronized的原理参考:深入分析Synchronized原理(阿里面试题) 首先说一下锁的优化策略. 1,自旋锁 自旋锁其实 ...
- 【Gamma】事后分析
目录 [Gamma]事后分析 设想和目标 计划 资源 变更管理 设计/实现 测试/发布 团队的角色,管理,合作 总结 照片 [Gamma]事后分析 设想和目标 我们的软件要解决什么问题?是否定义得很清 ...
- ASP.NET Core WebApi基于JWT实现接口授权验证
一.ASP.Net Core WebApi JWT课程前言 我们知道,http协议本身是一种无状态的协议,而这就意味着如果用户向我们的应用提供了用户名和密码来进行用户认证,那么下一次请求时,用户还要再 ...
- Csp-s2019 划分
本题主要靠结论 12pt 爆搜 时间复杂度\(O(n^n)\) 36pt \(f_{i,j}表示前i个数由状态j转移过来,a_i表示前缀和\) \(So,f_{i,j}=f_{j,k}+(a_i-a_ ...
- Java8 新特性 Lamdba表达式
Lamdba 表达式为什么出现 Java8是自java延生以来最大的改变,他允许java中的方法和函数成为一等公民(可以在方法间传递),所以就应运而出现了Lamdba表达式,他可以将表达式传递给另 ...
- Python3+WebSockets实现WebSocket通信
一.说明 1.1 背景说明 前段时间同事说云平台通信使用了个websocket的东西,今天抽空来看一下具体是怎么个通信过程. 从形式上看,websocket是一个应用层协议,socket是数据链路层. ...