从容器里dump java堆实验探索(原创)
目标:从docker容器里dump java堆
模拟程序
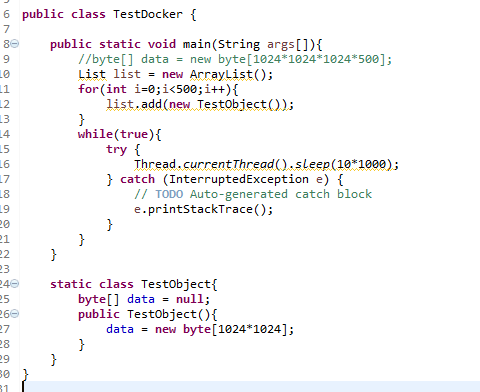
占用空间500M,
设置启动JVM参数

docker启动命令

(PS:经过测试,至少要650M才能启动容器)
方式1: 通过docker exec
先通过 docker exec $containerid ps x 获取进程号
执行 docker exec

此命令实际就是进入docker容器里执行/jdk/bin/jmap dump ,导出的文件也是存放在容器里
经过多次实验,基本上每次都触发容器killed
方式2,: 通过nsenter
参考文章 https://github.com/jpetazzo/nsenter
这里有句重点是”evades resource limitations” ,躲避资源限制
我们使用nsenter试验一下
使用docker-enter (docker-enter脚本 调用了nsenter)

多次测试,都没有发生docker killed现象
结论: 通过nsenter 方式去 dump java 堆,能比较高成功率, 但仅限于此实验场景,不代表其他线上场景一定能成功
PS: jdk10 新特性里虽然增加了更好的docker支持,但没有提及过jmap 有更好的dump方式
https://bugs.openjdk.java.net/browse/JDK-8146115
To correct these shortcomings and make this support more robust, here's a list of the current cgroup subsystems that we be examined in order to update the internal VM and core library configuration.
Number of CPUs
-----------------------
Use a combination of number_of_cpus() and
cpu_sets() in order to determine how many processors are available to the
process and adjust the JVMs os::active_processor_count appropriately. The
number_of_cpus() will be calculated based on the cpu_quota() and cpu_period()
using this formula: number_of_cpus() = cpu_quota() / cpu_period(). If
cpu_shares has been setup for the container, the number_of_cpus() will be
calculated based on cpu_shares()/1024. 1024 is the default and standard unit
for calculating relative cpu usage in cloud based container management
software.
Also add a new VM flag
(-XX:ActiveProcessorCount=xx) that allows the number of CPUs to be overridden.
This flag will be honored even if UseContainerSupport is not enabled.
Total available memory
-------------------------------
Use the memory_limit() value from the cgroup
file system to initialize the os::physical_memory() value in the VM. This value
will propagate to all other parts of the Java runtime.
Memory usage
--------------------
Use memory_usage_in_bytes() for providing
os::available_memory() by subtracting the usage from the total available memory
allocated to the container.
As as troubleshooting aid, we will dump any
available container statistics to the hotspot error log and add container
specific information to the JVM logging system. Unified Logging will be added
to help to diagnose issue related to this support. Use -Xlog:os+container=trace
for maximum logging of container information.
A new option -XX:-UseContainerSupport will be
added to allow the container support to be disabled. The default for this flag
will be true. Container support will be enabled by default.
PS: jmap –F 那点事
When run without -F these
tools use Dynamic Attach Mechanism. This
works as follows.
- Before connecting to Java process 1234,
jmapcreates
a file.attach_pid1234at the working directory of the target process or
at/tmp. - Then
jmapsendsSIGQUITto the target process. When JVM catches the signal
and finds.attach_pid1234, it startsAttachListenerthread. AttachListenerthread creates UNIX domain socket/tmp/.java_pid1234to listen to commands from external tools.- For security reasons when a connection (from
jmap) is
accepted, JVM verifies that credentials of the socket peer are equal toeuidandegidof
JVM process. That's whyjmapwill not work if run by different user (even by
root). jmapconnects
to the socket, and sendsdumpheapcommand.- This command is read and executed by
AttachListenerthread of the JVM. All output is sent back to the
socket. Since the heap dump is made in-process directly by JVM, the operation
is really fast. However, JVM can do this only at safepoints. If a safepoint cannot be reached (e.g. the
process is hung, not responding, or a long GC is in progress),jmapwill
timeout and fail.
Let's
summarize the benefits and the drawbacks of Dynamic Attach.
Pros.
- Heap
dump and other operations are run collaboratively by JVM at the maximum speed. - You can
use any version ofjmaporjstackto connect to any other version of JVM.
Cons.
- The
tool should be run by the same user (euid/egid) as the target JVM. - Can be
used only on live and healthy JVM. - Will
not work if the target JVM is started with-XX:+DisableAttachMechanism.
jmap -F / jstack -F
When run with -F the
tools switch to special mode that features HotSpot Serviceability Agent. In
this mode the target process is frozen; the tools read its memory via OS
debugging facilities, namely, ptrace on
Linux.
jmap -FinvokesPTRACE_ATTACHon the target JVM. The target process is
unconditionally suspended in response toSIGSTOPsignal.- The tool reads JVM memory using
PTRACE_PEEKDATA.ptracecan read only one word at a time, so too many calls
required to read the large heap of the target process. This is very and very
slow. - The tool reconstructs JVM internal structures based on the
knowledge of the particular JVM version. Since different versions of JVM have
different memory layout,-Fmode works only ifjmapcomes
from the same JDK as the target Java process. - The tool creates heap dump itself and then resumes the
target process.
Pros.
- No
cooperation from target JVM is required. Can be used even on a hung process. ptraceworks whenever OS-level privileges are enough.
E.g.rootcan dump processes of all other users.
Cons.
- Very
slow for large heaps. - The
tool and the target process should be from the same version of JDK.
The safepoint is not guaranteed when the tool attaches in forced mode.
Though jmap tries to handle
all special cases, sometimes it may happen that target JVM is not in a
consistent state.
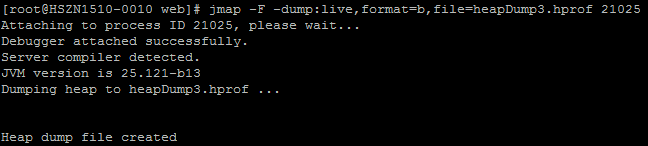
方式3: 直接在宿主机执行jmap
首先要先获取到容器里映射到宿主极的进程号

21025就是映射到宿主机的进程id
调用jmap –F 21025 ,但是失败了
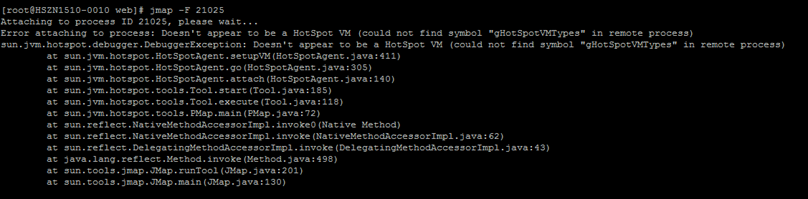
没有任何头绪之际,突然发现
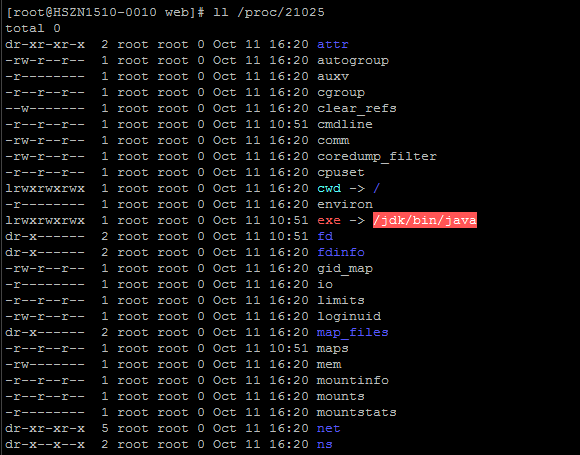
exe -> /jdk/bin/java 是红色, 这是容器里的java路径, 但宿主机没有这个路径, 会不会是这里有影响, 赶紧在宿主机也创建这个路径
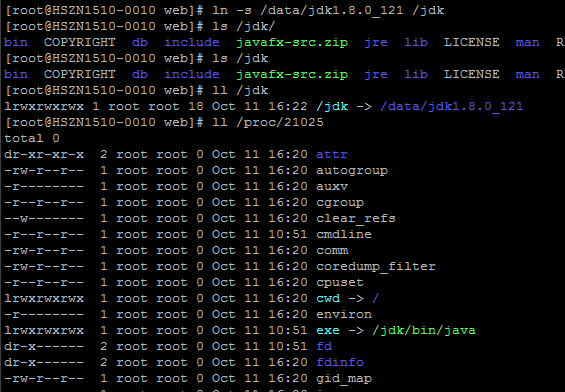
再次执行jmap, 成功导出
从容器里dump java堆实验探索(原创)的更多相关文章
- 容器中的Java堆大小调整:快速,轻松
在上一篇博客中,我们已经看到Java进行了改进,可以根据正在运行的环境(即物理机或容器(码头工人))识别内存.java的最初问题是,它无法弄清楚它是否在容器中运行,并且它曾经为容器运行所在的整个硬件捕 ...
- 如何规避容器内做Java堆dump导致容器崩溃的问题
写在前边 最近公司生产环境的容器云上出了个性能问题,为了做性能分析,使用 JDK 自带的 jmap 收集堆dump,出现了内存溢出导致了容器崩溃. 本篇文章将带你探究,如何规避容器内做堆 dump 导 ...
- 在 Docker 里跑 Java,你必须知道的那些事儿!(转)
原文 https://www.jianshu.com/p/0897d0581872 背景:众所周知,当我们执行没有任何调优参数(如“java-jar mypplication-fat.jar”)的 J ...
- Java内存泄漏分析系列之六:JVM Heap Dump(堆转储文件)的生成和MAT的使用
原文地址:http://www.javatang.com JVM Heap Dump(堆转储文件)的生成 正如Thread Dump文件记录了当时JVM中线程运行的情况一样,Heap Dump记录了J ...
- 从Java进程里dump出类的字节码文件
想要查看一些被增强过的类的字节码,或者一些AOP框架的生成类,就需要dump出运行时的Java进程里的字节码. 从运行的java进程里dump出运行中的类的class文件的方法: 用agent att ...
- MAT工具定位分析Java堆内存泄漏问题方法
一.MAT概述与安装 MAT,全称Memory Analysis Tools,是一款分析Java堆内存的工具,可以快速定位到堆内泄漏问题.该工具提供了两种使用方式,一种是插件版,可以安装到Eclips ...
- 如何在宿主机上执行容器里的jmap,jtack,jstat 命令获取信息(原创)
一般情况下,我们要获取docker容器里的jvm信息只能进入容器后执行jmap,jstack,jstat 命令去获取,jstack,jstat还好,但是jmap dump的文件要拿出来,得先copy ...
- Java堆内存设置
转自:https://blog.csdn.net/Qiuzhongweiwei/article/details/81023645 堆内存设置 原理 JVM堆内存分为2块:永久空间和堆空间. 永久即持久 ...
- Java堆内存又溢出了!教你一招必杀技
JAVA堆内存管理是影响性能主要因素之一.堆内存溢出是JAVA项目非常常见的故障,在解决该问题之前,必须先了解下JAVA堆内存是怎么工作的. 先看下JAVA堆内存是如何划分的,如图: JVM内存划分为 ...
随机推荐
- Excel 常用属性的一小部分
1.由于工作需要,最近积累了一些Excel中的相关知识,特此记录 Workbooks xlbooks = xlApp.Workbooks; Workbook xlbook = xlbooks.Add( ...
- Gnome osc,资源,,,,,因为官网难下
链接:https://share.weiyun.com/5XPLvJz 密码:pygpci
- Adjacency matrix based Graph
Interface AddVertex(T data) AddEdge(int from, int to) DFS BFS MST TopSort PrintGraph using System; u ...
- java变量的自动提升与强制转换
所有的byte型.short型和char的值将被提升到int型 一个字节可以提升为4个字节 4个字节不可以降为一个字节 强制转换4个字节转换为一个字节 [丢失精度] byte b = 3; b = ( ...
- NewSQL和TiDB入门
TiDB已经在项目中使用,从了解来看,它主要解决的是分布式事务的问题,而我们实际使用场景,却是大数据量下不需要关注分表: 最近实在忙加懒,一直没时间看TiDB的原理.今天看了下PingCAP3篇入门介 ...
- SpringBoot实现跨域
一.什么是跨域请求? 跨域请求,就是说浏览器在执行脚本文件的ajax请求时,脚本文件所在的服务地址和请求的服务地址不一样.说白了就是ip.网络协议.端口都一样的时候,就是同一个域,否则就是跨域.这是由 ...
- USB接口禁用与启用
前几天闺蜜淘了一台小本,但是发现计算机USB接口是禁用的,有点头疼,所以问了万能的度娘,找到了n种办法.不过这一种是适用于我的情况,简单记录一下. 解决方法:(主要就是修改注册表) 1.打开注册表编辑 ...
- 12集合(2)-----Set
一.总体分类 Collection(包括方法add,remove,contains,clear,size) List(接口) LinkedList ArrayList Vector---Stack 2 ...
- SpringBoot 部署到linux环境
第一部分:Springboot项目部署 说明:工具使用的是IEDA 第一:项目打包 1.在pom文件中添加插件 <build> <plugins> <plugin> ...
- 我的代码-normalize
# coding: utf-8 # In[13]: import pandas as pdimport numpy as npimport scipy as spfrom os import list ...