JavaScript手绘风格的图形库RoughJS使用指南
RoughJS是一个轻量级的JavaScript图形库(压缩后约9KB),可以让你在网页上绘制素描风格、手绘样式般的图形。RoughJS定义了绘制直线,曲线,圆弧,多边形,圆和椭圆的图元,同时它还支持绘制SVG路径。
这里是它的项目网站地址:https://roughjs.com/
RoughJS可以同时在Canvas和SVG上工作,这是一个非常实用的特性。

安装
最新的RoughJS库可以在Github中下载。
或者从npm下载:
npm install --save roughjs
使用
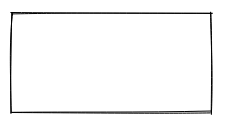
const rc = rough.canvas(document.getElementById('canvas'));

rc.rectangle(10, 10, 200, 200); // x, y, width, height
或者使用SVG
const rc = rough.svg(svg);

let node = rc.rectangle(10, 10, 200, 200); // x, y, width, height

svg.appendChild(node);
绘制线和椭圆
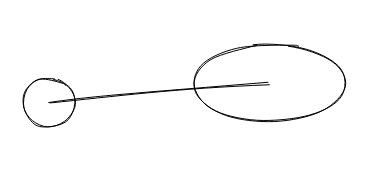
rc.circle(80, 120, 50); // centerX, centerY, diameter

rc.ellipse(300, 100, 150, 80); // centerX, centerY, width, height

rc.line(80, 120, 300, 100); // x1, y1, x2, y2
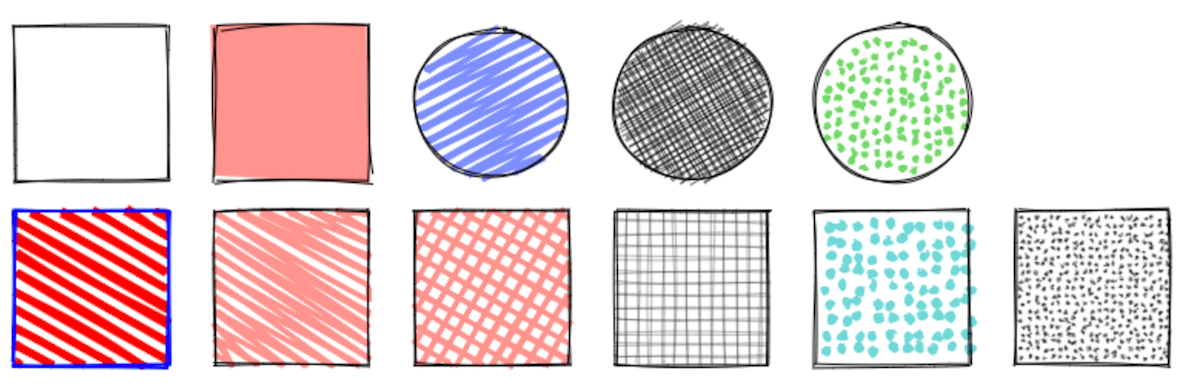
填充
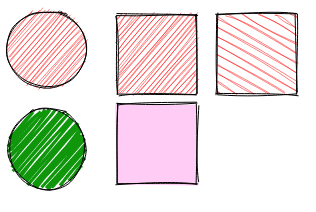
rc.circle(50, 50, 80, { fill: 'red' }); // fill with red hachure

rc.rectangle(120, 15, 80, 80, { fill: 'red' });

rc.circle(50, 150, 80, {

  fill: "rgb(10,150,10)",

  fillWeight: 3 // thicker lines for hachure

});

rc.rectangle(220, 15, 80, 80, {

  fill: 'red',

  hachureAngle: 60, // angle of hachure,

  hachureGap: 8

});

rc.rectangle(120, 105, 80, 80, {

  fill: 'rgba(255,0,200,0.2)',

  fillStyle: 'solid' // solid fill

});
填充样式可以是:晕滃线(默认),实体,锯齿形,交叉影线或点。
素描风格
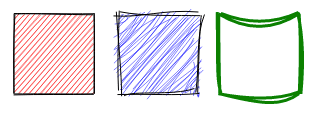
rc.rectangle(15, 15, 80, 80, { roughness: 0.5, fill: 'red' });

rc.rectangle(120, 15, 80, 80, { roughness: 2.8, fill: 'blue' });

rc.rectangle(220, 15, 80, 80, { bowing: 6, stroke: 'green', strokeWidth: 3 });
SVG路径
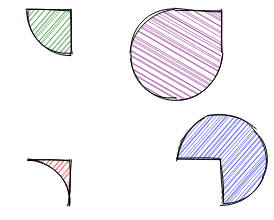
rc.path('M80 80 A 45 45, 0, 0, 0, 125 125 L 125 80 Z', { fill: 'green' });

rc.path('M230 80 A 45 45, 0, 1, 0, 275 125 L 275 80 Z', { fill: 'purple' });

rc.path('M80 230 A 45 45, 0, 0, 1, 125 275 L 125 230 Z', { fill: 'red' });

rc.path('M230 230 A 45 45, 0, 1, 1, 275 275 L 275 230 Z', { fill: 'blue' });
简化的SVG路径:
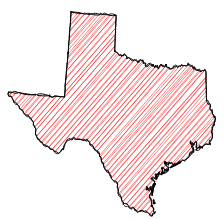
使用Web Workers
如果你的网页中导入了Workly(大小约1k),RoughJS自动将所有处理工作抛给Web Worker,同时释放UI主线程。有了Web Worker的支持,在使用RoughJs(如地图)创建复杂图形时,就非常有用了。你可以在这里阅读更多相关信息。
<script src="https://cdn.jsdelivr.net/gh/pshihn/workly/dist/workly.min.js"></script>

<script src="../../dist/rough.min.js"></script>
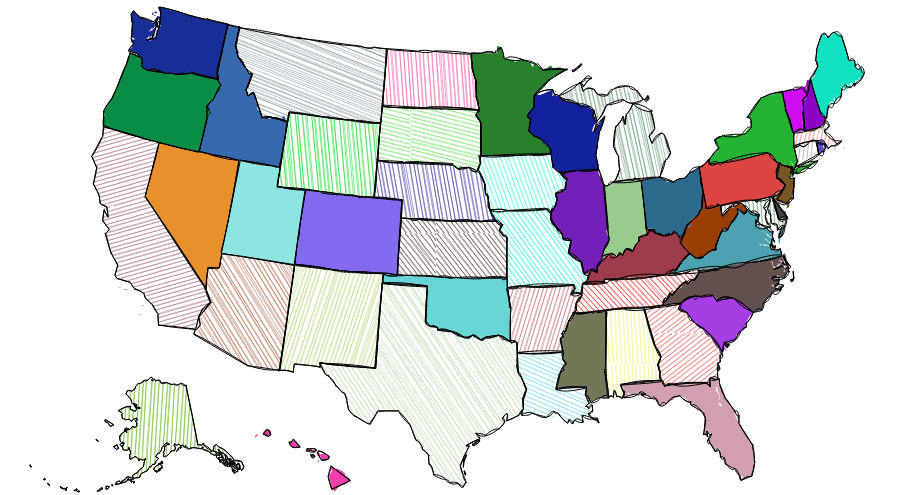
你可以在这里看到使用RoughJS生成地图的例子。
例子
你可以在这个页面中看到一些RoughJS使用例子。
简单的基本图形绘制
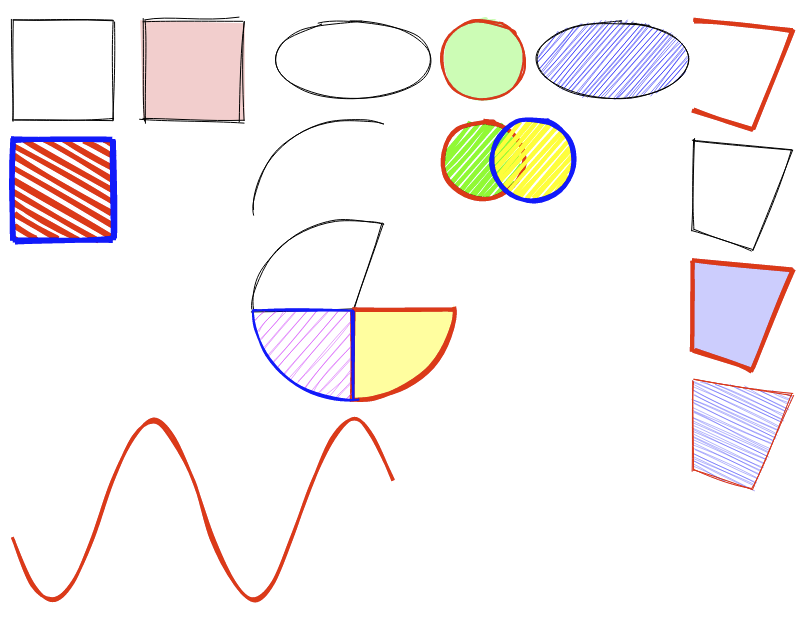
<canvas id="canvas" width="800" height="600"></canvas>
<script>

const rc = rough.canvas(document.getElementById('canvas'));

//line and rectangle

rc.rectangle(10, 10, 100, 100);

rc.rectangle(140, 10, 100, 100, {

  fill: 'rgba(255,0,0,0.2)',

  fillStyle: 'solid',

  roughness: 2

});

rc.rectangle(10, 130, 100, 100, {

  fill: 'red',

  stroke: 'blue',

  hachureAngle: 60,

  hachureGap: 10,

  fillWeight: 5,

  strokeWidth: 5

});

// ellipse and circle

rc.ellipse(350, 50, 150, 80);

rc.ellipse(610, 50, 150, 80, {

  fill: 'blue'

});

rc.circle(480, 50, 80, {

  stroke: 'red', strokeWidth: 2,

  fill: 'rgba(0,255,0,0.3)', fillStyle: 'solid'

});

//overlapping circles

rc.circle(480, 150, 80, {

  stroke: 'red', strokeWidth: 4,

  fill: 'rgba(0,255,0,1)', fillWeight: 4, hachureGap: 6

});

rc.circle(530, 150, 80, {

  stroke: 'blue', strokeWidth: 4,

  fill: 'rgba(255,255,0,1)', fillWeight: 4, hachureGap: 6

});

// linearPath and polygon

rc.linearPath([[690, 10], [790, 20], [750, 120], [690, 100]], {

  roughness: 0.7,

  stroke: 'red', strokeWidth: 4

});

rc.polygon([[690, 130], [790, 140], [750, 240], [690, 220]]);

rc.polygon([[690, 250], [790, 260], [750, 360], [690, 340]], {

  stroke: 'red', strokeWidth: 4,

  fill: 'rgba(0,0,255,0.2)', fillStyle: 'solid'

});

rc.polygon([[690, 370], [790, 385], [750, 480], [690, 460]], {

  stroke: 'red',

  hachureAngle: 65,

  fill: 'rgba(0,0,255,0.6)'

});

// arcs

rc.arc(350, 200, 200, 180, Math.PI, Math.PI * 1.6);

rc.arc(350, 300, 200, 180, Math.PI, Math.PI * 1.6, true);

rc.arc(350, 300, 200, 180, 0, Math.PI / 2, true, {

  stroke: 'red', strokeWidth: 4,

  fill: 'rgba(255,255,0,0.4)', fillStyle: 'solid'

});

rc.arc(350, 300, 200, 180, Math.PI / 2, Math.PI, true, {

  stroke: 'blue', strokeWidth: 2,

  fill: 'rgba(255,0,255,0.4)'

});

// draw sine curve

let points = [];

for (let i = 0; i < 20; i++) {

  // 4pi - 400px

  let x = (400 / 20) * i + 10;

  let xdeg = (Math.PI / 100) * x;

  let y = Math.round(Math.sin(xdeg) * 90) + 500;

  points.push([x, y]);

}

rc.curve(points, {

  roughness: 1.2, stroke: 'red', strokeWidth: 3

});

</script>
结合D3.js绘制柱形图
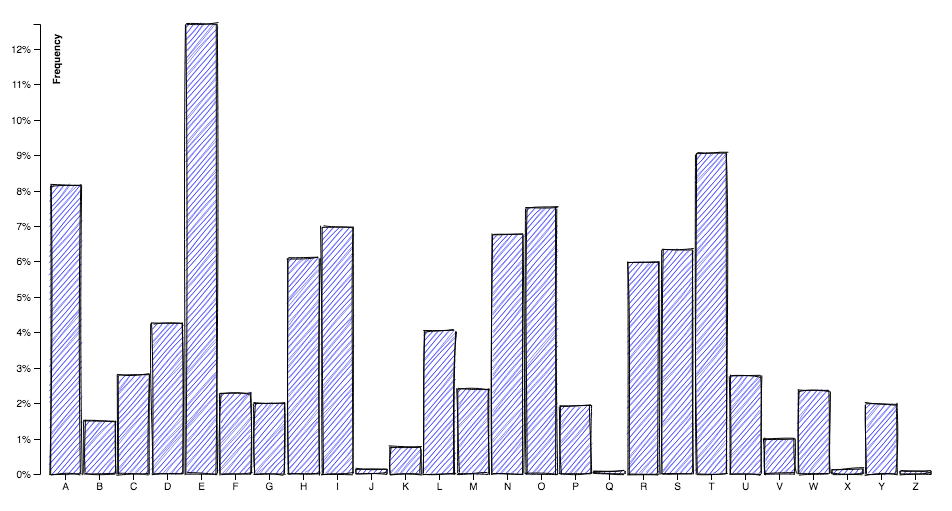
<script src="rough.min.js"></script>

<script src="https://d3js.org/d3.v4.min.js"></script>
<canvas id="canvas" width="960" height="500"></canvas>
<script>

var canvas = document.getElementById('canvas');

const rc = rough.canvas(canvas, {

  options: {

    fill: "blue",

    roughness: 0.8,

    bowing: 0.7

  }

});

var context = canvas.getContext("2d");

var margin = { top: 20, right: 20, bottom: 30, left: 40 },

  width = canvas.width - margin.left - margin.right,

  height = canvas.height - margin.top - margin.bottom;

var x = d3.scaleBand()

  .rangeRound([0, width])

  .padding(0.1);

var y = d3.scaleLinear()

  .rangeRound([height, 0]);

context.translate(margin.left, margin.top);

d3.tsv("data.tsv", function (d) {

  d.frequency = +d.frequency;

  return d;

}, function (error, data) {

  if (error) throw error;

  x.domain(data.map(function (d) { return d.letter; }));

  y.domain([0, d3.max(data, function (d) { return d.frequency; })]);

  var yTickCount = 10,

    yTicks = y.ticks(yTickCount),

    yTickFormat = y.tickFormat(yTickCount, "%");

  data.forEach(function (d) {

    rc.rectangle(x(d.letter), y(d.frequency), x.bandwidth(), height - y(d.frequency));

  });

  context.beginPath();

  x.domain().forEach(function (d) {

    context.moveTo(x(d) + x.bandwidth() / 2, height);

    context.lineTo(x(d) + x.bandwidth() / 2, height + 6);

  });

  context.strokeStyle = "black";

  context.stroke();

  context.textAlign = "center";

  context.textBaseline = "top";

  x.domain().forEach(function (d) {

    context.fillText(d, x(d) + x.bandwidth() / 2, height + 6);

  });

  context.beginPath();

  yTicks.forEach(function (d) {

    context.moveTo(0, y(d) + 0.5);

    context.lineTo(-6, y(d) + 0.5);

  });

  context.strokeStyle = "black";

  context.stroke();

  context.textAlign = "right";

  context.textBaseline = "middle";

  yTicks.forEach(function (d) {

    context.fillText(yTickFormat(d), -9, y(d));

  });

  context.beginPath();

  context.moveTo(-6.5, 0 + 0.5);

  context.lineTo(0.5, 0 + 0.5);

  context.lineTo(0.5, height + 0.5);

  context.lineTo(-6.5, height + 0.5);

  context.strokeStyle = "black";

  context.stroke();

  context.save();

  context.rotate(-Math.PI / 2);

  context.textAlign = "right";

  context.textBaseline = "top";

  context.font = "bold 10px sans-serif";

  context.fillText("Frequency", -10, 10);

  context.restore();

});

</script>
API
你可以非常欢乐地使用RoughJS,祝你好运!
JavaScript手绘风格的图形库RoughJS使用指南的更多相关文章
- 手绘风格的 JS 图表库:Chart.xkcd
本文作者:HelloGitHub-kalifun 图表库千万个今天 HelloGitHub 给大家推荐个很有"特色"的图表库:一个手绘风格的 JS 图表库 -- Chart.xkc ...
- 免费下载:320+ 手绘风格 Apple iOS7 图标
Themify 图标是一套用在网页设计和应用程序的图标,包括 320+ 手工制作的像素完美的苹果 iOS7 图标中汲取灵感.这些图标完全免费,您可以用于任何目的,无论是个人或商业. 您可能感兴趣的相 ...
- Python中使用cutecharts实现简单的手绘风格的图表
场景 效果 cutecharts的Github: https://github.com/chenjiandongx/cutecharts 注: 博客: https://blog.csdn.net/ba ...
- [置顶] 内存管理一点也不神秘————手绘iOS内存管理细节
今天给大家带来的一篇手绘风格博文<内存管理一点也不神秘> 每当我们程序执行alloc/new/copy/mutableCopy的时候,当我们执行release的时候,当我们执行retain ...
- Python绘图还在用Matplotlib?out了 !发现一款手绘可视化神器!
前言 本文的文字及图片来源于网络,仅供学习.交流使用,不具有任何商业用途,版权归原作者所有,如有问题请及时联系我们以作处理. GitHub 地址:https://github.com/chenjian ...
- 发现一款手绘可视化神器!Python绘图还在用Matplotlib?out了 !
前言 本文的文字及图片来源于网络,仅供学习.交流使用,不具有任何商业用途,版权归原作者所有,如有问题请及时联系我们以作处理. PS:如有需要Python学习资料的小伙伴可以加点击下方链接自行获取htt ...
- UWP 手绘视频创作工具技术分享系列 - 有 AI 的手绘视频
AI(Artificial Intelligence)正在不断的改变着各个行业的形态和人们的生活方式,图像识别.语音识别.自然语言理解等 AI 技术正在自动驾驶.智能机器人.人脸识别.智能助理等领域中 ...
- UWP 手绘视频创作工具技术分享系列 - 全新的 UWP 来画视频
从2017年11月开始,我们开始规划和开发全新的来画Pro,在12月23日的短视频峰会上推出了预览版供参会者体验,得到了很高的评价和关注度.吸取反馈建议后,终于在2018年1月11日正式推出了全新版本 ...
- CVPR2020论文解读:手绘草图卷积网络语义分割
CVPR2020论文解读:手绘草图卷积网络语义分割 Sketch GCN: Semantic Sketch Segmentation with Graph Convolutional Networks ...
随机推荐
- Windows下 Mysql启动报1067解决方法
前几天刚入职安装了一下Mysql 刚开始能打开 今天去公司发现启动不了服务 报1067错误, 在网上查看了一些方法,好多种版本..以下是本人的解决方法 1.打开运行-事件查看器--Windows日 ...
- 【转】msyql使用-用户创建/权限配置
MySQL 默认有个root用户,但是这个用户权限太大,一般只在管理数据库时候才用.如果在项目中要连接 MySQL 数据库,则建议新建一个权限较小的用户来连接. 在 MySQL 命令行模式下输入如下命 ...
- 给Docker武士们的正式邀请,赶紧收哦!
亲爱的Docker武士,Docker大师们喊你来参加Docker的定期聚啦~收好时间.地点,快来相见.切磋Docker吧!5月17日,微软上海港汇办公室,我们与你不见不散! 点击阅读原文,或直接进入注 ...
- C++ 构造转换函数和强制转换函数
http://blog.csdn.net/chenyiming_1990/article/details/8862497 1.对于系统的预定义基本类型数据,C++提供了两种类型转换方式:隐式类型转换和 ...
- 页面引入(include)方式的研究及性能比较
1. 应用Html中的框架(iframe) 目前大多数门户网站都应用iframe来进行页面上广告的投放,就是将不同的广告分别应用iframe投放到主页面上,优点是效率高,互不影响,缺点是不符合网页标准 ...
- ACM HDU-2952 Counting Sheep
Counting Sheep Time Limit: 2000/1000 MS (Java/Others) Memory Limit: 32768/32768 K (Java/Others) T ...
- My SQL 和SQL Server区别
MySQL 与SQL Server区别 今天了解了二者区别,整理网上查阅资料,总结列举如下: MSSQL == SQL server 是sybase与微软合作时期的产物. 对于程序开发人员而言,目前使 ...
- mvc 从客户端 中检测到有潜在危险的 Request 值
往MVC中加入了一个富文本编辑框,在提交信息的时候报了如下的错误: 从客户端(Content="<EM ><STRONG ><U >这是测试这...&qu ...
- SAP C/4HANA与人工智能和增强现实(AR)技术结合的又一个创新案例
今天这篇迟到的文章,来自我的同事Aviva. 去年SAP C/4HANA发布之后,SAP的从业者们可能或多或少都读过一些来自SAP官方渠道,比如微信公众号"SAP天天事"发布的一些 ...
- WAS8.5安装和部署
刚研究WAS8.5的安装部署,写一些注意事项: 1.下载安装软件 安装器:agent.installer.linux.gtk.x86_64_1.7.2000.20140227_0303 WAS: WA ...