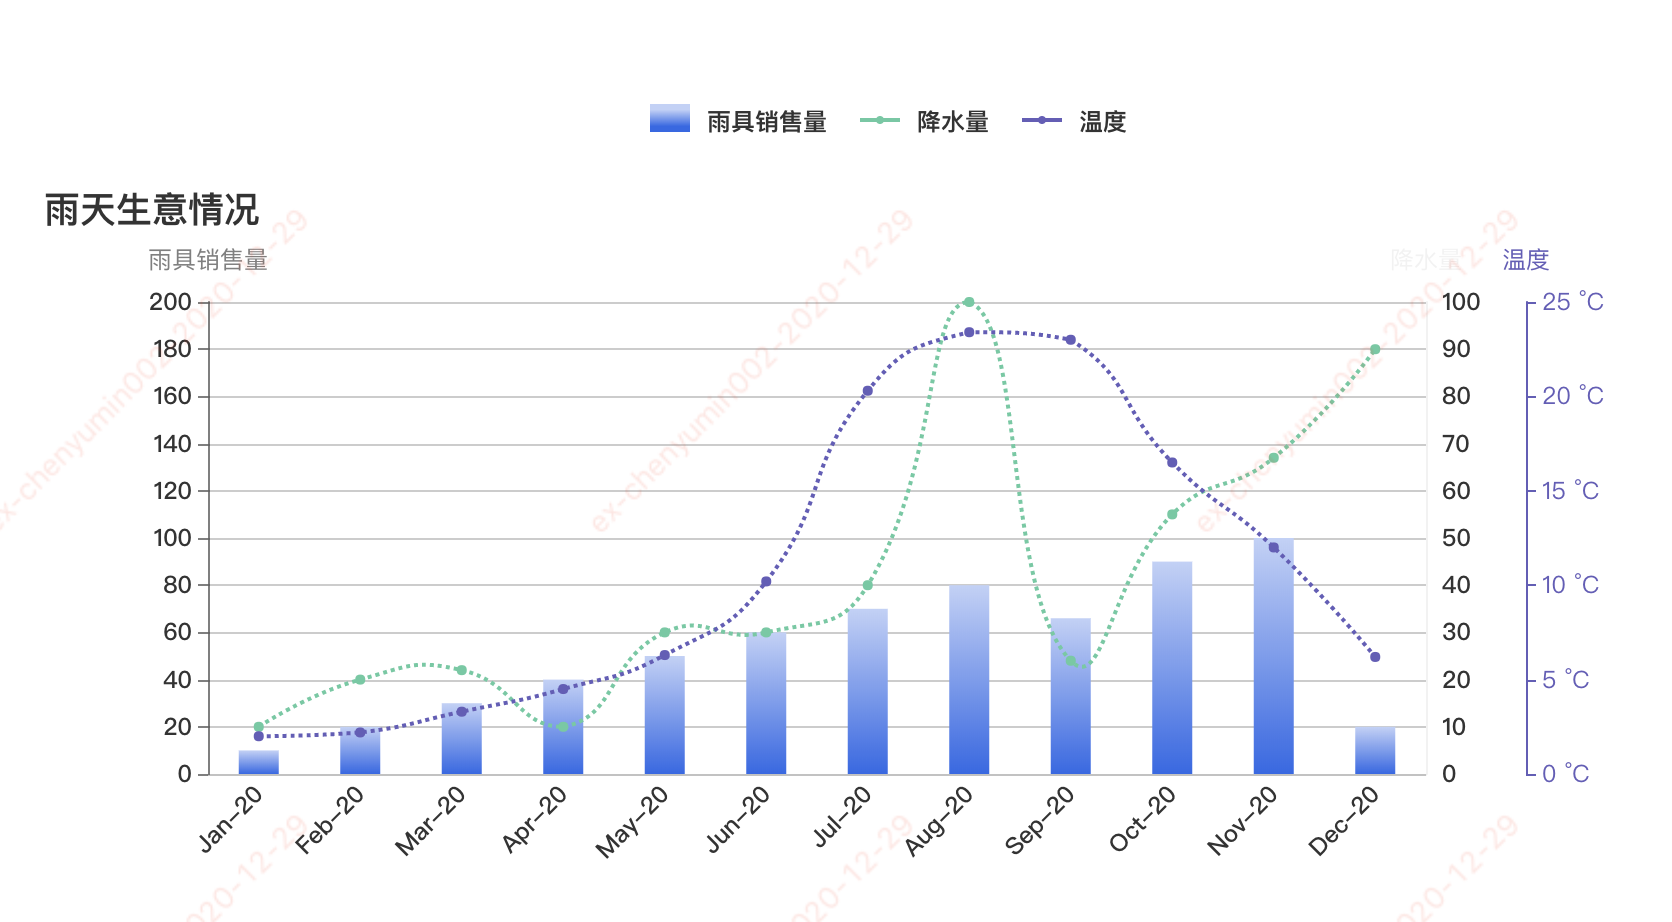
vue 折线柱状图
需求:折线柱状图实现,显示不同提示,颜色,标记等等。
图例:
实现:
<template>
<div class="transaction-barline">
<p class="lenged-title">
<span class="single-lenged" v-for="(item,index) in headerNameList" :key="index">
<span class="common" :class="item.background">
<span v-if="item.type == 'line'" :class="'borderFail color'+index"></span>
</span>
<span >{{item.name}}</span>
</span>
</p>
<div class="v-chart-capital" ref="capitalBarLine"></div>
</div>
</template>
<script>
import echarts from "echarts/lib/echarts";
// 引入柱状图组件
import "echarts/lib/chart/bar";
import "echarts/lib/chart/line";
// 引入提示框和title组件
import "echarts/lib/component/tooltip";
import "echarts/lib/component/title";
import "echarts/lib/component/legend";
require('echarts/lib/chart/custom');
export default {
name: "transaction-barline",
props: {
},
data() {
return {
myChart: null,
headerNameList:[
{ name: '雨具销售量', type: 'bar', background: "transItme0" },
{ name: '降水量', type: 'line', background: "firstFail" },
{ name: '温度', type: 'line', background: "firstFail1" }
],
detailData: {
barD: {
name: '雨靴',
list: [1,2,3,4,5,6,7,8,9,10,11,12]
},
lineG: {
name: '雨伞',
list: [10,20,30,40,50,60,70,80,90,10,11,12]
},
lineP: {
name: '雨衣',
list: [10,20,30,40,50,60,70,80,90,10,11,12]
}
},
colors: ['#C1D1F8', '#3266E8', '#5ECBA1', '#675bba'],
monthList:[
{
name: '1月',
english: 'Jan'
},
{
name: '2月',
english: 'Feb'
},
{
name: '3月',
english: 'Mar'
},
{
name: '4月',
english: 'Apr'
},
{
name: '5月',
english: 'May'
},
{
name: '6月',
english: 'Jun'
},
{
name: '7月',
english: 'Jul'
},
{
name: '8月',
english: 'Aug'
},
{
name: '9月',
english: 'Sep'
},
{
name: '10月',
english: 'Oct'
},
{
name: '11月',
english: 'Nov'
},
{
name: '12月',
english: 'Dec'
},
],
};
},
mounted: function() {
this.initChart();
},
created: () => {
},
watch: {
},
methods: {
initChart() {
this.setoption();
window.addEventListener("resize", this.myChart.resize);
},
setoption() {
let self = this;
if (this.myChart) {
this.myChart.dispose();
}
let that = this;
this.myChart = echarts.init(this.$refs.capitalBarLine);
let option = {
title: {
text: '雨天生意情况',
},
tooltip: {
trigger: 'item',
axisPointer: {
type: 'line',
lineStyle: {
color: 'transparent'
}
},
formatter: (params) => {
let str = '';
let dataIndex = params.dataIndex;
str += "<p style='color:#333;font-weight:bold'>" + params.name.slice(0,4)+'年'+ params.name.slice(5)+'月'+"</p>";
if (params.seriesType === 'bar') {
str += "<p>"+ params.seriesName + ": " + params.value +"</p>";
str += "<p>"+ this.detailData.barD.name + ":" +this.detailData.barD.list[dataIndex] + "</p>";
}
if (params.seriesType === 'line') {
str += "<p>"+ params.seriesName + ": " + params.value +"</p>";
if (params.seriesIndex == 1) {
str += "<p>"+ this.detailData.lineG.name + ":" +this.detailData.lineG.list[dataIndex] + "</p>";
} else {
str += "<p>"+ this.detailData.lineP.name + ":" +this.detailData.lineP.list[dataIndex] + "</p>";
}
}
return str;
},
backgroundColor: "#fff",
extraCssText:
"padding: 12px 20px; border-radius: 5px; line-height: 20px ; text-align: left; color: #37456E; box-shadow: 0 1px 8px 0 rgba(140,152,176,0.40);border-radius: 4px;",
textStyle: {
fontSize: 12,
fontFamily: '"PingFangSC-Regular", "Microsoft YaHei"'
},
}, xAxis: [
{
type: 'category',
data: ['2020-01', '2020-02', '2020-03', '2020-04', '2020-05', '2020-06', '2020-07', '2020-08', '2020-09', '2020-10', '2020-11', '2020-12'],
axisTick: {
show: false,
},
splitLine: {
show: false
},
axisLine: {
show: true,
lineStyle: {
color: 'rgba(0,0,0,0.05)'
}
},
axisLabel: {
textStyle: {
color: "#333",
},
rotate: 45,
fontSize: 12,
fontFamily: '"PingFangSC-Medium", "Microsoft YaHei"',
formatter: (val) => {
return this.dataDute(val);
}
},
}
],
grid: {
right: '20%'
},
yAxis: [
{
type: 'value',
name: '雨具销售量',
min: 0,
max: 200,
interval: 20,
axisTick: {
show: true
},
axisLine: {
show: true,
lineStyle: {
color: 'rgba(0,0,0,0.5)'
}
},
textStyle: {
color: "#7d889f"
},
splitLine: {
show: true
},
axisLabel: {
// show: false,
show: true,
formatter: (value, index) => {
// console.log(value, 'value');
return value;
},
textStyle: {
color: "#333",
},
fontFamily: '"PingFangSC-Medium", "Microsoft YaHei"'
}
},
{
type: 'value',
name: '降水量',
min: 0,
max: 100,
interval: 10,
axisLabel: {
show: true,
formatter: '{value} ml'
},
axisTick: {
show: false
},
axisLine: {
show: true,
lineStyle: {
color: 'rgba(0,0,0,0.05)'
}
},
splitLine: {
show: false,
lineStyle: {
type: 'dashed',
color: 'rgba(0,0,0,0.05)'
}
},
axisLabel: {
// show: true,
textStyle: {
color: "#333",
},
fontFamily: '"PingFangSC-Medium", "Microsoft YaHei"'
},
fontFamily: '"PingFangSC-Medium", "Microsoft YaHei"'
},
{
type: 'value',
name: '温度',
min: 0,
max: 25,
interval: 5,
offset: 50,
axisLine: {
lineStyle: {
color: '#675bba'
}
},
axisLabel: {
formatter: '{value} °C'
}
}
], series: [
{
name: '雨具销售量',
type: 'bar',
legendHoverLink: false,
barWidth: 20,
itemStyle: {
color: new echarts.graphic.LinearGradient(0, 0, 0, 1, [{
offset: 0,
color: this.colors[0]
}, {
offset: 1,
color: this.colors[1]
}])
},
label: {
show: false,
color: '#333',
position: 'top',
fontFamily: '"PingFangSC-Regular", "Microsoft YaHei"',
},
data: [10,20,30,40,50,60,70,80,66,90,100,20]
},
{
name: '降水量',
type: 'line',
symbol: 'circle',
symbolSize: 5,
smooth: true,
legendHoverLink: false,
lineStyle: {
type: 'dotted',
color: this.colors[2],
width: 2
},
itemStyle: {
color: this.colors[2]
},
yAxisIndex: 1,
data: [10,20,22,10,30,30,40,100,24,55,67,90]
},
{
name: '平均温度',
type: 'line',
symbol: 'circle',
symbolSize: 5,
smooth: true,
legendHoverLink: false,
lineStyle: {
type: 'dotted',
color: this.colors[3],
width: 2
},
itemStyle: {
color: this.colors[3]
},
yAxisIndex: 2,
data: [2.0, 2.2, 3.3, 4.5, 6.3, 10.2, 20.3, 23.4, 23.0, 16.5, 12.0, 6.2]
}
]
}
this.myChart.setOption(option);
}, getInitData() {
let inputData = {
headerNameList:[
{ name: '雨具销售量', background: "transItme0" },
{ name: '降水量', background: "firstFail" },
{ name: '温度', background: "firstFail1" }
],
xAxisData: ['2020-01', '2020-02', '2020-03', '2020-04', '2020-05', '2020-06', '2020-07', '2020-08', '2020-09', '2020-10', '2020-11', '2020-12'],
yAxisData: [
{
name: '雨具销售量',
list: [10,20,30,40,50,60,70,80,66,90,100,20],
type: 'bar',
color: '#333'
}
]
};
},
dataDute(value) {
let str = '';
let df = value.split('-')[0],
dy = df.substr(2),
monthDay = value.split('-')[1],
deMonth = 0;
if(monthDay.substr(0,1) === '0') {
deMonth = monthDay.substr(1,1);
} else {
deMonth = monthDay;
} let monthDays = deMonth+'月';
this.monthList.forEach((item, index) => {
if(item.name === monthDays) {
str = item.english + '-'+dy;
}
})
return str;
}, }
};
</script> <style lang="less" scoped>
.transaction-barline{
position: relative;
height: 100%;
.v-chart-capital {
height: 356px;
} .lenged-title {
width: 100%;
position: relative;
top: 80%;
margin: 20px 0;
text-align: center;
box-sizing: border-box;
font-size: 12px;
color: #333333;
font-weight: bold;
.single-lenged {
display: inline-block;
height: 20px;
line-height: 20px;
margin-right: 16px;
}
.common {
display: inline-block;
height: 0;
position: relative;
top: 1px;
margin-right: 5px;
height: 14px;
width: 20px;
.borderFail{
width: 4px;
height: 4px;
border-radius: 50%;
position: absolute;
bottom: -3px;
left: 8px;
// background: #5ECAA1;
}
.color1{
background: #5ECAA1;
}
.color2{
background: #675bba;
}
}
.single-lenged:hover {
cursor: pointer;
}
.transItme0{
background: -ms-linear-gradient(270deg, #C1D1F8 0%, #C1D1F8 20%, #3266E8 80%,#3266E8 100%);
background: -webkit-linear-gradient(270deg, #C1D1F8 0%, #C1D1F8 20%, #3266E8 80%,#3266E8 100%);
background: -o-linear-gradient(270deg, #C1D1F8 0%, #C1D1F8 20%, #3266E8 80%,#3266E8 100%);
}
.transItme1{
background: #5ECAA1;
}
.firstFail{
position: relative;
top: -4px;
border-bottom: 2px solid #5ECAA1;
}
.firstFail1{
position: relative;
top: -4px;
border-bottom: 2px solid #675bba;
}
}
} </style>
vue 折线柱状图的更多相关文章
- vue Echarts 柱状图点击事件
drawBar(){ let that = this; let chart = this.$echarts.init(document.getElementById('bar-graph')); le ...
- [vue折线图] 记录SpringBoot+Vue3.0折线图订单信息展示
因公司业务需求,需要做一份订单相关的折线图, 如果其中有一天没有订单的话,这一天就是空缺的,在绘制折线图的时候是不允许的,所有要求把没有订单数据的日期也要在图表显示. 使用技术vue3.0+sprin ...
- echarts在一个折线/柱状图浮窗显示多条数据
解决问题就在data里面,首先 data里面是可以json数组形式,如官方API上的 name:”“, value:”“,等 value是echart识别折线图的key值.1.来看数据格式 data: ...
- Vue 柱状图
echarts.js作为国内的IT三巨头之一的百度的推出一款相对较为成功的开源项目,总体上来说有这样的一些优点 1.echarts.js容易使用 echarts.js的官方文档比较详细,而且官网中提供 ...
- MATLAB 出一张好看的图
1.坐标轴的视点(viewpoint):从哪个方向看整个坐标系统,这决定了坐标轴的方向和位置,通过view函数实现视点的设置:view([z y ]):(将坐标系统想象为一座房子,而自己是个会飞的天使 ...
- echarts常用说明
import { Injectable } from '@angular/core'; //模板option通用 let fff7 = '#fff'; //字体统一颜色rgba(255,255,255 ...
- hellocharts的折线图与柱状图的结合之ComboLineColumnChartView
哼哼,网上找了半天都不全,所以决定自己写一个完整的可以直接贴代码的 test.xml <?xml version="1.0" encoding="utf-8&quo ...
- ChartControl 折线图 柱状图
添加折线图(柱状图) 拖动ChartControl到Form上 在Series Collection中添加Line(或Bar) DevExpress.XtraCharts.Series series1 ...
- C# 绘制统计图(柱状图, 折线图, 扇形图)【转载】
统计图形种类繁多, 有柱状图, 折线图, 扇形图等等, 而统计图形的绘制方法也有很多, 有Flash制作的统计图形, 有水晶报表生成统计图形, 有专门制图软件制作, 也有编程语言自己制作的:这里我们用 ...
随机推荐
- codeforces 1042D - Petya and Array【树状数组+离散化】
题目:戳这里 题意:有n个数,问有多少个区间满足[L,R]内的和小于t. 解题思路: [L,R]内的和小于t等价于sum[R]-sum[L-1]<t,将sum[L-1]左移,可以看出R与L的关系 ...
- c++ 输出文件夹(不包括子文件夹)中后缀文件
参考:_finddata_t结构体用法 - 麒麒川的博客 - CSDN博客 准备知识部分: MessageBox MessageBox function (winuser.h) | Microsoft ...
- hdu-1941 Find the Shortest Common Superstring
The shortest common superstring of 2 strings S 1 and S 2 is a string S with the minimum number of ch ...
- c# 类(2)
构造函数 和 析构函数 Constructors and destructors 构造函数是一个特殊的函数,当实例化一个类的时候自动调用这个函数,无返回值(不用定义返回类型)普通函数的定义 publi ...
- HDU4578 Transformation(多标记线段树)题解
题意: 操作有:\(1\).区间都加\(a\):\(2\).区间都乘\(a\):\(3\).区间都重置成\(a\):\(4\).询问区间幂次和\(\sum_{i=l}^rnum[i]^p(p\in\{ ...
- ZOJ 3494 BCD Code(AC自动机 + 数位DP)题解
题意:每位十进制数都能转化为4位二进制数,比如9是1001,127是 000100100111,现在问你,在L到R(R <= $10^{200}$)范围内,有多少数字的二进制表达式不包含模式串. ...
- CDN maxcdn for speed up
https://www.maxcdn.com/ The Next Generation CDN.Plug into a whole new level of speed.From: https://w ...
- js sort map by key
js sort map by key Map map to array // Array.from() Object let obj = {}; for(let key of Object.keys( ...
- JWT All In One
JWT All In One OAuth 2.0 JWT JSON Web Tokens https://jwt.io refs https://www.cnblogs.com/xgqfrms/tag ...
- Flutter 模拟youtube快进icon
import 'package:flutter/material.dart'; void main() => runApp(MyApp()); class MyApp extends State ...