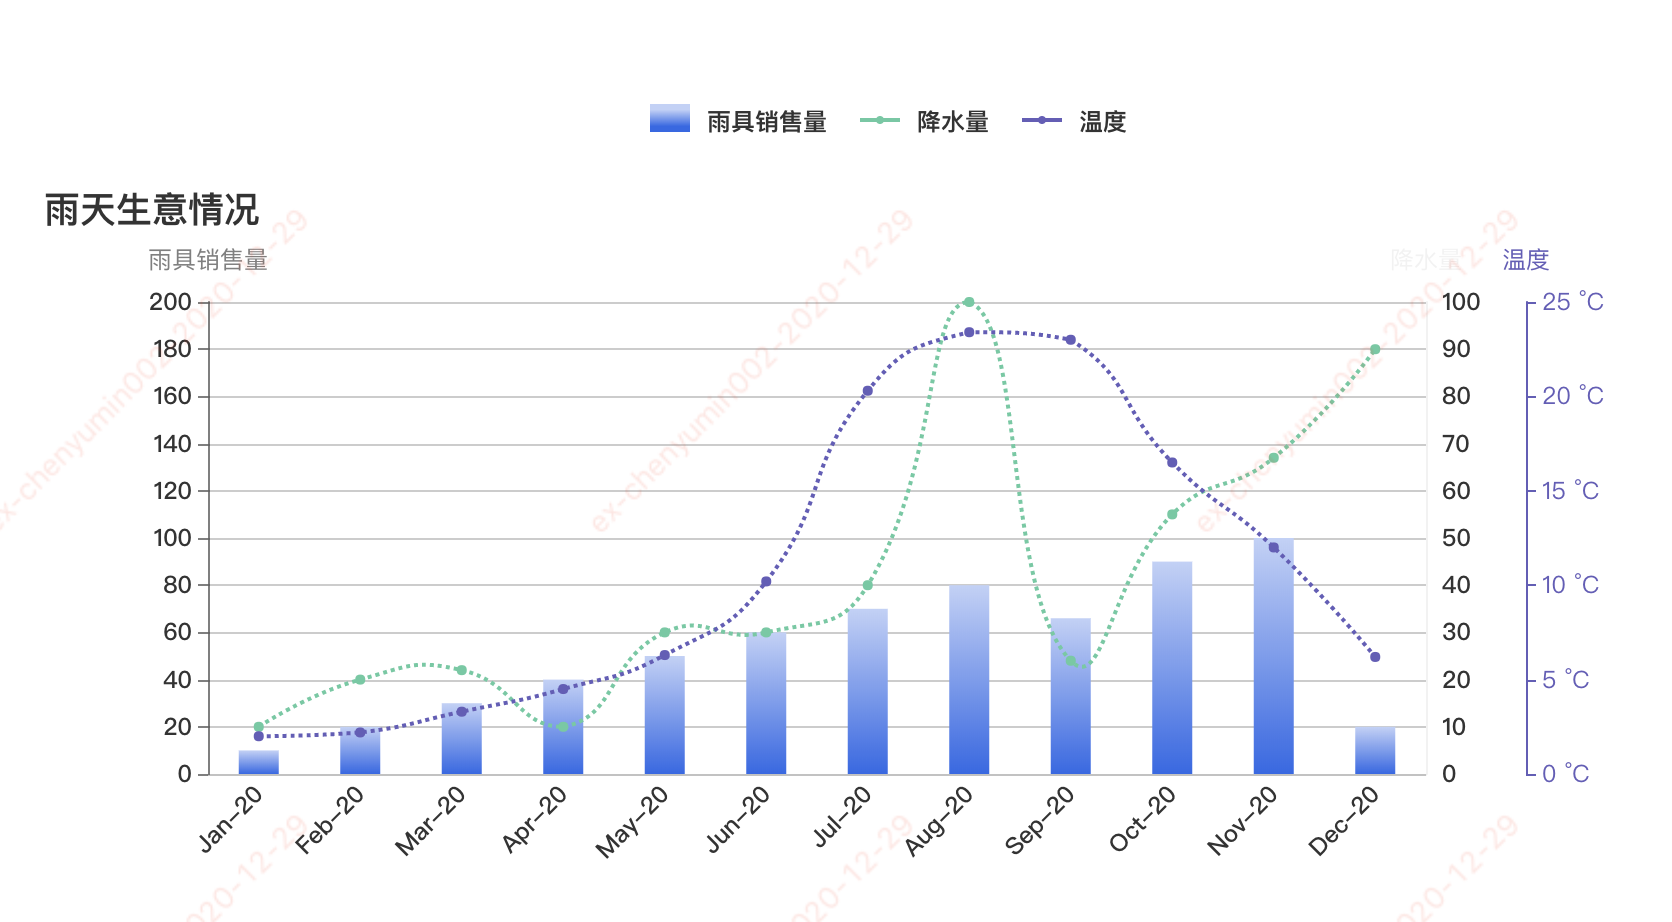
vue 折线柱状图
需求:折线柱状图实现,显示不同提示,颜色,标记等等。
图例:
实现:
<template>
<div class="transaction-barline">
<p class="lenged-title">
<span class="single-lenged" v-for="(item,index) in headerNameList" :key="index">
<span class="common" :class="item.background">
<span v-if="item.type == 'line'" :class="'borderFail color'+index"></span>
</span>
<span >{{item.name}}</span>
</span>
</p>
<div class="v-chart-capital" ref="capitalBarLine"></div>
</div>
</template>
<script>
import echarts from "echarts/lib/echarts";
// 引入柱状图组件
import "echarts/lib/chart/bar";
import "echarts/lib/chart/line";
// 引入提示框和title组件
import "echarts/lib/component/tooltip";
import "echarts/lib/component/title";
import "echarts/lib/component/legend";
require('echarts/lib/chart/custom');
export default {
name: "transaction-barline",
props: {
},
data() {
return {
myChart: null,
headerNameList:[
{ name: '雨具销售量', type: 'bar', background: "transItme0" },
{ name: '降水量', type: 'line', background: "firstFail" },
{ name: '温度', type: 'line', background: "firstFail1" }
],
detailData: {
barD: {
name: '雨靴',
list: [1,2,3,4,5,6,7,8,9,10,11,12]
},
lineG: {
name: '雨伞',
list: [10,20,30,40,50,60,70,80,90,10,11,12]
},
lineP: {
name: '雨衣',
list: [10,20,30,40,50,60,70,80,90,10,11,12]
}
},
colors: ['#C1D1F8', '#3266E8', '#5ECBA1', '#675bba'],
monthList:[
{
name: '1月',
english: 'Jan'
},
{
name: '2月',
english: 'Feb'
},
{
name: '3月',
english: 'Mar'
},
{
name: '4月',
english: 'Apr'
},
{
name: '5月',
english: 'May'
},
{
name: '6月',
english: 'Jun'
},
{
name: '7月',
english: 'Jul'
},
{
name: '8月',
english: 'Aug'
},
{
name: '9月',
english: 'Sep'
},
{
name: '10月',
english: 'Oct'
},
{
name: '11月',
english: 'Nov'
},
{
name: '12月',
english: 'Dec'
},
],
};
},
mounted: function() {
this.initChart();
},
created: () => {
},
watch: {
},
methods: {
initChart() {
this.setoption();
window.addEventListener("resize", this.myChart.resize);
},
setoption() {
let self = this;
if (this.myChart) {
this.myChart.dispose();
}
let that = this;
this.myChart = echarts.init(this.$refs.capitalBarLine);
let option = {
title: {
text: '雨天生意情况',
},
tooltip: {
trigger: 'item',
axisPointer: {
type: 'line',
lineStyle: {
color: 'transparent'
}
},
formatter: (params) => {
let str = '';
let dataIndex = params.dataIndex;
str += "<p style='color:#333;font-weight:bold'>" + params.name.slice(0,4)+'年'+ params.name.slice(5)+'月'+"</p>";
if (params.seriesType === 'bar') {
str += "<p>"+ params.seriesName + ": " + params.value +"</p>";
str += "<p>"+ this.detailData.barD.name + ":" +this.detailData.barD.list[dataIndex] + "</p>";
}
if (params.seriesType === 'line') {
str += "<p>"+ params.seriesName + ": " + params.value +"</p>";
if (params.seriesIndex == 1) {
str += "<p>"+ this.detailData.lineG.name + ":" +this.detailData.lineG.list[dataIndex] + "</p>";
} else {
str += "<p>"+ this.detailData.lineP.name + ":" +this.detailData.lineP.list[dataIndex] + "</p>";
}
}
return str;
},
backgroundColor: "#fff",
extraCssText:
"padding: 12px 20px; border-radius: 5px; line-height: 20px ; text-align: left; color: #37456E; box-shadow: 0 1px 8px 0 rgba(140,152,176,0.40);border-radius: 4px;",
textStyle: {
fontSize: 12,
fontFamily: '"PingFangSC-Regular", "Microsoft YaHei"'
},
}, xAxis: [
{
type: 'category',
data: ['2020-01', '2020-02', '2020-03', '2020-04', '2020-05', '2020-06', '2020-07', '2020-08', '2020-09', '2020-10', '2020-11', '2020-12'],
axisTick: {
show: false,
},
splitLine: {
show: false
},
axisLine: {
show: true,
lineStyle: {
color: 'rgba(0,0,0,0.05)'
}
},
axisLabel: {
textStyle: {
color: "#333",
},
rotate: 45,
fontSize: 12,
fontFamily: '"PingFangSC-Medium", "Microsoft YaHei"',
formatter: (val) => {
return this.dataDute(val);
}
},
}
],
grid: {
right: '20%'
},
yAxis: [
{
type: 'value',
name: '雨具销售量',
min: 0,
max: 200,
interval: 20,
axisTick: {
show: true
},
axisLine: {
show: true,
lineStyle: {
color: 'rgba(0,0,0,0.5)'
}
},
textStyle: {
color: "#7d889f"
},
splitLine: {
show: true
},
axisLabel: {
// show: false,
show: true,
formatter: (value, index) => {
// console.log(value, 'value');
return value;
},
textStyle: {
color: "#333",
},
fontFamily: '"PingFangSC-Medium", "Microsoft YaHei"'
}
},
{
type: 'value',
name: '降水量',
min: 0,
max: 100,
interval: 10,
axisLabel: {
show: true,
formatter: '{value} ml'
},
axisTick: {
show: false
},
axisLine: {
show: true,
lineStyle: {
color: 'rgba(0,0,0,0.05)'
}
},
splitLine: {
show: false,
lineStyle: {
type: 'dashed',
color: 'rgba(0,0,0,0.05)'
}
},
axisLabel: {
// show: true,
textStyle: {
color: "#333",
},
fontFamily: '"PingFangSC-Medium", "Microsoft YaHei"'
},
fontFamily: '"PingFangSC-Medium", "Microsoft YaHei"'
},
{
type: 'value',
name: '温度',
min: 0,
max: 25,
interval: 5,
offset: 50,
axisLine: {
lineStyle: {
color: '#675bba'
}
},
axisLabel: {
formatter: '{value} °C'
}
}
], series: [
{
name: '雨具销售量',
type: 'bar',
legendHoverLink: false,
barWidth: 20,
itemStyle: {
color: new echarts.graphic.LinearGradient(0, 0, 0, 1, [{
offset: 0,
color: this.colors[0]
}, {
offset: 1,
color: this.colors[1]
}])
},
label: {
show: false,
color: '#333',
position: 'top',
fontFamily: '"PingFangSC-Regular", "Microsoft YaHei"',
},
data: [10,20,30,40,50,60,70,80,66,90,100,20]
},
{
name: '降水量',
type: 'line',
symbol: 'circle',
symbolSize: 5,
smooth: true,
legendHoverLink: false,
lineStyle: {
type: 'dotted',
color: this.colors[2],
width: 2
},
itemStyle: {
color: this.colors[2]
},
yAxisIndex: 1,
data: [10,20,22,10,30,30,40,100,24,55,67,90]
},
{
name: '平均温度',
type: 'line',
symbol: 'circle',
symbolSize: 5,
smooth: true,
legendHoverLink: false,
lineStyle: {
type: 'dotted',
color: this.colors[3],
width: 2
},
itemStyle: {
color: this.colors[3]
},
yAxisIndex: 2,
data: [2.0, 2.2, 3.3, 4.5, 6.3, 10.2, 20.3, 23.4, 23.0, 16.5, 12.0, 6.2]
}
]
}
this.myChart.setOption(option);
}, getInitData() {
let inputData = {
headerNameList:[
{ name: '雨具销售量', background: "transItme0" },
{ name: '降水量', background: "firstFail" },
{ name: '温度', background: "firstFail1" }
],
xAxisData: ['2020-01', '2020-02', '2020-03', '2020-04', '2020-05', '2020-06', '2020-07', '2020-08', '2020-09', '2020-10', '2020-11', '2020-12'],
yAxisData: [
{
name: '雨具销售量',
list: [10,20,30,40,50,60,70,80,66,90,100,20],
type: 'bar',
color: '#333'
}
]
};
},
dataDute(value) {
let str = '';
let df = value.split('-')[0],
dy = df.substr(2),
monthDay = value.split('-')[1],
deMonth = 0;
if(monthDay.substr(0,1) === '0') {
deMonth = monthDay.substr(1,1);
} else {
deMonth = monthDay;
} let monthDays = deMonth+'月';
this.monthList.forEach((item, index) => {
if(item.name === monthDays) {
str = item.english + '-'+dy;
}
})
return str;
}, }
};
</script> <style lang="less" scoped>
.transaction-barline{
position: relative;
height: 100%;
.v-chart-capital {
height: 356px;
} .lenged-title {
width: 100%;
position: relative;
top: 80%;
margin: 20px 0;
text-align: center;
box-sizing: border-box;
font-size: 12px;
color: #333333;
font-weight: bold;
.single-lenged {
display: inline-block;
height: 20px;
line-height: 20px;
margin-right: 16px;
}
.common {
display: inline-block;
height: 0;
position: relative;
top: 1px;
margin-right: 5px;
height: 14px;
width: 20px;
.borderFail{
width: 4px;
height: 4px;
border-radius: 50%;
position: absolute;
bottom: -3px;
left: 8px;
// background: #5ECAA1;
}
.color1{
background: #5ECAA1;
}
.color2{
background: #675bba;
}
}
.single-lenged:hover {
cursor: pointer;
}
.transItme0{
background: -ms-linear-gradient(270deg, #C1D1F8 0%, #C1D1F8 20%, #3266E8 80%,#3266E8 100%);
background: -webkit-linear-gradient(270deg, #C1D1F8 0%, #C1D1F8 20%, #3266E8 80%,#3266E8 100%);
background: -o-linear-gradient(270deg, #C1D1F8 0%, #C1D1F8 20%, #3266E8 80%,#3266E8 100%);
}
.transItme1{
background: #5ECAA1;
}
.firstFail{
position: relative;
top: -4px;
border-bottom: 2px solid #5ECAA1;
}
.firstFail1{
position: relative;
top: -4px;
border-bottom: 2px solid #675bba;
}
}
} </style>
vue 折线柱状图的更多相关文章
- vue Echarts 柱状图点击事件
drawBar(){ let that = this; let chart = this.$echarts.init(document.getElementById('bar-graph')); le ...
- [vue折线图] 记录SpringBoot+Vue3.0折线图订单信息展示
因公司业务需求,需要做一份订单相关的折线图, 如果其中有一天没有订单的话,这一天就是空缺的,在绘制折线图的时候是不允许的,所有要求把没有订单数据的日期也要在图表显示. 使用技术vue3.0+sprin ...
- echarts在一个折线/柱状图浮窗显示多条数据
解决问题就在data里面,首先 data里面是可以json数组形式,如官方API上的 name:”“, value:”“,等 value是echart识别折线图的key值.1.来看数据格式 data: ...
- Vue 柱状图
echarts.js作为国内的IT三巨头之一的百度的推出一款相对较为成功的开源项目,总体上来说有这样的一些优点 1.echarts.js容易使用 echarts.js的官方文档比较详细,而且官网中提供 ...
- MATLAB 出一张好看的图
1.坐标轴的视点(viewpoint):从哪个方向看整个坐标系统,这决定了坐标轴的方向和位置,通过view函数实现视点的设置:view([z y ]):(将坐标系统想象为一座房子,而自己是个会飞的天使 ...
- echarts常用说明
import { Injectable } from '@angular/core'; //模板option通用 let fff7 = '#fff'; //字体统一颜色rgba(255,255,255 ...
- hellocharts的折线图与柱状图的结合之ComboLineColumnChartView
哼哼,网上找了半天都不全,所以决定自己写一个完整的可以直接贴代码的 test.xml <?xml version="1.0" encoding="utf-8&quo ...
- ChartControl 折线图 柱状图
添加折线图(柱状图) 拖动ChartControl到Form上 在Series Collection中添加Line(或Bar) DevExpress.XtraCharts.Series series1 ...
- C# 绘制统计图(柱状图, 折线图, 扇形图)【转载】
统计图形种类繁多, 有柱状图, 折线图, 扇形图等等, 而统计图形的绘制方法也有很多, 有Flash制作的统计图形, 有水晶报表生成统计图形, 有专门制图软件制作, 也有编程语言自己制作的:这里我们用 ...
随机推荐
- OpenStack Train版-1.安装基础环境&服务
1. 服务组件的密码 密码名称 描述 ADMIN_PASS admin用户密码 CINDER_DBPASS 块设备存储服务的数据库密码 CINDER_PASS 块设备存储服务的 cinder 密码 D ...
- 一个C++源文件从文本到可执行文件经历的过程
一个C++源文件从文本到可执行文件经历的过程 以Hello World为例进行说明 首先我们编写一个cpp源程序 test.cpp #include <iostream> using na ...
- Spring(三) Spring IOC 初体验
Web IOC 容器初体验 我们还是从大家最熟悉的 DispatcherServlet 开始,我们最先想到的还是 DispatcherServlet 的 init() 方法.我们发现在 Dispath ...
- 高并发之ReentrantLock、CountDownLatch、CyclicBarrier
本系列研究总结高并发下的几种同步锁的使用以及之间的区别,分别是:ReentrantLock.CountDownLatch.CyclicBarrier.Phaser.ReadWriteLock.Stam ...
- set CSS style in js solutions All In One
set CSS style in js solutions All In One css in js set each style property separately See the Pen se ...
- React Hooks: useMemo All In One
React Hooks: useMemo All In One useMemo https://reactjs.org/docs/hooks-reference.html#usememo refs x ...
- JavaScript 设计模式: 发布者-订阅者模式
JavaScript 设计模式: 发布者-订阅者模式 发布者-订阅者模式 https://github.com/Kelichao/javascript.basics/issues/22 https:/ ...
- React Hooks vs React Class vs React Function All In One
React Hooks vs React Class vs React Function All In One React Component Types React Hooks Component ...
- free useful skills videos courses & tutorials
free useful skills videos courses & tutorials website video courses https://realpython.com/ http ...
- Chrome new features preview
Chrome new features preview CSS Overview https://css-tricks.com/new-in-chrome-css-overview/ capture ...