
ngx-echart地图
一、运行截图
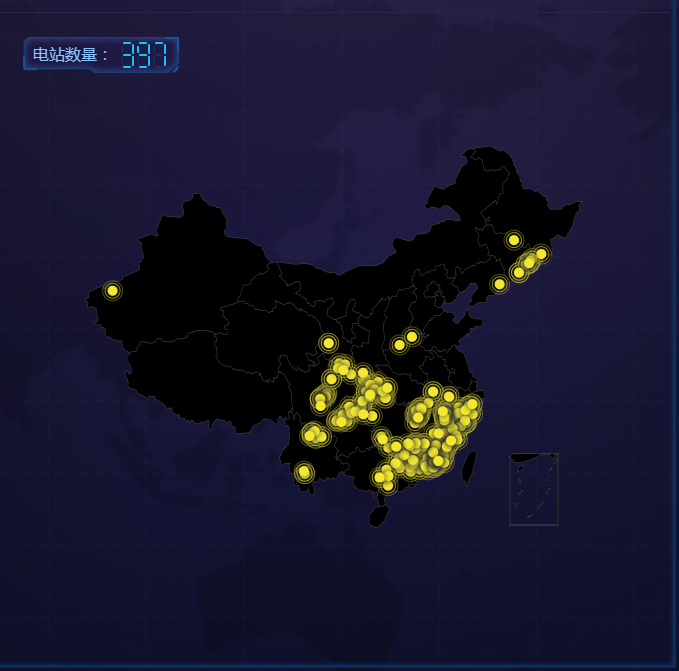
二、代码
html代码:
 <div style="padding:24px;">

   <p style="font-size: 16px;margin-bottom: 0px;color: #8cc5fe;background-image: url('./../../assets/images/maptitle.png');width: 250px;background-size: contain;background-repeat: no-repeat;height: 36px;line-height: 32px;padding-left: 10px;position: absolute;z-index: 0;">

     电站数量:

     <label *ngIf="mapComponentConfig.length !=0" style="font-size: 22px;font-family: -webkit-pictograph;color: #1bc3fd;">

       <app-led-clockfont [fontValue]="mapComponentConfig.length"></app-led-clockfont>

       <!-- mapComponentConfig.length = 397 -->

     </label>

     <label *ngIf="mapComponentConfig.length ==0" style="font-size: 22px;font-family: -webkit-pictograph;color: #1bc3fd;"><b>--</b></label>

   </p>

   <div echarts [options]="option1"  (chartInit)="onChartInit($event)" class="demo-chart" style="min-height: 600px;"></div>

 </div>
ts代码:
 import { Component, OnInit, Input, SimpleChanges } from '@angular/core';

 import { HttpClient } from '@angular/common/http';

 import * as echarts from 'echarts';

 @Component({

   selector: 'app-map',

   templateUrl: './map.component.html',

   styleUrls: ['./map.component.css']

 })

 export class MapComponent implements OnInit {

   @Input() mapComponentConfig;

   private map:any ;

   public option1:any;

   //地图

   private data = [];

   private provinceDataStatus:any;

   private echartsIntance:any;

      constructor(private http:HttpClient) {

     console.log("我在'地图'组件,构造函数中");

    }

   ngOnInit() {

     console.log("我在'地图'组件,初始化函数中");

     this.http.get('assets/data/china.json')

         .subscribe(geoJson  => {

             echarts.registerMap('china', geoJson);

             if(this.mapComponentConfig){

                 this.option1 = {

                     backgroundColor: 'transparent',

                     title: {

                       text: '',

                     //   this.mapComponentConfig.count

                       left: 'left',

                       textStyle: {

                           color: '#fff'

                       }

                     },

                     tooltip : {

                       trigger: 'item'

                     },

                     legend: {

                       orient: 'vertical',

                       y: 'bottom',

                       x:'right',

                       data:['pm2.5'],

                       textStyle: {

                           color: '#fff'

                       }

                     },

                     formatter: '{b}',

                     geo: {

                       map: 'china',

                         // map: 'China',

                       label: {

                           emphasis: {

                               show: false

                           }

                       },

                       roam: true,

                       itemStyle: {

                         //   color:'purple',

                           borderColor :'black',

                           borderWidth :5,

                           normal: {

                               areaColor: 'black',

                             //   borderColor: 'purple'

                           },

                           emphasis: {

                             areaColor: 'black',

                             //   areaColor: '#2a333d'

                           }

                       }

                     },

                     series : [

                       {

                           name: '',

                           type: 'effectScatter',

                           coordinateSystem: 'geo',

                           data:this.convertData(this.mapComponentConfig.data),

                           zoom: 3.2,

                           symbolSize:10,

                           showEffectOn: 'render',

                           rippleEffect: {

                               brushType: 'stroke'

                           },

                           hoverAnimation: true,

                           label: {

                               normal: {

                                   formatter: '{b}',

                                   position: 'right',

                                   show: false

                               }

                           },

                           itemStyle: {

                               normal: {

                                   color: '#f4e925',

                                   shadowBlur: 10,

                                   shadowColor: '#333'

                               }

                           },

                           zlevel: 1

                       }

                     ]

                 };

             }else{

                 console.log("地图数据请求超时");

             };

         })

   }

   convertData (data) {

     const _self = this;

     let res = [];

     if(_self.mapComponentConfig){

         for (var i = 0; i < _self.mapComponentConfig.length; i++) {

             res.push({

                 name:_self.mapComponentConfig[i].station_name,

                 value:[_self.mapComponentConfig[i].jingdu,_self.mapComponentConfig[i].weidu]

             })

         }

         return res;

     }else{

         //Do-nothing

          res = [];

          return res;

     }

   };

   //图表初始化实例

   onChartInit(event) {

          this.echartsIntance = event;

     // this.echartsIntance.showLoading(this.default);

   }

   ngOnChanges(changes: SimpleChanges): void {

      if(changes['mapComponentConfig'] !== undefined){

          let new_data = this.mapComponentConfig.data;

             this.option1 = {

                 backgroundColor: 'transparent',

                 title: {

                   text: '',

                   left: 'left',

                   textStyle: {

                       color: '#fff'

                   }

                 },

                 tooltip : {

                   trigger: 'item'

                 },

                 legend: {

                   orient: 'vertical',

                   y: 'bottom',

                   x:'right',

                   data:['pm2.5'],

                   textStyle: {

                       color: '#fff'

                   }

                 },

                 formatter: '{b}',

                 geo: {

                   map: 'china',

                   label: {

                       emphasis: {

                           show: false

                       }

                   },

                   roam: true,

                   itemStyle: {

                       borderColor :'black',

                       borderWidth :5,

                       normal: {

                           areaColor:'black',

                       },

                       emphasis: {

                         areaColor: 'black',

                       }

                   }

                 },

                 series : [

                   {

                       name: '',

                       type: 'effectScatter',

                       coordinateSystem: 'geo',

                       data:this.convertData(new_data),

                       zoom: 3.2,

                       symbolSize:10,

                       showEffectOn: 'render',

                       rippleEffect: {

                           brushType: 'stroke'

                       },

                       hoverAnimation: true,

                       label: {

                           normal: {

                               formatter: '{b}',

                               position: 'right',

                               show: false

                           }

                       },

                       itemStyle: {

                           normal: {

                               color: '#f4e925',

                             //   color:'#e96c1d',

                               shadowBlur: 10,

                               shadowColor: '#333'

                           }

                       },

                       zlevel: 1

                   }

                 ]

             };

             // if(this.echartsIntance){

             //     console.log("this.echartsIntance:",this.echartsIntance);

             //     this.echartsIntance.hideLoading();

             // }else{

             //     //Do-nothing

             // }

      }else{

          console.log("地图数据加载超时");

      }

   }

 }
ngx-echart地图的更多相关文章
- Echart - 地图散点图(服务网点图)的实现
Echart是百度开发的一个javascript图表库,可以流程运行于pc和移动端,底层依赖轻量级的 Canvas 类库 ZRender. ECharts 提供了常规的折线图,柱状图,散点图,饼图,K ...
- echart地图下钻
需求:展示中国地图,鼠标点击显示对应的省份 在echart的github上下载需要的 地图文件China.js,各个省份的json文件 遇到的问题:直接在浏览器打开报错,跨域问题,用webstrom打 ...
- Echart地图城市用json返回格式
用Echarts中,使用地图的series部分中展示城市如果用json返回数据的话,js不能直接用字符串使用.需要处理一下. php中的部分 json返回的数据 js中获取json信息 用ajax实现 ...
- 百度Echart 地图
使用百度地图做一个全国地图数据分析的功能,如下图 代码 <%@ Page Language="C#" AutoEventWireup="true" Cod ...
- Echart 地图实例
1.地图实例 function func_InEchart() { require.config({ paths: { echarts: '../Scripts/echart2/echarts' }, ...
- echart 地图
<%@ page language="java" import="java.util.*" pageEncoding="utf-8"% ...
- echarts 点击方法总结,点任意一点获取点击数据,在多图联动中用生成标线举例
关于点击(包括左击,双击,右击等)echarts图形任意一点,获取相关的图形数据,尤其是多图,我想部分人遇到这个问题一直很头大.下面我用举例说明,如何在多图联动基础上,我们点击点击任意一个图上任意一点 ...
- Echarts 南海诸岛简图显示位置调整
最近需要echart同时显示海南岛和南海诸岛,开始想寻找南海诸岛的数据,经过查找,这种简图数据是没有的(china.js地图数据一一找过了),下图是echarts的一些示例,没有满足我们的要求 ...
- echarts 点击方法总结,点任意一点获取点击数据,举例说明:在多图联动中点击绘制标线
关于点击(包括左击,双击,右击等)echarts图形任意一点,获取相关的图形数据,尤其是多图,我想部分人遇到这个问题一直很头大.下面我用举例说明,如何在多图联动基础上,我们点击任意一个图上任意一点,在 ...
- canvas实现平面迁徙图
前言 最近在做自己维护的一个可视化工具的时候,在添加基于echart的雷达图的时候,按照echart官网案例写完发现在自己项目中无法正常运行,排查了一番发现是我项目中echart的版本太低.找到问题原 ...
随机推荐
- Django Model 进阶
回顾: 定义 models settings.py激活app才能使用models migrations:版本控制,当更改库表结构时可以处理数据 增删改查 常见Field 模型的价值在于定义数据模型,使 ...
- kaldi的TIMIT实例二
============================================================================ MonoPhone Training & ...
- 准备情人节礼物比写代码难?来看看IT直男给女友们的礼物
今天是情人节,据说IT直男在每个这样弥漫着恋爱气息的日子里都能把礼物送成"辣眼睛"现场,为了反(zheng)驳(shi)这个观点,小编特意走访了网易云的架构师.工程师.产品经理.程 ...
- 第二十二节:Java语言基础-详细讲解位运算符与流程控制语句
位运算符(二进制位运算) 运算符 运算 例子 << 左移 3 << 2 = 12 --> 3 * 2 * 2 =12 >> 右移 3 >> 1 = ...
- OpenStack-Ocata版+CentOS7.6 云平台环境搭建 — 4.镜像服务(glance)
节点配置信息说明: 控制节点:controller: IP:192.168.164.128 hostname&hosts:likeadmin 计算加点:Nova: IP:192.168.164 ...
- 必须熟练的基础linux命令
推荐:命令大全 http://man.linuxde.net/ 重要的几个热键[Tab],[ctrl]-c, [ctrl]-d [Tab]按键---具有『命令补全』不『档案补齐』的功能 [Ctrl]- ...
- Ubuntu18.04 安装 VMwareTools
VMwareTools作用: 1.增强虚拟显卡和硬盘性能.以及同步虚拟机与主机时钟的驱动程序. 2.可以从物理主机直接往虚拟机里面拖文件. 3.鼠标进入虚拟机后可以直接出来,无需按CTRL+ALT才可 ...
- List和ArrayList的区别
List是一个接口,而ListArray是一个类. ListArray继承并实现了List. 所以List不能被构造,但可以向上面那样为List创建一个引用,而ListArray就可以被构造. Lis ...
- JQ获取CKeditor的值
var editor = CKEDITOR.replace("content"); editor.setData(""); alert(CKEDITOR.ins ...
- zookeeper ZAB协议 Follower和leader源码分析
Follower处理逻辑 void followLeader() throws InterruptedException { //... try { //获取leader server QuorumS ...