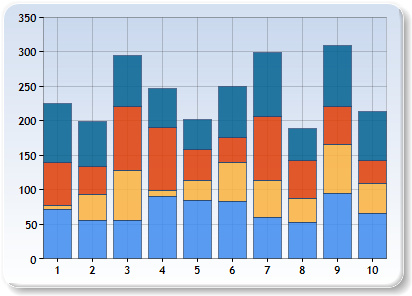
ASP.Net Chart Control -----Bar and Column Charts
| StackedBar | StackedColumn | StackedArea |
 |
 |
 |
<asp:CHART id="Chart1" runat="server" Height="296px" Width="412px" BackColor="#D3DFF0" Palette="BrightPastel"
 BorderlineDashStyle="Solid" BackGradientStyle="TopBottom" BorderWidth="2" BorderColor="26, 59, 105">

                   <legends>

                  <asp:Legend TitleFont="Microsoft Sans Serif, 8pt, style=Bold" BackColor="Transparent" Font="Trebuchet M                                S, 8.25pt, style=Bold" IsTextAutoFit="False" Enabled="False" Name="Default"></asp:Legend>

                            </legends>

                            <borderskin SkinStyle="Emboss"></borderskin>

                            <series>

                                <asp:Series Name="Series1" ChartType="StackedArea100" BorderColor="180, 26, 59, 105" Color="220, 65, 14                                0, 240"></asp:Series>

                                <asp:Series Name="Series2" ChartType="StackedArea100" BorderColor="180, 26, 59, 105" Color="220, 252, 1                                80, 65"></asp:Series>

                                <asp:Series Name="Series3" ChartType="StackedArea100" BorderColor="180, 26, 59, 105" Color="220, 224, 6                                4, 10"></asp:Series>

                                <asp:Series Name="Series4" ChartType="StackedArea100" BorderColor="180, 26, 59, 105" Color="220, 5, 100                                , 146"></asp:Series>

                            </series>

                            <chartareas>

                                <asp:ChartArea Name="ChartArea1" BorderColor="64, 64, 64, 64" BorderDashStyle="Solid" BackSecondaryColor="Transparent" BackColor="64, 165, 191, 228" ShadowColor="Transparent" BackGradientStyle="TopBottom">

                                    <area3dstyle Rotation="10" Inclination="15" WallWidth="0" />

                                    <position Y="3" Height="92" Width="92" X="2"></position>

                                    <axisy LineColor="64, 64, 64, 64"  LabelAutoFitMaxFontSize="8">

                                        <LabelStyle Font="Trebuchet MS, 8.25pt, style=Bold" />

                                        <MajorGrid LineColor="64, 64, 64, 64" />

                                    </axisy>

                                    <axisx LineColor="64, 64, 64, 64"  LabelAutoFitMaxFontSize="8">

                                        <LabelStyle Font="Trebuchet MS, 8.25pt, style=Bold" />

                                        <MajorGrid LineColor="64, 64, 64, 64" />

                                    </axisx>

                                </asp:ChartArea>

                            </chartareas>

                        </asp:CHART>
            // Populate series data

            Random    random = new Random();

            for(int pointIndex = ; pointIndex < ; pointIndex++)

            {

                Chart1.Series["Series1"].Points.AddY(Math.Round((double)random.Next(, ),));

                Chart1.Series["Series2"].Points.AddY(Math.Round((double)random.Next(, ),));

                Chart1.Series["Series3"].Points.AddY(Math.Round((double)random.Next(, ),));

                Chart1.Series["Series4"].Points.AddY(Math.Round((double)random.Next(, ),));

            }

      string chartTypeName == "StackedArea"//"StackedArea100"//"StackedColumn"/"StackedColumn100"/"StackedBar"/"StackedBar100"
Chart1.Series["Series1"].ChartType = (SeriesChartType) Enum.Parse( typeof(SeriesChartType), chartTypeName, true );
Chart1.Series["Series2"].ChartType = (SeriesChartType) Enum.Parse( typeof(SeriesChartType), chartTypeName, true );
Chart1.Series["Series3"].ChartType = (SeriesChartType) Enum.Parse( typeof(SeriesChartType), chartTypeName, true );
Chart1.Series["Series4"].ChartType = (SeriesChartType) Enum.Parse( typeof(SeriesChartType), chartTypeName, true );
ASP.Net Chart Control -----Bar and Column Charts的更多相关文章
- asp.net chart美化+绑定数据--饼图
asp.net chart之饼图 开发环境VS2010 chart控件是vs自带控件 前台: <asp:Chart ID="Chart3" runat="serve ...
- 一款开源且功能强大的C#甘特图控件.NET Winforms Gantt Chart Control
甘特图在项目管理中非常重要,甘特图的思想比较简单,即以图示的方式通过活动列表和时间刻度形象地表示出任何特定项目的活动顺序与持续时间.它直观地表明任务计划在什么时候进行,及实际进展与计划要求的对比.管理 ...
- 解决 ASP.NET Chart 控件出错 为 ChartImg.axd 执行子请求时出错
今天在做一个关于MVC的MSChart时,本以为很简单的一个东西,后面把数据什么的都绑定好后,满以为OK了,一运行就报错“ ASP.NET Chart 控件出错 为 ChartImg.axd ...
- ASP.NET 之 Chart Control for .Net Framework
ps:曾经靠着这张图做了很多的图形报表
- ASP.NET AJAX Control Toolkit
https://ajaxcontroltoolkit.codeplex.com/ 警告 7 未能找到引用的组件“Antlr3.Runtime”. 警告 6 未能找到引用的组件“HtmlAgilityP ...
- Asp.Net MVC Control向View传值
1.通过View(Parameter)参数传值 Control: namespace MyMVCDemo.Controllers { public class PersonControlle ...
- vs2010中安装ASP.NET AJAX Control Toolkit
方法一: 第一步 下载Ajax Control Toolkit 进入网址http://ajaxcontroltoolkit.codeplex.com/ 即可下载 第二步 解压下载下来的Ajax Con ...
- Asp.net web Control Enable 属性设置
最近手上有一个很简单的一个小项目,需要查看编辑的历史记录,先前设计的时候把数据都save 到DB了,现在时间紧迫 就不在画新的UI,而是采用以前的edit页面 来显示数据,这里就需要把页面上所有的co ...
- MS Chart Control 學習手記(二) - 圓餅圖
using System.Web.UI.DataVisualization.Charting; 02 using System.Drawing; 03 04 namespace Chart.AJA ...
随机推荐
- CodeForces 429 B Working out(递推dp)
题目连接:B. Working out 我想了很久都没有想到怎么递推,看了题解后试着自己写,结果第二组数据就 wa 了,后来才知道自己没有判选择的两条路径是否只是一个交点. 大概思路是:先预处理出每个 ...
- 最大的LeftMax与rightMax之差绝对值
这两天去 牛客网 混了下,遇到的几道题都很有意思,尤其是今晚这道,比赛时不会做,后来看了别人的代码才突然想通的,题目链接: 最大的LeftMax与rightMax之差绝对值,大意是: 想了一晚都没想出 ...
- Android 热补丁动态修复框架小结
一.概述 最新github上开源了很多热补丁动态修复框架,大致有: https://github.com/dodola/HotFix https://github.com/jasonross/Nuwa ...
- IoC 之 2.3 IoC的配置使用(叁)
2.3.1 XML配置的结构 一般配置文件结构如下: <beans> <import resource="resource1.xml"/> <bea ...
- 使用Beanstalkd_console
作用:可以将 beanstalkd 的队列信息展示在图形化的操作界面一样,这样不仅给我么查看队列信息有很大的帮助,也可以形象地理解队列任务具体内容 使用操作:(前提条件是前面的队列能正常执行,) 首先 ...
- Windows下快捷键
1.任务管理器ctrl+alt+delete 2.切换任务窗口alt+tab 3.命令行Win+R 命令: {打开任务管理器:taskmgr} {打开远程桌面连接:mstsc} 4.回到桌面Win+D ...
- 33-Url辅助方法
Url辅助方法与HTML辅助方法很类似,HTML辅助方法用来产生HTML标签,而Url辅助方法则负责用来产生Url网址. @Url.Action("About") 最后的输出网址如 ...
- 谈谈JPA-02-HelloWorld
使用JPA持久化对象的步骤 创建 persistence.xml, 在这个文件中配置持久化单元 需要指定跟哪个数据库进行交互; 需要指定 JPA 使用哪个持久化的框架以及配置该框架的基本属性 创建实体 ...
- hdu 4033Regular Polygon(二分+余弦定理)
Regular Polygon Time Limit: 2000/1000 MS (Java/Others) Memory Limit: 65768/65768 K (Java/Others)T ...
- Extjs中处理mouseover的闪烁问题
在使用mouseover和mouseout实现鼠标滑动效果并且target的dom较复杂时,可能会产生闪烁现象,产生这个问题的一个原因是mouseover事件本身的冒泡特性和target dom的子元 ...