可视化---matplotlib
中文乱码
# 解决matplotlib显示中文问题

# 指定默认字体

plt.rcParams[font.sans-serif]=['SimHei']

# 解决保存图像是负号'-'显示为方块的问题

plt.rcParams['axes.unicode_minus']=False
多画布
#add_subplot(first,second,index) first means number of Row,second means number of Column.

import matplotlib.pyplot as plt

fig = plt.figure()

ax1 = fig.add_subplot(3,2,1)

ax2 = fig.add_subplot(3,2,2)

ax2 = fig.add_subplot(3,2,6)

plt.show()
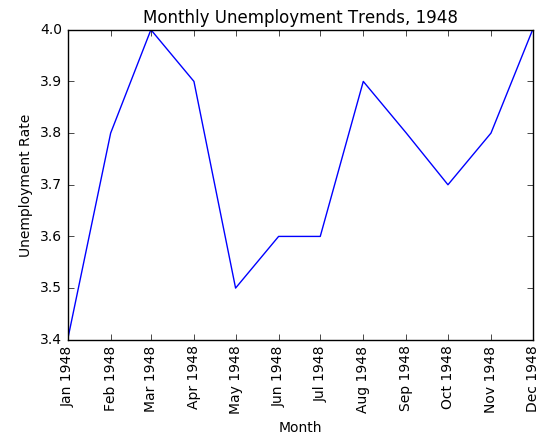
折线图
#xlabel(): accepts a string value, which gets set as the x-axis label.

#ylabel(): accepts a string value, which is set as the y-axis label.

#title(): accepts a string value, which is set as the plot title.

plt.plot(first_twelve['DATE'], first_twelve['VALUE'])

plt.xticks(rotation=90)

plt.xlabel('Month')

plt.ylabel('Unemployment Rate')

plt.title('Monthly Unemployment Trends, 1948')

plt.show()
多条线
unrate['MONTH'] = unrate['DATE'].dt.month

unrate['MONTH'] = unrate['DATE'].dt.month

fig = plt.figure(figsize=(6,3))

plt.plot(unrate[0:12]['MONTH'], unrate[0:12]['VALUE'], c='red')

plt.plot(unrate[12:24]['MONTH'], unrate[12:24]['VALUE'], c='blue')

plt.show()

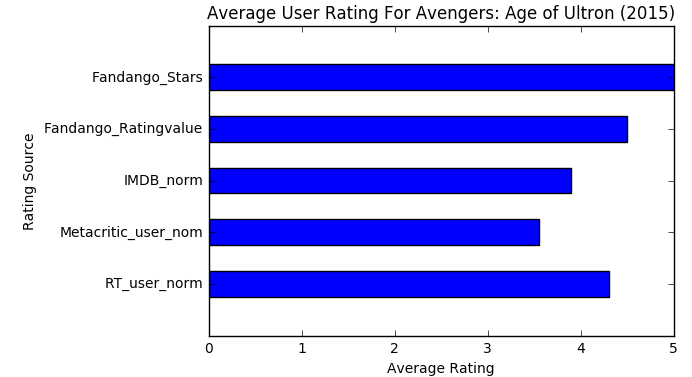
柱状图
import matplotlib.pyplot as plt

from numpy import arange

num_cols = ['RT_user_norm', 'Metacritic_user_nom', 'IMDB_norm', 'Fandango_Ratingvalue', 'Fandango_Stars']

bar_widths = norm_reviews.ix[0, num_cols].values

bar_positions = arange(5) + 0.75

tick_positions = range(1,6)

fig, ax = plt.subplots()

ax.barh(bar_positions, bar_widths, 0.5)

ax.set_yticks(tick_positions)

ax.set_yticklabels(num_cols)

ax.set_ylabel('Rating Source')

ax.set_xlabel('Average Rating')

ax.set_title('Average User Rating For Avengers: Age of Ultron (2015)')

plt.show()
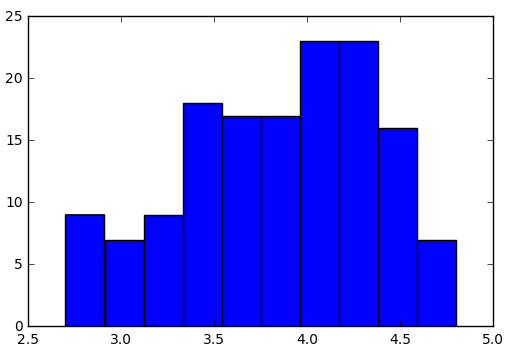
直方图
fig, ax = plt.subplots()

ax.hist(norm_reviews['Fandango_Ratingvalue'])

#ax.hist(norm_reviews['Fandango_Ratingvalue'],bins=20)

#ax.hist(norm_reviews['Fandango_Ratingvalue'], range=(4, 5),bins=20)

plt.show()
柱状图VS直方图
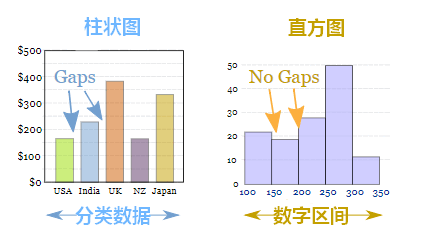
区别:
1.直方图展示数据的分布,柱状图比较数据的大小。
2.直方图X轴为定量数据,柱状图X轴为分类数据。
3.直方图柱子无间隔,柱状图柱子有间隔
散点图
#Switching Axes

fig = plt.figure(figsize=(5,10))

ax1 = fig.add_subplot(2,1,1)

ax2 = fig.add_subplot(2,1,2)

ax1.scatter(norm_reviews['Fandango_Ratingvalue'], norm_reviews['RT_user_norm'])

ax1.set_xlabel('Fandango')

ax1.set_ylabel('Rotten Tomatoes')

ax2.scatter(norm_reviews['RT_user_norm'], norm_reviews['Fandango_Ratingvalue'])

ax2.set_xlabel('Rotten Tomatoes')

ax2.set_ylabel('Fandango')

plt.show()

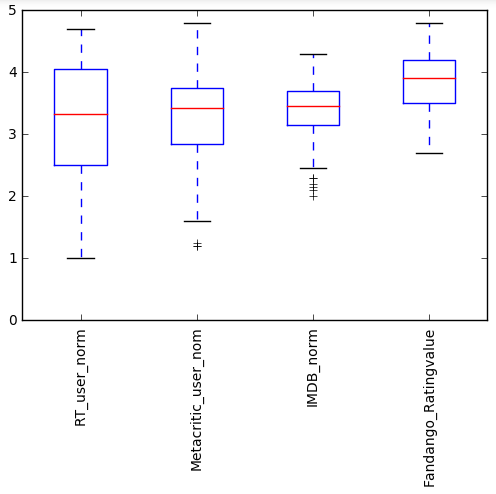
箱线图
num_cols = ['RT_user_norm', 'Metacritic_user_nom', 'IMDB_norm', 'Fandango_Ratingvalue']

fig, ax = plt.subplots()

ax.boxplot(norm_reviews[num_cols].values)

ax.set_xticklabels(num_cols, rotation=90)

ax.set_ylim(0,5)

plt.show()
可视化---matplotlib的更多相关文章
- Python数据可视化matplotlib和seaborn
Python在数据科学中的地位,不仅仅是因为numpy, scipy, pandas, scikit-learn这些高效易用.接口统一的科学计算包,其强大的数据可视化工具也是重要组成部分.在Pytho ...
- python可视化--matplotlib
matplotlib在python中一般会与numpy同时出现,解决一些科学计算和数据的可视化问题. matplotlib其实就是matlib在python中的实现,因此不会有太大的难度,而由于pyt ...
- python 爬虫与数据可视化--matplotlib模块应用
一.数据分析的目的(利用大数据量数据分析,帮助人们做出战略决策) 二.什么是matplotlib? matplotlib: 最流行的Python底层绘图库,主要做数据可视化图表,名字取材于MATLAB ...
- 数据可视化matplotlib、seaborn、pydotplus
如需转发,请注明出处:小婷儿的python https://www.cnblogs.com/xxtalhr/p/10486560.html 一.数据可视化 data.mat 链接:https://p ...
- 数据可视化——Matplotlib(1)
导入相关模块 import matplotlib.pyplot as plt import pandas as pd import numpy as np 基本图表 散点图:scatter N = 1 ...
- Python数据可视化--matplotlib
抽象化|具体化: 如盒形图 | 现实中的图 功能性|装饰性:没有装饰和渲染 | 包含艺术性美学上的装饰 深度表达|浅度表达:深入层次的研究探索数据 | 易于理解的,直观的表示 多维度|单一维度:数据的 ...
- python数据可视化-matplotlib入门(7)-从网络加载数据及数据可视化的小总结
除了从文件加载数据,另一个数据源是互联网,互联网每天产生各种不同的数据,可以用各种各样的方式从互联网加载数据. 一.了解 Web API Web 应用编程接口(API)自动请求网站的特定信息,再对这些 ...
- Python数据可视化Matplotlib——Figure画布背景设置
之前在今日头条中更新了几期的Matplotlib教学短视频,在圈内受到了广泛好评,现应大家要求,将视频中的代码贴出来,方便大家学习. 为了使实例图像显得不单调,我们先将绘图代码贴上来,此处代码对Fig ...
- Python可视化----------matplotlib.pylot
1 >>> import matplotlib.pyplot as plt 2 >>> plt.axis([0,5,0,20]) 3 [0, 5, 0, 20] 4 ...
- 绘图和可视化---matplotlib包的学习
matplotlib API函数都位于matplotlib.pyplot模块,通常引入约定为:import matplotlib.pyplot as plt 1.Figure和Subplot 图像都位 ...
随机推荐
- Django static配置
STATIC_URL = '/static/' # HTML中使用的静态文件夹前缀 STATICFILES_DIRS = [ os.path.join(BASE_DIR, "static&q ...
- django下载
pip install django ==2.0.5 创建目录 1创建目录 2终端下进入目录 3输入django-admin startproject project
- 五、SAP中定义变量和给变量赋值
一.代码如下: 二.执行效果图,如下:
- 1、求loss:tf.reduce_mean(tf.nn.softmax_cross_entropy_with_logits(logits, labels, name=None))
1.求loss: tf.reduce_mean(tf.nn.softmax_cross_entropy_with_logits(logits, labels, name=None)) 第一个参数log ...
- expdp远程导出oracle库
1.手动在本地建目录 E:\lvchengData 2.执行命令 create or replace directory data as 'E:\lvchengData\'; 3.为本地system用 ...
- (BUILDER)建造者与(FACTORY)工厂模式 的比较
首先,说明下 参考博文 1. 建造者 http://www.cnblogs.com/zhili/p/BuilderPattern.html 2. 抽象工厂 http://www ...
- [XSS防御]HttpOnly之四两拨千斤
今天看了<白帽子讲web安全>一书,顺便记录一下,HttpOnly的设置 httponly的设置值为 TRUE 时,使得Javascript无法获取到该值,有效地防御了XSS打管理员的 c ...
- clion之CMakeLists的学习
什么是CMake CMake是一个跨平台的安装(编译)工具,可以用简单的语句来描述所有平台的安装(编译过程).他能够输出各种各样的makefile或者project文件,能测试编译器所支持的" ...
- 哈希表hashTable的Java设计
1:哈希表的概念 2:设计原理 3:哈希表的Java设计
- [转帖西部数据的Zonefs将会登陆Linux 5.6内核]
西部数据的Zonefs将会登陆Linux 5.6内核 https://www.cnbeta.com/articles/tech/948875.htm 据说SMR 能够提高25%的存储密度 但是会造成严 ...