可视化---matplotlib
中文乱码
# 解决matplotlib显示中文问题

# 指定默认字体

plt.rcParams[font.sans-serif]=['SimHei']

# 解决保存图像是负号'-'显示为方块的问题

plt.rcParams['axes.unicode_minus']=False
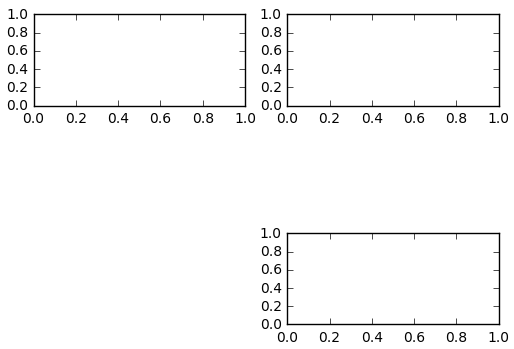
多画布
#add_subplot(first,second,index) first means number of Row,second means number of Column.

import matplotlib.pyplot as plt

fig = plt.figure()

ax1 = fig.add_subplot(3,2,1)

ax2 = fig.add_subplot(3,2,2)

ax2 = fig.add_subplot(3,2,6)

plt.show()
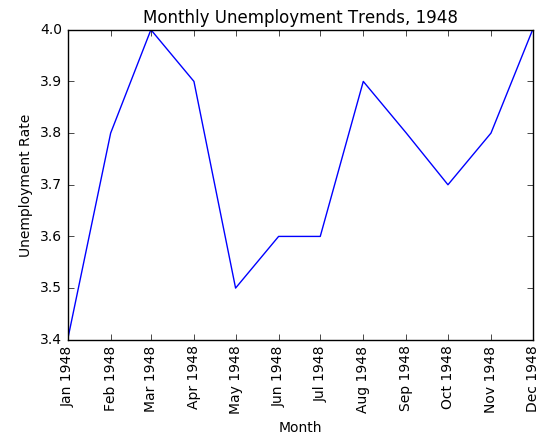
折线图
#xlabel(): accepts a string value, which gets set as the x-axis label.

#ylabel(): accepts a string value, which is set as the y-axis label.

#title(): accepts a string value, which is set as the plot title.

plt.plot(first_twelve['DATE'], first_twelve['VALUE'])

plt.xticks(rotation=90)

plt.xlabel('Month')

plt.ylabel('Unemployment Rate')

plt.title('Monthly Unemployment Trends, 1948')

plt.show()
多条线
unrate['MONTH'] = unrate['DATE'].dt.month

unrate['MONTH'] = unrate['DATE'].dt.month

fig = plt.figure(figsize=(6,3))

plt.plot(unrate[0:12]['MONTH'], unrate[0:12]['VALUE'], c='red')

plt.plot(unrate[12:24]['MONTH'], unrate[12:24]['VALUE'], c='blue')

plt.show()

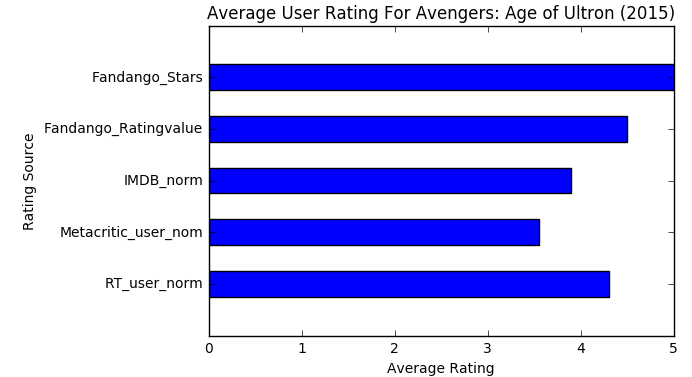
柱状图
import matplotlib.pyplot as plt

from numpy import arange

num_cols = ['RT_user_norm', 'Metacritic_user_nom', 'IMDB_norm', 'Fandango_Ratingvalue', 'Fandango_Stars']

bar_widths = norm_reviews.ix[0, num_cols].values

bar_positions = arange(5) + 0.75

tick_positions = range(1,6)

fig, ax = plt.subplots()

ax.barh(bar_positions, bar_widths, 0.5)

ax.set_yticks(tick_positions)

ax.set_yticklabels(num_cols)

ax.set_ylabel('Rating Source')

ax.set_xlabel('Average Rating')

ax.set_title('Average User Rating For Avengers: Age of Ultron (2015)')

plt.show()
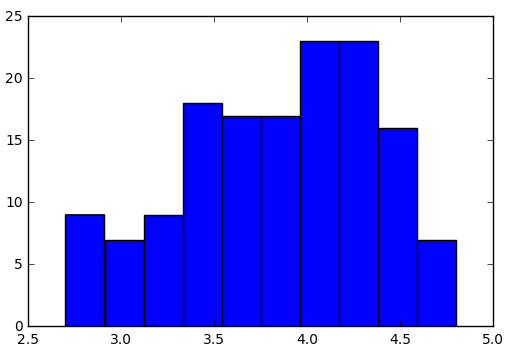
直方图
fig, ax = plt.subplots()

ax.hist(norm_reviews['Fandango_Ratingvalue'])

#ax.hist(norm_reviews['Fandango_Ratingvalue'],bins=20)

#ax.hist(norm_reviews['Fandango_Ratingvalue'], range=(4, 5),bins=20)

plt.show()
柱状图VS直方图
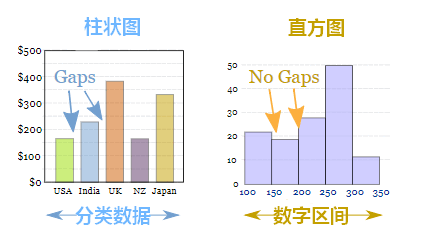
区别:
1.直方图展示数据的分布,柱状图比较数据的大小。
2.直方图X轴为定量数据,柱状图X轴为分类数据。
3.直方图柱子无间隔,柱状图柱子有间隔
散点图
#Switching Axes

fig = plt.figure(figsize=(5,10))

ax1 = fig.add_subplot(2,1,1)

ax2 = fig.add_subplot(2,1,2)

ax1.scatter(norm_reviews['Fandango_Ratingvalue'], norm_reviews['RT_user_norm'])

ax1.set_xlabel('Fandango')

ax1.set_ylabel('Rotten Tomatoes')

ax2.scatter(norm_reviews['RT_user_norm'], norm_reviews['Fandango_Ratingvalue'])

ax2.set_xlabel('Rotten Tomatoes')

ax2.set_ylabel('Fandango')

plt.show()

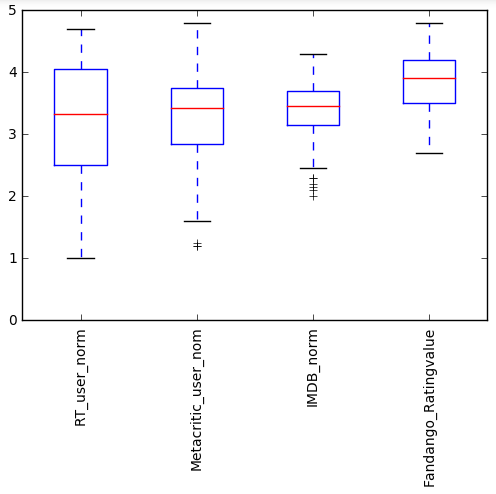
箱线图
num_cols = ['RT_user_norm', 'Metacritic_user_nom', 'IMDB_norm', 'Fandango_Ratingvalue']

fig, ax = plt.subplots()

ax.boxplot(norm_reviews[num_cols].values)

ax.set_xticklabels(num_cols, rotation=90)

ax.set_ylim(0,5)

plt.show()
可视化---matplotlib的更多相关文章
- Python数据可视化matplotlib和seaborn
Python在数据科学中的地位,不仅仅是因为numpy, scipy, pandas, scikit-learn这些高效易用.接口统一的科学计算包,其强大的数据可视化工具也是重要组成部分.在Pytho ...
- python可视化--matplotlib
matplotlib在python中一般会与numpy同时出现,解决一些科学计算和数据的可视化问题. matplotlib其实就是matlib在python中的实现,因此不会有太大的难度,而由于pyt ...
- python 爬虫与数据可视化--matplotlib模块应用
一.数据分析的目的(利用大数据量数据分析,帮助人们做出战略决策) 二.什么是matplotlib? matplotlib: 最流行的Python底层绘图库,主要做数据可视化图表,名字取材于MATLAB ...
- 数据可视化matplotlib、seaborn、pydotplus
如需转发,请注明出处:小婷儿的python https://www.cnblogs.com/xxtalhr/p/10486560.html 一.数据可视化 data.mat 链接:https://p ...
- 数据可视化——Matplotlib(1)
导入相关模块 import matplotlib.pyplot as plt import pandas as pd import numpy as np 基本图表 散点图:scatter N = 1 ...
- Python数据可视化--matplotlib
抽象化|具体化: 如盒形图 | 现实中的图 功能性|装饰性:没有装饰和渲染 | 包含艺术性美学上的装饰 深度表达|浅度表达:深入层次的研究探索数据 | 易于理解的,直观的表示 多维度|单一维度:数据的 ...
- python数据可视化-matplotlib入门(7)-从网络加载数据及数据可视化的小总结
除了从文件加载数据,另一个数据源是互联网,互联网每天产生各种不同的数据,可以用各种各样的方式从互联网加载数据. 一.了解 Web API Web 应用编程接口(API)自动请求网站的特定信息,再对这些 ...
- Python数据可视化Matplotlib——Figure画布背景设置
之前在今日头条中更新了几期的Matplotlib教学短视频,在圈内受到了广泛好评,现应大家要求,将视频中的代码贴出来,方便大家学习. 为了使实例图像显得不单调,我们先将绘图代码贴上来,此处代码对Fig ...
- Python可视化----------matplotlib.pylot
1 >>> import matplotlib.pyplot as plt 2 >>> plt.axis([0,5,0,20]) 3 [0, 5, 0, 20] 4 ...
- 绘图和可视化---matplotlib包的学习
matplotlib API函数都位于matplotlib.pyplot模块,通常引入约定为:import matplotlib.pyplot as plt 1.Figure和Subplot 图像都位 ...
随机推荐
- js基础学习之-js全局对象
声明的三种方式: 第一种: var test; //或var test = 5; 第二种: test = 5; 第三种: window.test; //或window.test = 5; //只是使用 ...
- 基础语法-其它流程控制语句break和continue
基础语法-其它流程控制语句break和continue 作者:尹正杰 版权声明:原创作品,谢绝转载!否则将追究法律责任. 一.break语句 /** * break语句 * @author 尹正杰 * ...
- Java算法练习——整数反转
题目链接 题目描述 给出一个 32 位的有符号整数,你需要将这个整数中每位上的数字进行反转. 备注 注意: 假设我们的环境只能存储得下 32 位的有符号整数,则其数值范围为 $[−2^{31}, 2^ ...
- CSS - 导入Google Web 字体
@import url('http://fonts.googleapis.com/css?family=Poppins:100,200,300,400,500,600,700,800,900'); b ...
- 使用技巧 --- 与VS Code相关
目的:修改VS Code的注释文本颜色 S1:假设VS Code的安装路径是 %MVSC% S2:文件资源管理器进入目录 %MVSC%\resources\app\extensions\ S3:该目录 ...
- Adaboost的python实现
不要总是掉包欧,真的丢人啊,一起码起来! '''函数的功能:单层决策树分类函数参数说明: xMat:数据矩阵 i:第i列,第几个特征 Q:阈值返回分类结果: re'''import numpy as ...
- OpenResty从入门到开发一个网关服务(使用etcd作为注册中心)
简介 OpenResty(也称为 ngx_openresty)是一个全功能的 Web 应用服务器.它打包了标准的 Nginx 核心,很多的常用的第三方模块,以及它们的大多数依赖项. 通过揉和众多设计良 ...
- Aspectj切入点语法定义
例如定义切入点表达式 execution (* com.sample.service.impl..*.*(..)) execution()是最常用的切点函数,其语法如下所示: 整个表达式可以分为五个 ...
- JS/JQUERY函数库
1. 判断字符串是否为空 function isEmptyString(str) { return str == undefined || str == "" || str == ...
- 网格视图GridView
1.常用属性 2.Adapter接口 3.Demo演示 今天观看了GridView的相关视频,并且根据案例,进行了代码的编写和实例 新建GridViewActivity.java继承AppCompat ...