
【matlab 基础篇 03】一文带你全面了解 plot 绘图函数的使用(超详细+图文并茂)
快速入门matlab,系统地整理一遍,如何你和我一样是一个新手,那么此文很适合你;
文章目录
1 前言
如果你是和我一样的小白,强烈推荐看看这里,需要合理地利用官方的文档,通常我觉得官方文档是最好的,没有之一,在命令终端输入help plot,可以看到详细的帮助文档;具体如下;
>> help plot

 plot   Linear plot.

    plot(X,Y) plots vector Y versus vector X. If X or Y is a matrix,

    then the vector is plotted versus the rows or columns of the matrix,

    whichever line up.  If X is a scalar and Y is a vector, disconnected

    line objects are created and plotted as discrete points vertically at

    X.

    plot(Y) plots the columns of Y versus their index.

    If Y is complex, plot(Y) is equivalent to plot(real(Y),imag(Y)).

    In all other uses of plot, the imaginary part is ignored.

    Various line types, plot symbols and colors may be obtained with

    plot(X,Y,S) where S is a character string made from one element

    from any or all the following 3 columns:

           b     blue          .     point              -     solid

           g     green         o     circle             :     dotted

           r     red           x     x-mark             -.    dashdot

           c     cyan          +     plus               --    dashed

           m     magenta       *     star             (none)  no line

           y     yellow        s     square

           k     black         d     diamond

           w     white         v     triangle (down)

                               ^     triangle (up)

                               <     triangle (left)

                               >     triangle (right)

                               p     pentagram

                               h     hexagram

    For example, plot(X,Y,'c+:') plots a cyan dotted line with a plus

    at each data point; plot(X,Y,'bd') plots blue diamond at each data

    point but does not draw any line.

    plot(X1,Y1,S1,X2,Y2,S2,X3,Y3,S3,...) combines the plots defined by

    the (X,Y,S) triples, where the X's and Y's are vectors or matrices

    and the S's are strings.

    For example, plot(X,Y,'y-',X,Y,'go') plots the data twice, with a

    solid yellow line interpolating green circles at the data points.

    The plot command, if no color is specified, makes automatic use of

    the colors specified by the axes ColorOrder property.  By default,

    plot cycles through the colors in the ColorOrder property.  For

    monochrome systems, plot cycles over the axes LineStyleOrder property.

    Note that RGB colors in the ColorOrder property may differ from

    similarly-named colors in the (X,Y,S) triples.  For example, the

    second axes ColorOrder property is medium green with RGB [0 .5 0],

    while plot(X,Y,'g') plots a green line with RGB [0 1 0].

    If you do not specify a marker type, plot uses no marker.

    If you do not specify a line style, plot uses a solid line.

    plot(AX,...) plots into the axes with handle AX.

    plot returns a column vector of handles to lineseries objects, one

    handle per plotted line.

    The X,Y pairs, or X,Y,S triples, can be followed by

    parameter/value pairs to specify additional properties

    of the lines. For example, plot(X,Y,'LineWidth',2,'Color',[.6 0 0])

    will create a plot with a dark red line width of 2 points.

    Example

       x = -pi:pi/10:pi;

       y = tan(sin(x)) - sin(tan(x));

       plot(x,y,'--rs','LineWidth',2,...

                       'MarkerEdgeColor','k',...

                       'MarkerFaceColor','g',...

                       'MarkerSize',10)
与
plot相关的函数还有plottools,semilogx,semilogy,loglog,plotyy,plot3,grid,title,xlabel,ylabel,axis,axes,hold,legend,subplot,scatter.
2 plot
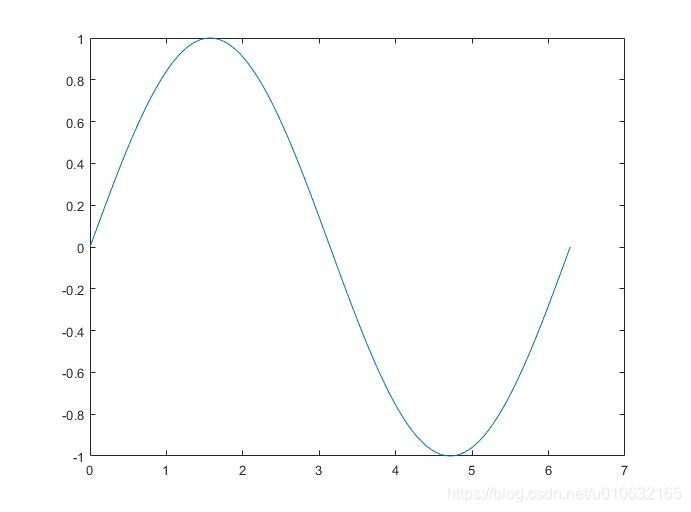
2.1 显示正弦波
显示一个简单的正弦函数;
x=0:2*pi/100:2*pi;

y=sin(x);

plot(x,y);
2.2 修改颜色
| 参数 | 颜色 |
|---|---|
| b | blue |
| g | green |
| r | red |
| c | cyan |
| m | magenta |
| y | yellow |
| k | black |
| w | white |
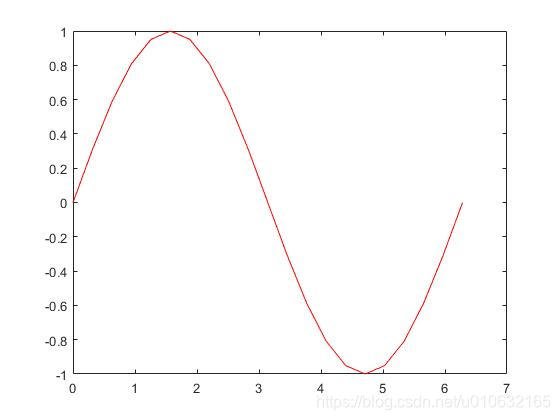
下面修改为红色:
x=0:2*pi/100:2*pi;

y=sin(x);

plot(x,y,'r');
结果如下:
2.3 修改点的形状
| 参数 | 形状 | 图标 |
|---|---|---|
| - | solid | |
o |
circle |  |
x |
x-mark |  |
+ |
plus |  |
* |
star |  |
s |
square |  |
d |
diamond |  |
v |
triangle (down) |  |
^ |
triangle (up) |  |
< |
triangle (left) |  |
> |
triangle (right) |  |
p |
pentagram |  |
h |
hexagram |  |
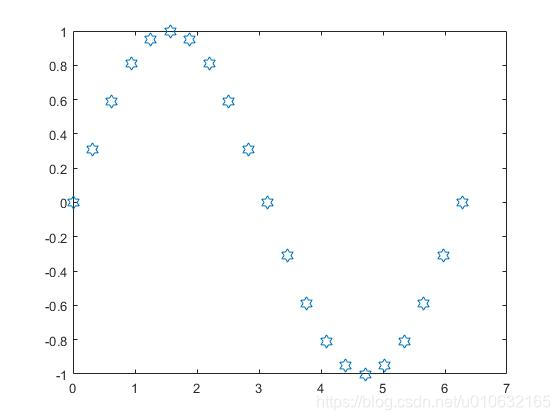
将点形状显示为六边形;
x=0:2*pi/20:2*pi;

y=sin(x);

plot(x,y,'h','MarkerSize',10);
结果如下:
相关参数:
MarkerEdgeColor:点边框颜色;MarkerFaceColor:点表面颜色;MarkerSize:点的大小;
2.4 修改线的形状
| 符号 | 形状 |
|---|---|
: |
dotted |
-. |
dashdot |
-- |
dashed |
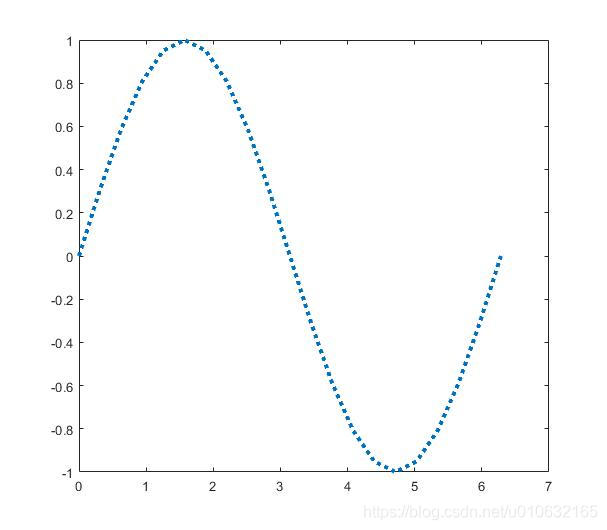
x=0:2*pi/20:2*pi;

y=sin(x);

plot(x,y,':','LineWidth',3);
LineWidth的参数为线宽;
x=0:2*pi/20:2*pi;

y=sin(x);

plot(x,y,'-.','LineWidth',3);
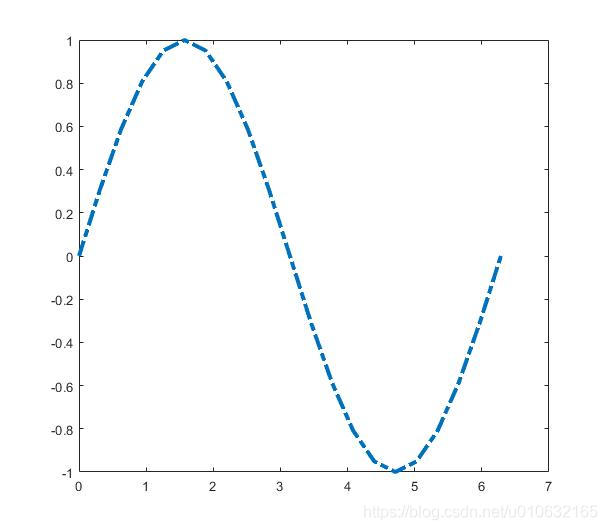
x=0:2*pi/20:2*pi;

y=sin(x);

plot(x,y,'--','LineWidth',3);
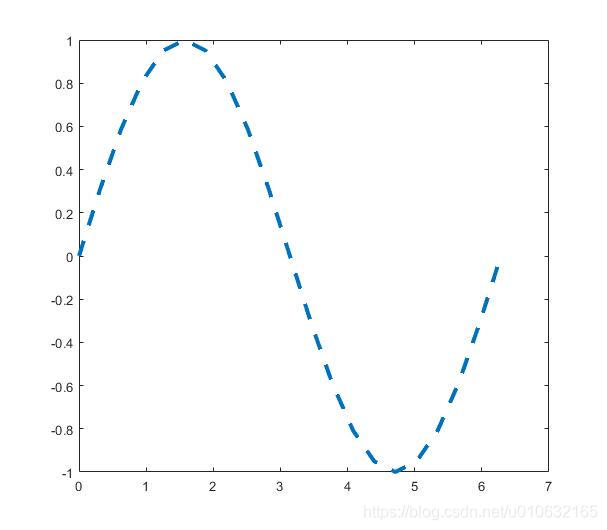
2.5 多个参数修改
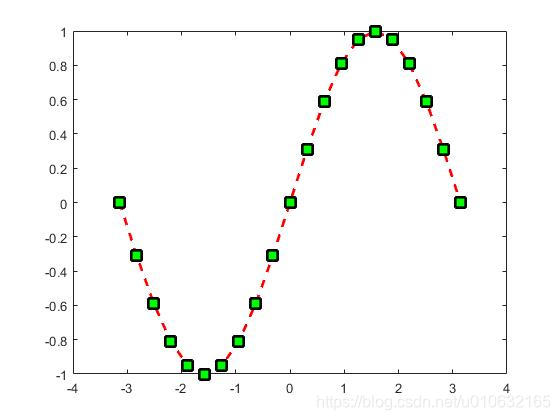
下面修改多个参数属性显示一下正弦波;
x = 0:2*pi/100:2*pi;

y = sin(x);

plot(x,y,'--rs','LineWidth',2,...

                'MarkerEdgeColor','k',...

                'MarkerFaceColor','g',...

                'MarkerSize',10);
结果如下:
3 subplot
subplot的使用方法如下:
 subplot Create axes in tiled positions.

    H = subplot(m,n,p), or subplot(mnp), breaks the Figure window

    into an m-by-n matrix of small axes, selects the p-th axes for

    the current plot, and returns the axes handle.  The axes are

    counted along the top row of the Figure window, then the second

    row, etc.  For example,

        subplot(2,1,1), PLOT(income)

        subplot(2,1,2), PLOT(outgo)
通俗的讲:
subplot(行,列,index)
注意:plot函数要在subplot表明位置之后再调用。
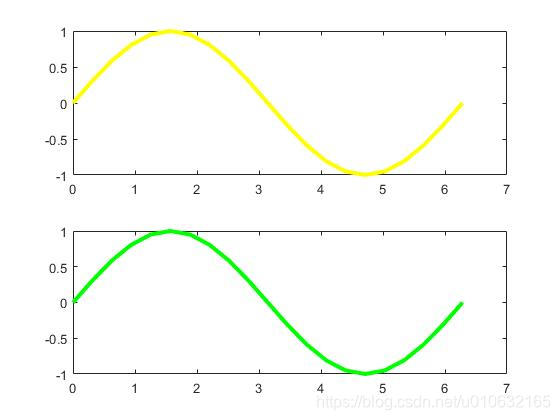
3.1 2行1列
x=0:2*pi/20:2*pi;

y=sin(x);

subplot(2,1,1);

plot(x,y,'y','LineWidth',3);

subplot(2,1,2);

plot(x,y,'g','LineWidth',3);
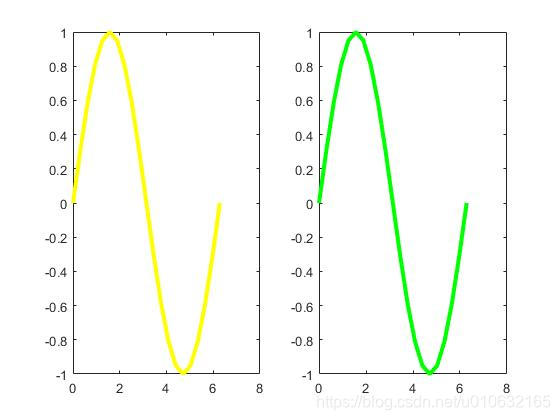
需要将多个波形显示在同一张图中;
3.2 1行2列
x=0:2*pi/20:2*pi;

y=sin(x);

subplot(1,2,1);

plot(x,y,'y','LineWidth',3);

subplot(1,2,2);

plot(x,y,'g','LineWidth',3);
4 plot3
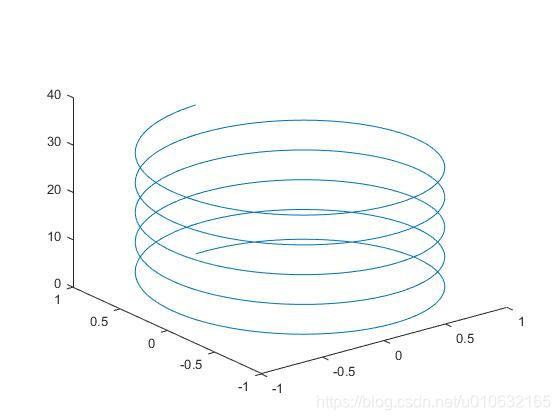
 t = 0:pi/50:10*pi;

 plot3(sin(t),cos(t),t);
5 title
title:图的标题;xlabel:x轴标题;ylabel:y轴标题;
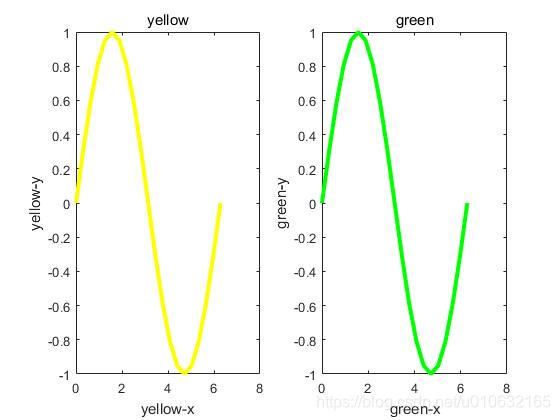
指定plot的标题,需要在plot调用之后在调用title,xlabel或ylabel;
x=0:2*pi/20:2*pi;

y=sin(x);

subplot(1,2,1);

plot(x,y,'y','LineWidth',3);

title('yellow');

xlabel('yellow-x');

ylabel('yellow-y');

subplot(1,2,2);

plot(x,y,'g','LineWidth',3);

title('green');

xlabel('green-x');

ylabel('green-y');
6 legend
x = 0:.2:12;

plot(x,besselj(1,x),x,besselj(2,x),x,besselj(3,x));

legend('First','Second','Third','Location','NorthEastOutside')

b = bar(rand(10,5),'stacked'); colormap(summer); hold on

x = plot(1:10,5*rand(10,1),'marker','square','markersize',12,...

         'markeredgecolor','y','markerfacecolor',[.6 0 .6],...

         'linestyle','-','color','r','linewidth',2); hold off

legend([b,x],'Carrots','Peas','Peppers','Green Beans',...

          'Cucumbers','Eggplant')
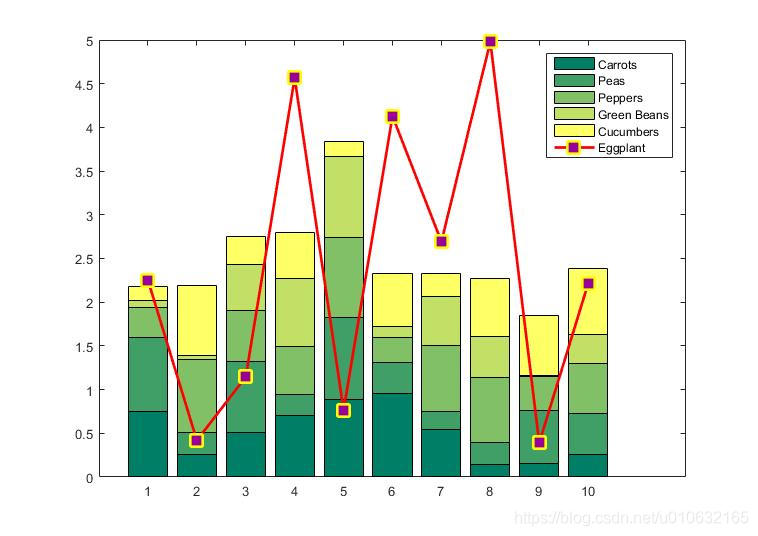
这是官方的demo,比较复杂;
x=0:2*pi/20:2*pi;

y=sin(x);

plot(x,y,':','LineWidth',3);

legend('test1');
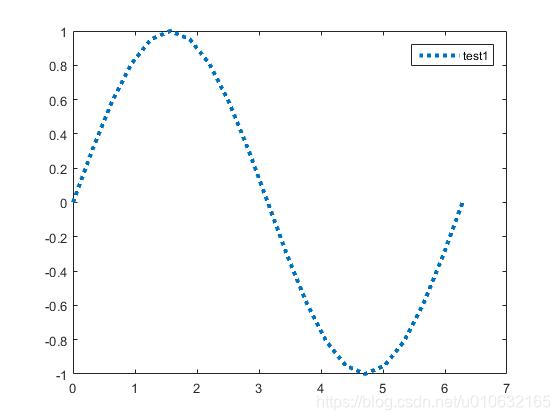
legend需要在plot之后调用,用于依次解释第一个plot的波形,如果一个plot里显示了两个波形,那legen中字符串也需要设置两个,分别依次对应plot中的波形;
7 at last
比较简单,matplotlib的功能和这个比较类似,总体来说,作为一个和博主一样的新手,要多看官方的help文档,然后平时使用的过程中慢慢就熟悉了,最后要多总结。
作者能力有限,文中难免有错误和纰漏之处,请大佬们不吝赐教
创作不易,如果本文帮到了您;
请帮忙点个赞【matlab 基础篇 03】一文带你全面了解 plot 绘图函数的使用(超详细+图文并茂)的更多相关文章
- iOS系列 基础篇 03 探究应用生命周期
iOS系列 基础篇 03 探究应用生命周期 目录: 1. 非运行状态 - 应用启动场景 2. 点击Home键 - 应用退出场景 3. 挂起重新运行场景 4. 内存清除 - 应用终止场景 5. 结尾 本 ...
- 【matlab 基础篇 02】基础知识一键扫盲,看完即可无障碍编程(超详细+图文并茂)
博主快速入门matlab,系统地整理一遍,如何你和我一样是一个新手,那么此文很适合你: 本人能力有限,文中难免有错误和纰漏之处,请大佬们不吝赐教 创作不易,如果本文帮到了您: 请帮忙点个赞
- Java多线程系列--“基础篇”03之 Thread中start()和run()的区别
概要 Thread类包含start()和run()方法,它们的区别是什么?本章将对此作出解答.本章内容包括:start() 和 run()的区别说明start() 和 run()的区别示例start( ...
- WebBug靶场基础篇 — 03
基础篇 6 - 16 关... 在记录之前,先说一件事 = =! 小学生真多 = =!好心提供一个靶场,玩玩就算了,他挂黑页 ?现在好了,以后这个靶场不对外啊!你高兴了?爽了吧? 都是新手过来的,好心 ...
- 【matlab 基础篇 01】快速开始第一个程序(详细图文+文末资源)
快速入门matlab,系统地整理一遍,如何你和我一样是一个新手,那么此文很适合你: 文章目录 1 软件安装 2 打开软件 3 编写程序 3.1 基础步骤 3.2 添加PATH 3.3 命令行模式 4 ...
- Java基础篇(03):流程控制语句,和算法应用
本文源码:GitHub·点这里 || GitEE·点这里 一.分支语句 流程控制语句对任何一门编程语言都是非常重要的,Java中基于流程控制程序执行的不同步骤和代码块. 1.IF条件 IF条件语句会根 ...
- 基础篇:一文讲懂树莓派命令行文本编辑工具Vim的使用
简介 众所周知,在Linux系统下的命令行调试界面,经常会遇到需要文本编辑的情况,而树莓派官方系统默认自带了Nano编辑器,Nano的操作门槛更低,但却不如Vim编辑器方便.Vim编辑器是由早期在Li ...
- C#基础篇03
1:不管是实参还是形参,都在内存中开辟空间. 2:写一个方法,它的功能一定要单一,方法中最忌讳的就是出现提示用户输入的字眼. 3:out参数 如果在一个方法中,返回多个类型相同的值时,可以考虑返回一个 ...
- .NETCore C# 中级篇2-4 一文带你完全弄懂正则表达式
.NETCoreCSharp 中级篇2-4 本节内容为正则表达式的使用 简介 有的时候,你是否有过这种需求:判断一个Ip地址.邮箱.密码规则是否合法.如果让你使用if一类的传统方法进行处理,你肯定会被 ...
随机推荐
- echarts使用笔记
1.解决列文字隔开问题,及文字太长问题解决. yAxis: [ { type : 'category', data : message.data[0].dataone, axisLabel: { in ...
- Redis Linux安装+配置
1.进入指定目录,下载资源(也可本地下载后复制到指定目录) wget http://download.redis.io/releases/redis-5.0.5.tar.gz 2.解压到指定目录 ta ...
- 2. node xlsx的使用
1. 使用xlsx模块 const xlsx = require('xlsx'); //excel async exportexcel() { let arrayData = [ ['姓名', '电话 ...
- [Abp vNext 入坑分享] - 3.简单的用户模块功能开发
一.简要说明 本篇文章开始进行业务模块的开发模拟,借助user模块来进行业务开发,主要是用户相关的基础操作.主要是先使用Users来体验整个开发的流程.主要是先把一个基础流程跑顺利,在这里我并不会过于 ...
- 开发者福利!百问I.MX6ULL裸机文档发布
终于等到你,百问科技近600页的100ask_imx6ull裸机文档发布,已经合并到“嵌入式Linux应用开发完全手册第2版_韦东山全系列视频文档全集.pdf(1222页)”,所有人免费下载学习. 本 ...
- 如何使用IE9浏览器自带开发人员工具捕获网页请求
我们在通过浏览器访问一个网页的时候,有时候会遇到页面不能正常显示,图片不能正常加载的问题. 如果我们需要知道浏览器打开该网页时,网页中每个元素的加载情况.这时,我们便可以借助浏览器自带开发人员工具,来 ...
- java在指定区间内生成随机数
Random对象生成随机数 首先需要导入包含Random的包 import java.util.Random; nextInt(int)方法将生成0~参数之间的随机整数但不包括参数. 例如生成0~99 ...
- 工程师泄露5G核心技术文档 被判有期徒刑三年缓刑四年
2002 年至 2017 年 1 月,黄某瑜就职于中兴通讯公司,担任过射频工程师.无线架构师等职务.2008 年 4 月至 2016 年 10 月,王某就职于中兴通讯公司西安研究所,担任过 RRU 部 ...
- 如何在github上递交高质量的pull request
开源的一大乐趣就是任何人都可以参与其中.试想下一个流行的项目就有你贡献的代码,是一件多么爽的事情!你可以帮助项目健康发展,添加你希望添加的功能,以及修复你发现的BUG. 作为全球最大的开源社区GitH ...
- Cobbler自动装机试验
Cobbler自动装机简介:Cobbler是一个使用Python开发的开源项目,通过将部署系统所涉及的所有服务集中在一起,来提供一个全自动的批量快速建立Linux系统的网络安装环境.Cobbler提供 ...