日志分析工具ELK(三)
目前官网更新特别快,不到半年时间就更新了好几个版本,目前最新的是5.1
以下安装配置使用4.5版本的
https://www.elastic.co/guide/en/kibana/4.5/index.html
Installing Kibana with yum

#yum 安装Kibana

Warning #警告

The repositories set up in this procedure are not compatible with distributions using version 3 of rpm, such as CentOS version 5.

#如果你的系统是rpm版本3或者是centos 5的话存储库是不兼容的

1.Download and install the public signing key:

#下载并安装公共签名的密钥

rpm--import https://packages.elastic.co/GPG-KEY-elasticsearch

2.Create a file named kibana.repo in the /etc/yum.repos.d/ directory with the following contents:

#添加yum源在/etc/yum.repos.d/目录下名字命名为kibana.repo

[kibana-4.5]

name=Kibana repository for 4.5.x packages

baseurl=http://packages.elastic.co/kibana/4.5/centos

gpgcheck=1

gpgkey=http://packages.elastic.co/GPG-KEY-elasticsearch

enabled=1

3.Install Kibana by running the following command:

yum install kibana

Configure Kibana to automatically start during bootup. If your distribution is using the System V version of init (check with ps -p 1), run the following command:

#加入开机自启动,可以使用ps -p 1 查看,如果系统是使用版本init的,使用以下命令

chkconfig --add kibana

4. If your distribution is using systemd, run the following commands instead:

#如果你的发行版使用systemd,运行以下命令

sudo/bin/systemctl daemon-reload

sudo/bin/systemctl enable kibana.service

配置

[root@linux-node1 config]# grep "^[a-Z]" /opt/kibana/config/kibana.yml

server.port: 5601 #端口

server.host: "0.0.0.0" #允许访问主机,建议内网

elasticsearch.url: "http://192.168.230.128:9200" #es的地址

kibana.index: ".kibana"  #索引

systemctl start kibana #启动

netstat -ntpl|grep 5601 #检查

tcp        0      0 0.0.0.0:5601            0.0.0.0:*               LISTEN      6937/node

登陆IP加端口http://192.168.230.128:5601

创建索引

模式允许您使用*通配符定义动态索引名称。例子:logstash - *

下面是es-error-*

点击Discover【发现】默认是最后十五分钟,我们把它改为今天

现在我们点击开看到的事件是一个完整的
Logstash收集Nginx日志
centos7系统库中默认是没有nginx的rpm包的,所以我们自己需要先更新下rpm依赖库
(1)使用yum安装nginx需要包括Nginx的库,安装Nginx的库
#rpm -Uvh http://nginx.org/packages/centos/7/noarch/RPMS/nginx-release-centos-7-0.el7.ngx.noarch.rpm
(2)使用下面命令安装nginx
#yum install nginx
(3)启动Nginx
#service nginx start
或
#systemctl start nginx.service 运行日志用json格式输出
#http段加如下信息(日志位置根据业务自行调整) #nginx配置文件
[root@linux-node1 nginx]# cat nginx.conf user nginx;
worker_processes 1; error_log /var/log/nginx/error.log warn;
pid /var/run/nginx.pid; events {
worker_connections 1024;
} http {
include /etc/nginx/mime.types;
default_type application/octet-stream; log_format main '$remote_addr - $remote_user [$time_local] "$request" '
'$status $body_bytes_sent "$http_referer" '
'"$http_user_agent" "$http_x_forwarded_for"';
log_format json '{ "@timestamp": "$time_iso8601", '#在http段添加json格式的日志
'"@version": "1",'
'"client": "$remote_addr", '
'"url": "$uri", '
'"status": "$status", '
'"domain": "$host", '
'"host": "$server_addr", '
'"size": "$body_bytes_sent", '
'"responsetime": "$request_time", '
'"referer": "$http_referer",'
'"ua": "$http_user_agent"'
'}';
#access_log /var/log/nginx/access.log main; #将原有的注释 sendfile on;
#tcp_nopush on; keepalive_timeout 65; #gzip on; include /etc/nginx/conf.d/*.conf;
} [root@linux-node1 conf.d]# cat default.conf
server {
listen 80;
server_name localhost; #charset koi8-r;
#access_log /var/log/nginx/log/host.access.log main; #注释原有的
access_log /var/log/nginx/access_json.log json;#在server段添加日志格式
location /{
root /usr/share/nginx/html;
index index.html index.htm;
} #刷新nginx,就已经有日志了
[root@linux-node1 conf.d]# cd /var/log/nginx/
[root@linux-node1 nginx]# ls
access_json.log access_json.log-20170210 error.log #tail -f access_json.log 查看到的日志格式如下 {"@timestamp":"2017-02-11T09:53:38+08:00","@version":"","client":"192.168.230.1","url":"/index.html","status":"","domain":"192.168.230.128","host":"192.168.230.128","size":"","responsetime":"0.000","referer":"-","ua":"Mozilla/5.0 (Windows NT 10.0; Win64; x64) AppleWebKit/537.36 (KHTML, like Gecko) Chrome/51.0.2704.79 Safari/537.36 Edge/14.14393"} #检查并重新启动
[root@linux-node1 ~]# nginx -t
nginx: the configuration file /etc/nginx/nginx.conf syntax is ok
nginx: configuration file /etc/nginx/nginx.conf test is successful
[root@linux-node1 ~]# service nginx restart
Redirecting to /bin/systemctl restart nginx.service #先来测试一下
[root@linux-node1 ~]# cat json.conf
input { file{
type=>"access_nginx"
path =>"/var/log/nginx/access_json.log"
codec =>"json"
}
} output {
stdout {
codec=>"rubydebug"
}
} #运行,刷新访问nginx的地址http://192.168.230.128 ,让其生成日志,然后屏幕有输出就表示正常
/opt/logstash/bin/logstash -f json.conf [root@linux-node1 conf.d]# cat all.conf
input{
syslog {
type=>"system-syslog"
host =>"192.168.230.128"
port =>""
}
file{#增加的内容
path =>"/var/log/nginx/access_json.log"
codec => json
start_position =>"beginning"
type=>"nginx-log"
} file{
path =>"/var/log/messages"
type=>"system"
start_position =>"beginning"
}
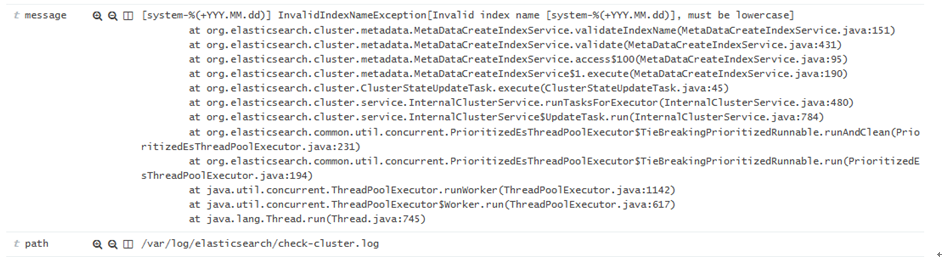
file{
path =>"/var/log/elasticsearch/check-cluster.log"
type=>"es-error"
start_position =>"beginning"
codec => multiline {
pattern =>"^\["
negate => true
what =>"previous"
}
}
}
output{
if[type]=="system"{
elasticsearch {
hosts =>["192.168.230.128:9200"]
index =>"system-%{+YYY.MM.dd}"
}
}
if[type]=="es-error"{
elasticsearch {
hosts =>["192.168.230.128:9200"]
index =>"es-error-%{+YYY.MM.dd}" }
}
if[type]=="system-syslog"{
elasticsearch {
hosts =>["192.168.230.128:9200"]
index =>"system-syslog-%{+YYY.MM.dd}"
}
}
if[type]=="nginx-log"{#增加的内容
elasticsearch {
hosts =>["192.168.230.128:9200"]
index =>"nginx-log-%{+YYY.MM.dd}" }
}
}
点击连接,数据浏览

Kibana上添加展示,点击Settings 添加

添加完再点击Discover 选择nginx-log* ,日期选择今天,也可以选择15分钟前

Logstash收集syslog日志
#Input plugins,输入插件,找到syslog

https://www.elastic.co/guide/en/logstash/2.3/input-plugins.html

系统日志,网络设备日志都可以收集

我们先来测试一下,工作环境我们是先测试好,然后整合到一个配置文件中

[root@linux-node1 ~]# cat syslog.conf

input {

 syslog {

type=>"systcm-syslog"

    host =>"192.168.230.128"

    port =>""

}

}

output {

 stdout {

    codec =>"rubydebug"

}

}

然后

/opt/logstash/bin/logstash  -f syslog.conf

[root@linux-node1 ~]# netstat -ntpl|grep514

tcp6       00192.168.230.128:514:::*                    LISTEN      2998/java

修改配置文件

/etc/rsyslog.conf文件

[root@linux-node1 ~]# tail -2/etc/rsyslog.conf

*.*@@192.168.230.128:514#所有日志,所有级别

# ### end of the forwarding rule ###

打开另一个窗口重启,那边就收到就对了

[root@linux-node1 ~]# systemctl restart rsyslog

打开另外一个窗口测试发送hehe

[root@linux-node1 ~]# logger "hehe"
查看显示如下,说明已经OK

测试完成我们再把它添加到all.conf文件中
[root@linux-node1 ~]# cat all.conf

input{

  syslog {  #添加的syslog

type=>"system-syslog"

    host =>"192.168.230.128"

    port =>""

}

file{

     path =>"/var/log/messages"

type=>"system"

     start_position =>"beginning"

}

file{

     path =>"/var/log/elasticsearch/check-cluster.log"

type=>"es-error"

     start_position =>"beginning"

        codec => multiline {

           pattern =>"^\["

           negate => true

           what =>"previous"

}

}

}

output{

if[type]=="system"{

    elasticsearch {

        hosts =>["192.168.230.128:9200"]

        index =>"system-%{+YYY.MM.dd}"

}

}

if[type]=="es-error"{

        elasticsearch {

                hosts =>["192.168.230.128:9200"]

                index =>"es-error-%{+YYY.MM.dd}"

}

}

if[type]=="system-syslog"{ #添加的system-syslog

        elasticsearch {

                hosts =>["192.168.230.128:9200"]

                index =>"system-syslog-%{+YYY.MM.dd}"

}

}

}
登录Elasticsearch

登录Kibana
Settings -->+Add news添加索引system-syslog*然后create创建

点击Discover选择刚才创建的索引,日期选择Today

测试输入sisi

[root@linux-node1 ~]# logger "sisi"

[root@linux-node1 ~]# logger "sisi"
在Kibana中搜索关键字就可以找到

日志分析工具ELK(三)的更多相关文章
- 日志分析工具ELK配置详解
日志分析工具ELK配置详解 一.ELK介绍 1.1 elasticsearch 1.1.1 elasticsearch介绍 ElasticSearch是一个基于Lucene的搜索服务器.它提供了一个分 ...
- 日志分析工具ELK(五)
八.Kibana实践 选择绝对时间和相对时间 搜索 还可以添加相关信息 自动刷新页面时间,也可以关闭 创建图像,可视化 编辑Markdown,创建一个值班联系表 值班联系表 保存 再创建一个饼图;查看 ...
- 日志分析工具ELK(一)
一.ELK介绍 1.1 elasticsearch 1.1.1 elasticsearch介绍 ElasticSearch是一个基于Lucene的搜索服务器.它提供了一个分布式多用户能力的全文搜索引擎 ...
- 日志分析工具ELK(二)
五.Logstash日志收集实践 在学习Logstash之前,我们需要先了解以下几个基本概念: logstash收集日志基本流程: input-->codec-->filter--> ...
- 日志分析工具ELK(四)
Logstash收集TCP日志 #Input plugins TCP插件 所需的配置选项 tcp { port =>... } [root@linux-node1 ~]# cat tcp.con ...
- GoAccess日志分析工具使用文档
----Sevck 2016/3/4 17:24:13 #1软件说明: GoAccess是一款开源.实时,运行在命令行终端下的web日志分析工具.该工具提供快速.多样的HTTP状态统计,可以令管理员不 ...
- Linux 日志分析工具之awstats
一.awstats 是什么 官方网站:AWStats is a free powerful and featureful tool that generates advanced web, strea ...
- Eventlog Analyzer日志管理系统、日志分析工具、日志服务器的功能及作用
Eventlog Analyzer日志管理系统.日志分析工具.日志服务器的功能及作用 Eventlog Analyzer是用来分析和审计系统及事件日志的管理软件,能够对全网范围内的主机.服务器.网络设 ...
- 集中式日志分析平台 - ELK Stack - 安全解决方案 X-Pack
大数据之心 关注 0.6 2017.02.22 15:36* 字数 2158 阅读 16457评论 7喜欢 9 简介 X-Pack 已经作为 Elastic 公司单独的产品线,前身是 Shield, ...
随机推荐
- 用全站 CDN 部署 Discourse 论坛
Discourse 介绍 Discourse 是一款由 Stack Overflow 的联合创始人--Jeff Atwood,基于 Ruby on Rails 开发的开源论坛.相较于传统论坛,Disc ...
- MapReduce( map的使用)
MapReduce Description MapReduce是Google提出的一个软件架构,用于大规模数据集(大于1TB)的并行运算.概念"Map(映射)"和"Red ...
- 新手必学linux文本文件编辑命令 vi vim.....
作为一名Linux新手小白,今天就和大家简单地了解一下Linux的Vim文本编辑器的使用. Vim文本编辑器 vim编辑器的三大模式——命令模式.编辑模式和末行模式 命令 ...
- iOS开发 - 循环滚动的ScrollView
源码在这里,请多多指教. 由于开发需要,要用到循环自动滚动的scrollView,借鉴了前人的思路,重新设计了一个AutoSlideScrollView.先自吹自擂一翻吧: 借鉴UITableView ...
- SSM项目启动的三种方式
SSM整合Maven项目的三种启动方式 项目部署如图: 1.从父工程的的tomcat插件中直接启动 2.从web子工程的tomcat插件中启动,(需要先执行父工程的install) 如果没有执行父工程 ...
- 认识STM32芯片
STM32中的ST指的是意法半导体,M是Microelectronics的缩写,32表示32位,即意法半导体公司开发的32位微控制器 ST官网:https://www.st.com/content/s ...
- Redis 笔记(三)—— LIST 常用命令
常用命令 命令 用例和描述 RPUSH RPUSH key value [value ...] —— 将一个或多个值推入列表的右端 LPUSH LPUSH key value [value ...] ...
- CF632(div.2)C. Eugene and an array
https://codeforces.ml/contest/1333/problem/C 大概题意是规定和为0的数组为不合格数组,询问给定数组中共有多少个合格子数组. 解题 子数组的数量 一个长度为 ...
- docker-compose中redis查询版本
1.查询CONTAINER ID docker ps 2.进入容器,查询版本号信息 docker exec -it CONTAINER ID /bin/bash 3.查询到redis中的redis-s ...
- Tcl编程第一天,helloworld
#!/usr/bin/tclsh puts "hello world" 注意:第一行代码表示的是tcl程序运行所需要的文件位置 puts函数代表输出