异常值(outlier)
- 简介
在数据挖掘的过程中,我们可能会经常遇到一些偏离于预测趋势之外的数据,通常我们称之为异常值。
通常将这样的一些数据的出现归为误差。有很多情况会出现误差,具体的情况需要就对待:
传感器故障 -> 忽略
数据输入错误 -> 忽略
反常事件 -> 重视
- 异常值检测/删除算法
1、训练数据
2、异常值检测,找出训练集中访问最多的点,去除这些点(一般约10%的异常数据)
3、再训练
需要多次重复2、3步骤
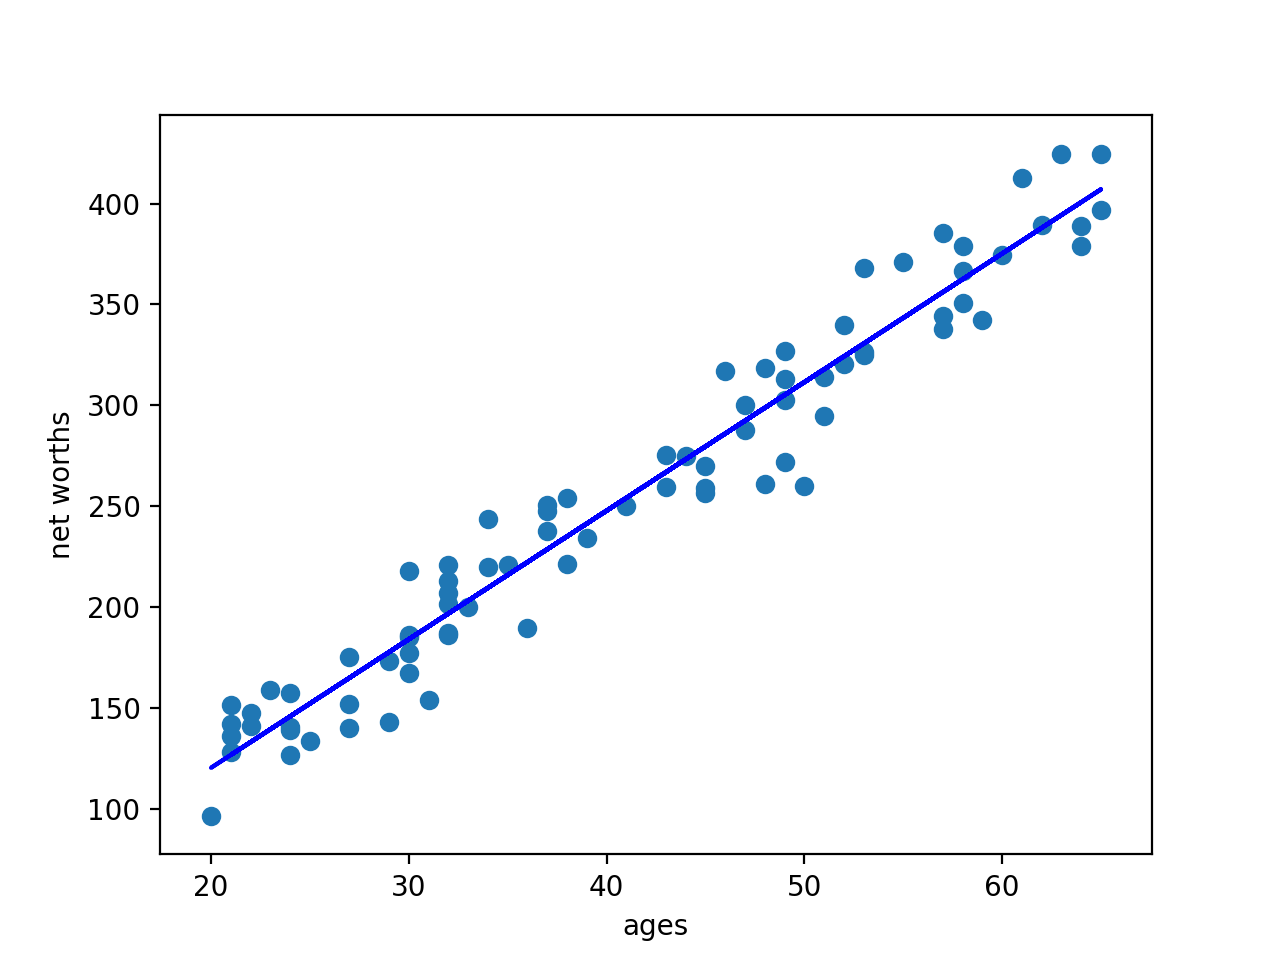
例:对数据第一次使用回归后的拟合

误差点的出现使拟合线相对偏离,将误差点去除后进行一次回归:

去除误差点后的回归线很好的对数据进行了拟合
- 代码实现
环境:MacOS mojave 10.14.3
Python 3.7.0
使用库:scikit-learn 0.19.2
原始数据集:

对原始数据进行一次回归:

删除10%的异常值后进行一次回归:
outlier_removal_regression.py 主程序
#!/usr/bin/python

import random

import numpy

import matplotlib.pyplot as plt

import pickle

from outlier_cleaner import outlierCleaner

class StrToBytes:

    def __init__(self, fileobj):

        self.fileobj = fileobj

    def read(self, size):

        return self.fileobj.read(size).encode()

    def readline(self, size=-1):

        return self.fileobj.readline(size).encode()

### load up some practice data with outliers in it

ages = pickle.load(StrToBytes(open("practice_outliers_ages.pkl", "r") ) )

net_worths = pickle.load(StrToBytes(open("practice_outliers_net_worths.pkl", "r") ) )

### ages and net_worths need to be reshaped into 2D numpy arrays

### second argument of reshape command is a tuple of integers: (n_rows, n_columns)

### by convention, n_rows is the number of data points

### and n_columns is the number of features

ages       = numpy.reshape( numpy.array(ages), (len(ages), 1))

net_worths = numpy.reshape( numpy.array(net_worths), (len(net_worths), 1))

from sklearn.cross_validation import train_test_split

ages_train, ages_test, net_worths_train, net_worths_test = train_test_split(ages, net_worths, test_size=0.1, random_state=42)

### fill in a regression here!  Name the regression object reg so that

### the plotting code below works, and you can see what your regression looks like

from sklearn import linear_model

reg = linear_model.LinearRegression()

reg.fit(ages_train,net_worths_train)

print (reg.coef_)

print (reg.intercept_)

print (reg.score(ages_test,net_worths_test) )

try:

    plt.plot(ages, reg.predict(ages), color="blue")

except NameError:

    pass

plt.scatter(ages, net_worths)

plt.show()

### identify and remove the most outlier-y points

cleaned_data = []

try:

    predictions = reg.predict(ages_train)

    cleaned_data = outlierCleaner( predictions, ages_train, net_worths_train )

except NameError:

    print ("your regression object doesn't exist, or isn't name reg")

    print ("can't make predictions to use in identifying outliers")

### only run this code if cleaned_data is returning data

if len(cleaned_data) > 0:

    ages, net_worths, errors = zip(*cleaned_data)

    ages       = numpy.reshape( numpy.array(ages), (len(ages), 1))

    net_worths = numpy.reshape( numpy.array(net_worths), (len(net_worths), 1))

    ### refit your cleaned data!

    try:

        reg.fit(ages, net_worths)

        plt.plot(ages, reg.predict(ages), color="blue")

        print (reg.coef_)

        print (reg.intercept_)

        print (reg.score(ages_test,net_worths_test) )

    except NameError:

        print ("you don't seem to have regression imported/created,")

        print ("   or else your regression object isn't named reg")

        print ("   either way, only draw the scatter plot of the cleaned data")

    plt.scatter(ages, net_worths)

    plt.xlabel("ages")

    plt.ylabel("net worths")

    plt.show()

else:

    print ("outlierCleaner() is returning an empty list, no refitting to be done")
outlier_cleaner.py 清除10%的异常值
import numpy as np

import math

def outlierCleaner(predictions, ages, net_worths):

    """

        Clean away the 10% of points that have the largest

        residual errors (difference between the prediction

        and the actual net worth).

        Return a list of tuples named cleaned_data where

        each tuple is of the form (age, net_worth, error).

    """

    cleaned_data = []

    ages = ages.reshape((1,len(ages)))[0]

    net_worths = net_worths.reshape((1,len(ages)))[0]

    predictions = predictions.reshape((1,len(ages)))[0]

    # zip() 函数用于将可迭代的对象作为参数,将对象中对应的元素打包成一个个元组,然后返回由这些元组组成的列表。

    cleaned_data = zip(ages,net_worths,abs(net_worths-predictions))

    #按照error大小排序

    cleaned_data = sorted(cleaned_data , key=lambda x: (x[2]))

    #ceil() 函数返回数字的上入整数,计算要删除的元素个数

    cleaned_num = int(-1 * math.ceil(len(cleaned_data)* 0.1))

    #切片

    cleaned_data = cleaned_data[:cleaned_num]

    return cleaned_data
同时得到这两次回归的拟合优度:
第一次:0.8782624703664675
第二次:0.983189455395532
可见,去除异常值对于预测数据具有重要作用
异常值(outlier)的更多相关文章
- python异常值(outlier)检测实战:KMeans + PCA + IsolationForest + SVM + EllipticEnvelope
机器学习_深度学习_入门经典(博主永久免费教学视频系列) https://study.163.com/course/courseMain.htm?courseId=1006390023&sha ...
- SD与SE的关系,以及异常值
很多刚进入实验室的同学对实验数据的标准差(SD)与标准误(SE)的含义搞不清,不知道自己的数据报告到底该用SD还是SE.这里对这两个概念进行一些介绍. 标准差(SD)强调raw data的Variat ...
- (转)Decision Tree
Decision Tree:Analysis 大家有没有玩过猜猜看(Twenty Questions)的游戏?我在心里想一件物体,你可以用一些问题来确定我心里想的这个物体:如是不是植物?是否会飞?能游 ...
- 平均值(Mean)、方差(Variance)、标准差(Standard Deviation) (转)
http://blog.csdn.net/xidiancoder/article/details/71341345 平均值 平均值的概念很简单:所有数据之和除以数据点的个数,以此表示数据集的平均大小: ...
- [译]用R语言做挖掘数据《六》
异常值检测 一.实验说明 1. 环境登录 无需密码自动登录,系统用户名shiyanlou,密码shiyanlou 2. 环境介绍 本实验环境采用带桌面的Ubuntu Linux环境,实验中会用到程序: ...
- 支持向量机SVM、优化问题、核函数
1.介绍 它是一种二类分类模型,其基本模型定义为特征空间上的间隔最大的线性分类器,即支持向量机的学习策略便是间隔最大化,最终可转化为一个凸二次规划问题的求解. 2.求解过程 1.数据分类—SVM引入 ...
- 【Udacity】数据的差异性:值域、IQR、方差和标准差
一.值域(Range) Range = Max - Min 受异常值(Outliers)影响 二.四分位差(IQR) 四分位距(interquartile range, IQR),又称四分差.是描述统 ...
- 用随机森林分类器和GBDT进行特征筛选
一.决策树(类型.节点特征选择的算法原理.优缺点.随机森林算法产生的背景) 1.分类树和回归树 由目标变量是离散的还是连续的来决定的:目标变量是离散的,选择分类树:反之(目标变量是连续的,但自变量可以 ...
- opencv之SURF图像匹配
1.概述 前面介绍模板匹配的时候已经提到模板匹配时一种基于灰度的匹配方法,而基于特征的匹配方法有FAST.SIFT.SURF等.上面两篇文章已经介绍过使用Surf算法进行特征点检測以及使用暴力匹配(B ...
- ML-软间隔(slack)的 SVM
Why Slack? 为了处理异常值(outlier). 前面推导的svm形式, 是要求严格地全部分对, 基于该情况下, 在margin 的边界线 线上的点, 只能是支持向量. \(min_w \ \ ...
随机推荐
- 2019-03-28 git github SSH配置,上传下载操作
1.通过git获取scrapy源码,并安装到系统里面 https://git-scm.com/download/win 下载无脑安装啊(C:\Program Files\Git),进入git bash ...
- SpringBoot-CommandLineRunner实现预操作
前提:在使用SpringBoot构建项目时,我们通常需要做一些预先操作(类似开机自启动).而SpringBoot正好提供了一个简单的方式来实现–CommandLineRunner. CommandLi ...
- 00074_Array类
1.Array类的概述 此类包含用来操作数组(比如排序和搜索)的各种方法.需要注意,如果指定数组引用为 null,则访问此类中的方法都会抛出空指针异常NullPointerException. 2.常 ...
- HDU 3886
一开始又往打表想了....不过,打表确实不好处理,转DFS. DFS有几个要注意的问题,1.对于枚举以零开始的数.我纠结了很久,最终学习别人的方法,设一个BOOL,并且假设最高一位有零,很方便.2.当 ...
- 9.9递归和动态规划(八)——给定数量不限的硬币,币值为25分,10分,5分,1分,计算n分有几种表示法
/** * 功能:给定数量不限的硬币.币值为25分,10分.5分.1分,计算n分有几种表示法. */ public static int makeChange(int n){ return make ...
- bzoj3713: [PA2014]Iloczyn(乱搞)
3713: [PA2014]Iloczyn 题目:传送门 题解: 随手一发水题x2 直接离线啊,斐波那契到了第五十个就炒鸡大了 代码: #include<cstdio> #include& ...
- poj--3630--Phone List(字典树+前缀判断)
Phone List Time Limit: 1000MS Memory Limit: 65536KB 64bit IO Format: %I64d & %I64u Submit St ...
- Java RTTI(类型信息)(.class 类对象)
RTTI:Run-Time Type Information,关键词在 Run-Time,运行时的,而非编译期确定的关于类型的信息.运行时的类型信息(RunTime Type Information) ...
- DB-MySQL:MySQL 教程
ylbtech-DB-MySQL:MySQL 教程 1.返回顶部 1. MySQL 教程 MySQL 是最流行的关系型数据库管理系统,在WEB应用方面 MySQL 是最好的RDBMS(Relation ...
- query.setFirstResult解析
转自:https://blog.csdn.net/thinkingcao/article/details/78053622