
js封装成插件-------Canvas统计图插件编写
之前就说过,我想写一个canvas画统计图的插件,现在写好了
先说下实现的功能吧:
1.可以通过自定义X轴坐标属性和Y轴坐标属性按比例画出统计图
2.可以选择画折现图还是柱形统计图,或者两者都实现
3.可以自由定义折现颜色,坐标颜色,柱形图颜色 和canvas边框颜色,当然边框你也可以选择要或者不要
4.可以选择是否实现柱形图和折现图的动画实现
实现过程
画坐标——画箭头——做X轴和Y轴的标注——画柱形图——画折现图
 (function(window,document){

     var ChartDraws = function(options){

         if(!(this instanceof ChartDraws))return new ChartDraws(options);

         this.options = $.extend({

             //报表所需的参数

             "containerId" : "",       //canvas所在容器id

             "canvasWidth" : 400,

             "canvasHeight" : 300,

             "paddingLeft" : 20,

             "paddingTop" : 20,

             "columnChartData" :[],   //柱形图的数量和对应得名称以及百分比

             "yChartData" :[],           //y轴的数量及名称

             "axisColor" : "white",      //坐标轴颜色

             "columnChartColor" : "#EEE685", //柱形图颜色

             "isNeedAnimation" : true, //是否需要动画

             "isNeedLineChart" : true,  //是否需要折线图

             "isNeedColumnChart" : true, //是否需要柱形图

             "lineChartColor" : "#90EE90", //折线图颜色,当isNeedLineChart=true时有效

             "isNeedBorder" : false,     //canvas是否需要外边框

             "borderColor" : "white"     //外边框颜色

         },options);

         if(this.options.canvasWidth<=500)

         {

             this.axisBorderWidth = 3;

             this.fontSize = 8;

         }

         else if(this.options.canvasWidth<=800){

             this.axisBorderWidth = 4;

             this.fontSize = 12;

         }

         else{

             this.axisBorderWidth = 5;

             this.fontSize = 16;

         }

         var self = this;

         _init();

         function _init(){

             var canvasDom = document.createElement("canvas");

             canvasDom.id = self.options.containerId+"_"+"canvas";

             canvasDom.width = self.options.canvasWidth;

             canvasDom.height = self.options.canvasHeight;

             if(self.options.isNeedBorder){

                 canvasDom.style.borderWidth = 1;

                 canvasDom.style.borderStyle = "solid";

                 canvasDom.style.borderColor = self.options.borderColor;

             }

             document.getElementById(self.options.containerId).appendChild(canvasDom);

             self.context = document.getElementById(self.options.containerId+"_"+"canvas");

             self.ctx = self.context.getContext("2d");

             _drawAxis();

         }

         function _drawAxis(){

             var XYData =transformAxis( [{x:self.options.paddingLeft,y:self.options.canvasHeight-self.options.paddingTop},{x:self.options.paddingLeft,y:self.options.paddingTop},{x:self.options.canvasWidth-self.options.paddingLeft,y:self.options.paddingTop}]);

             self.ctx.strokeStyle=self.options.axisColor;

             drawLine(self.ctx,XYData,self.axisBorderWidth);

             //画三角箭头

             //画y轴三角箭头

             drawLine(self.ctx,transformAxis([{x:self.options.paddingLeft-self.axisBorderWidth,y:self.options.canvasHeight-self.options.paddingTop-self.axisBorderWidth*2},{x:self.options.paddingLeft,y:self.options.canvasHeight-self.options.paddingTop},{x:self.options.paddingLeft+self.axisBorderWidth,y:self.options.canvasHeight-self.options.paddingTop-self.axisBorderWidth*2}]),self.axisBorderWidth);

             //画x轴三角箭头

             drawLine(self.ctx,transformAxis([{x:self.options.canvasWidth-self.options.paddingLeft-self.axisBorderWidth*2,y:self.options.paddingTop+self.axisBorderWidth},{x:self.options.canvasWidth-self.options.paddingLeft,y:self.options.paddingTop},{x:self.options.canvasWidth-self.options.paddingLeft-self.axisBorderWidth*2,y:self.options.paddingTop-self.axisBorderWidth}]),self.axisBorderWidth);

             _drawCoordinatePoints();

         }

         function _drawCoordinatePoints(){

             self.reactAngleWidth = (1-2*0.04)*(self.options.canvasWidth-(2*self.options.paddingLeft))/(self.options.columnChartData.length*2-1);

             self.lineDataList = [];

             for(var i = 0;i<self.options.columnChartData.length;i++)

             {

                 drawXText(self.ctx,2*self.options.columnChartData[i].NO*self.reactAngleWidth+self.options.paddingLeft+0.04*(self.options.canvasWidth-(2*self.options.paddingLeft))+self.reactAngleWidth/2,self.options.paddingTop/2,self.options.columnChartData[i].Name);

                 self.lineDataList.push({

                     x:2*self.options.columnChartData[i].NO*self.reactAngleWidth+self.options.paddingLeft+0.04*(self.options.canvasWidth-(2*self.options.paddingLeft))+self.reactAngleWidth/2,

                     y:self.options.canvasHeight-(self.options.paddingTop+(self.options.canvasHeight-2*self.options.paddingTop)*self.options.columnChartData[i].PT)

                 })

             }

             //画Y轴title  画y轴虚线

             self.reactAngleHeight = (self.options.canvasHeight-2*self.options.paddingTop)/(self.options.yChartData.length+1);

             for(var j = 0;j<self.options.yChartData.length;j++)

             {

                 drawYText(self.ctx,3*self.options.paddingLeft/4,self.options.paddingTop+self.reactAngleHeight*(j+1),self.options.yChartData[j].Name);

                 //画虚线

                 drawDottedLine(self.ctx,self.options.paddingLeft,self.options.paddingTop+self.reactAngleHeight*(j+1),self.options.canvasWidth-self.options.paddingLeft,self.options.paddingTop+self.reactAngleHeight*(j+1),self.options.canvasWidth-2*self.options.paddingLeft,10,self.axisBorderWidth/2);

             }

             _drawColumnChart();

         }

         function _drawColumnChart(){

             //柱形图循环

             var reactAngleTimer = 1;

             function loopColumnChart()

             {

                 var columnChartLooped = window.requestAnimationFrame(loopColumnChart);

                 if(reactAngleTimer<=100)

                 {

                     for(var k=0;k<self.options.columnChartData.length;k++)

                     {

                         self.ctx.fillStyle =self.options.columnChartColor;

                         drawRectangle(self.ctx,self.lineDataList[k].x-self.reactAngleWidth/2,self.options.canvasHeight-((self.options.canvasHeight-2*self.options.paddingTop)*self.options.columnChartData[k].PT*reactAngleTimer/100+self.options.paddingTop),self.reactAngleWidth,(self.options.canvasHeight-2*self.options.paddingTop)*self.options.columnChartData[k].PT*reactAngleTimer/100);

                     }

                     reactAngleTimer++;

                 }

                 else

                 {

                     window.cancelAnimationFrame(columnChartLooped);

                     columnChartLooped = null;

                     reactAngleTimer = 1;

                     if(self.options.isNeedLineChart)

                     {

                         loopLineChart();

                     }

                 }

             }

             //折线图循环

             var lineTimer = 0;

             function loopLineChart()

             {

                 var lineChartLooped = window.requestAnimationFrame(loopLineChart);

                 if(lineTimer<self.lineDataList.length-1)

                 {

                     self.ctx.lineWidth = 2*self.axisBorderWidth/3;

                     if(lineTimer == 0)

                     {

                         drawCircle(self.ctx,self.lineDataList[lineTimer].x,self.lineDataList[lineTimer].y);

                     }

                     drawCircle(self.ctx,self.lineDataList[lineTimer+1].x,self.lineDataList[lineTimer+1].y);

                     self.ctx.beginPath();

                     self.ctx.moveTo(self.lineDataList[lineTimer].x,self.lineDataList[lineTimer].y);

                     self.ctx.lineTo(self.lineDataList[lineTimer+1].x,self.lineDataList[lineTimer+1].y);

                     self.ctx.strokeStyle = self.options.lineChartColor;

                     self.ctx.lineWidth = 2*self.axisBorderWidth/3;

                     self.ctx.stroke();

                     lineTimer++;

                 }

                 else

                 {

                     window.cancelAnimationFrame(lineChartLooped);

                     lineChartLooped = null;

                     lineTimer = 0;

                 }

             }

             //画柱形图

             function drawRectangle(context,x,y,width,height){

                 context.beginPath();

                 context.fillRect(x,y,width,height);

             }

             //画圆

             function drawCircle(context,x,y){

                 context.beginPath();

                 context.arc(x,y,self.axisBorderWidth/2,0,2*Math.PI,true);

                 context.strokeStyle=self.options.lineChartColor;

                 context.stroke();

                 context.closePath();

             }

             if(self.options.isNeedAnimation)

             {

                 if(self.options.isNeedColumnChart)

                 {

                     loopColumnChart();

                 }

                 else

                 {

                     if(self.options.isNeedLineChart) {

                         loopLineChart();

                     }

                 }

             }

             else

             {

                 if(self.options.isNeedColumnChart)

                 {

                     for(var k=0;k<self.options.columnChartData.length;k++)

                     {

                         self.ctx.fillStyle =self.options.columnChartColor;

                         drawRectangle(self.ctx,self.lineDataList[k].x-self.reactAngleWidth/2,self.options.canvasHeight-((self.options.canvasHeight-2*self.options.paddingTop)*self.options.columnChartData[k].PT+self.options.paddingTop),self.reactAngleWidth,(self.options.canvasHeight-2*self.options.paddingTop)*self.options.columnChartData[k].PT);

                     }

                 }

                 if(self.options.isNeedLineChart) {

                     for (var l = 0; l < self.lineDataList.length - 1; l++) {

                         self.ctx.lineWidth = 4;

                         if (l == 0) {

                             drawCircle(self.ctx, self.lineDataList[l].x, self.lineDataList[l].y);

                         }

                         drawCircle(self.ctx, self.lineDataList[l + 1].x, self.lineDataList[l + 1].y);

                         self.ctx.beginPath();

                         self.ctx.moveTo(self.lineDataList[l].x, self.lineDataList[l].y);

                         self.ctx.lineTo(self.lineDataList[l + 1].x, self.lineDataList[l + 1].y);

                         self.ctx.strokeStyle = self.options.lineChartColor;

                         self.ctx.lineWidth = 2*self.axisBorderWidth/3;

                         self.ctx.stroke();

                     }

                 }

             }

         }

         function transformAxis(data)

         {

             var newData=[];

             for(var i=0;i<data.length;i++){

                 newData.push({

                     x:data[i].x,

                     y:self.options.canvasHeight-data[i].y

                 })

             }

             return newData;

         }

         function drawLine(context,point,width){

             context.beginPath();

             context.moveTo(point[0].x,point[0].y);

             if(point.length>2)

             {

                 for(var i=1;i<point.length;i++)

                 {

                     context.lineTo(point[i].x,point[i].y);

                 }

             }

             context.lineWidth = width;

             context.lineJoin='round';

             context.stroke();

             context.closePath();

         }

         //画y轴title

         function drawYText(context,x,y,str) {

             context.beginPath();

             context.font = '{fontSize} Microsoft Yahei'.replace("{fontSize}",self.fontSize+"px");

             context.fillStyle = 'white';

             context.textAlign = 'right';

             context.fillText(str,x,self.options.canvasHeight-y);

             context.closePath();

         }

         //画x轴title

         function drawXText(context,x,y,str) {

             context.beginPath();

             context.font = '{fontSize} Microsoft Yahei'.replace("{fontSize}",self.fontSize+"px");

             context.fillStyle = 'white';

             context.textAlign = 'center';

             context.fillText(str,x,self.options.canvasHeight-y);

             context.closePath();

         }

         function drawDottedLine(context,x1,y1,x2,y2,totalLength,length,lineWidth){

             y1 = self.options.canvasHeight-y1;

             y2 = self.options.canvasHeight-y2;

             var dashLen = length === undefined ? 5 : length;

             //计算有多少个线段

             context.beginPath();

             var num = Math.floor(totalLength/dashLen);

             context.lineWidth = lineWidth;

             for(var i = 0 ; i < num; i++)

             {

                 context[i%2==0 ? 'moveTo' : 'lineTo'](x1+(x2-x1)/num*i,y1+(y2-y1)/num*i);

             }

             context.stroke();

         }

     };

     window.ChartDraws = ChartDraws;

 }(window,document)
话不多说,上代码
 (function(window,document){

     var ChartDraws = function(options){

         if(!(this instanceof ChartDraws))return new ChartDraws(options);

         this.options = $.extend({

             //报表所需的参数

             "containerId" : "",       //canvas所在容器id

             "canvasWidth" : 400,

             "canvasHeight" : 300,

             "paddingLeft" : 20,

             "paddingTop" : 20,

             "columnChartData" :[],   //柱形图的数量和对应得名称以及百分比

             "yChartData" :[],           //y轴的数量及名称

             "axisColor" : "white",      //坐标轴颜色

             "columnChartColor" : "#EEE685", //柱形图颜色

             "isNeedAnimation" : true, //是否需要动画

             "isNeedLineChart" : true,  //是否需要折线图

             "isNeedColumnChart" : true, //是否需要柱形图

             "lineChartColor" : "#90EE90", //折线图颜色,当isNeedLineChart=true时有效

             "isNeedBorder" : false,     //canvas是否需要外边框

             "borderColor" : "white"     //外边框颜色

         },options);

         if(this.options.canvasWidth<=500)

         {

             this.axisBorderWidth = 3;

             this.fontSize = 8;

         }

         else if(this.options.canvasWidth<=800){

             this.axisBorderWidth = 4;

             this.fontSize = 12;

         }

         else{

             this.axisBorderWidth = 5;

             this.fontSize = 16;

         }

         var self = this;

         _init();

         function _init(){

             var canvasDom = document.createElement("canvas");

             canvasDom.id = self.options.containerId+"_"+"canvas";

             canvasDom.width = self.options.canvasWidth;

             canvasDom.height = self.options.canvasHeight;

             if(self.options.isNeedBorder){

                 canvasDom.style.borderWidth = 1;

                 canvasDom.style.borderStyle = "solid";

                 canvasDom.style.borderColor = self.options.borderColor;

             }

             document.getElementById(self.options.containerId).appendChild(canvasDom);

             self.context = document.getElementById(self.options.containerId+"_"+"canvas");

             self.ctx = self.context.getContext("2d");

             _drawAxis();

         }

         function _drawAxis(){

             var XYData =transformAxis( [{x:self.options.paddingLeft,y:self.options.canvasHeight-self.options.paddingTop},
                          {x:self.options.paddingLeft,y:self.options.paddingTop},{x:self.options.canvasWidth-self.options.paddingLeft,y:self.options.paddingTop}]);

             self.ctx.strokeStyle=self.options.axisColor;

             drawLine(self.ctx,XYData,self.axisBorderWidth);

             //画三角箭头

             //画y轴三角箭头

             drawLine(self.ctx,transformAxis([{x:self.options.paddingLeft-self.axisBorderWidth,y:self.options.canvasHeight-self.options.paddingTop-self.axisBorderWidth*2},
                                            {x:self.options.paddingLeft,y:self.options.canvasHeight-self.options.paddingTop},
                                            {x:self.options.paddingLeft+self.axisBorderWidth,y:self.options.canvasHeight-self.options.paddingTop-self.axisBorderWidth*2}]),
                                            self.axisBorderWidth);

             //画x轴三角箭头

             drawLine(self.ctx,transformAxis([{x:self.options.canvasWidth-self.options.paddingLeft-self.axisBorderWidth*2,y:self.options.paddingTop+self.axisBorderWidth},
                            {x:self.options.canvasWidth-self.options.paddingLeft,y:self.options.paddingTop},
                            {x:self.options.canvasWidth-self.options.paddingLeft-self.axisBorderWidth*2,y:self.options.paddingTop-self.axisBorderWidth}]),
                            self.axisBorderWidth);

             _drawCoordinatePoints();

         }

         function _drawCoordinatePoints(){

             self.reactAngleWidth = (1-2*0.04)*(self.options.canvasWidth-(2*self.options.paddingLeft))/(self.options.columnChartData.length*2-1);

             self.lineDataList = [];

             for(var i = 0;i<self.options.columnChartData.length;i++)

             {

                 drawXText(self.ctx,2*self.options.columnChartData[i].NO*self.reactAngleWidth+self.options.paddingLeft+0.04*(self.options.canvasWidth-(2*self.options.paddingLeft))
                                                +self.reactAngleWidth/2,self.options.paddingTop/2,self.options.columnChartData[i].Name);

                 self.lineDataList.push({

                     x:2*self.options.columnChartData[i].NO*self.reactAngleWidth+self.options.paddingLeft+0.04*(self.options.canvasWidth-(2*self.options.paddingLeft))+self.reactAngleWidth/2,

                     y:self.options.canvasHeight-(self.options.paddingTop+(self.options.canvasHeight-2*self.options.paddingTop)*self.options.columnChartData[i].PT)

                 })

             }

             //画Y轴title  画y轴虚线

             self.reactAngleHeight = (self.options.canvasHeight-2*self.options.paddingTop)/(self.options.yChartData.length+1);

             for(var j = 0;j<self.options.yChartData.length;j++)

             {

                 drawYText(self.ctx,3*self.options.paddingLeft/4,self.options.paddingTop+self.reactAngleHeight*(j+1),self.options.yChartData[j].Name);

                 //画虚线

                 drawDottedLine(self.ctx,self.options.paddingLeft,self.options.paddingTop+self.reactAngleHeight*(j+1),self.options.canvasWidth-self.options.paddingLeft,self.options.paddingTop
                                                    +self.reactAngleHeight*(j+1),self.options.canvasWidth-2*self.options.paddingLeft,10,self.axisBorderWidth/2);

             }

             _drawColumnChart();

         }

         function _drawColumnChart(){

             //柱形图循环

             var reactAngleTimer = 1;

             function loopColumnChart()

             {

                 var columnChartLooped = window.requestAnimationFrame(loopColumnChart);

                 if(reactAngleTimer<=100)

                 {

                     for(var k=0;k<self.options.columnChartData.length;k++)

                     {

                         self.ctx.fillStyle =self.options.columnChartColor;

                         drawRectangle(self.ctx,self.lineDataList[k].x-self.reactAngleWidth/2,self.options.canvasHeight-((self.options.canvasHeight-2*self.options.paddingTop)*self.options.columnChartData[k].PT*reactAngleTimer/100
                                      +self.options.paddingTop),self.reactAngleWidth,(self.options.canvasHeight-2*self.options.paddingTop)*self.options.columnChartData[k].PT*reactAngleTimer/100);

                     }

                     reactAngleTimer++;

                 }

                 else

                 {

                     window.cancelAnimationFrame(columnChartLooped);

                     columnChartLooped = null;

                     reactAngleTimer = 1;

                     if(self.options.isNeedLineChart)

                     {

                         loopLineChart();

                     }

                 }

             }

             //折线图循环

             var lineTimer = 0;

             function loopLineChart()

             {

                 var lineChartLooped = window.requestAnimationFrame(loopLineChart);

                 if(lineTimer<self.lineDataList.length-1)

                 {

                     self.ctx.lineWidth = 2*self.axisBorderWidth/3;

                     if(lineTimer == 0)

                     {

                         drawCircle(self.ctx,self.lineDataList[lineTimer].x,self.lineDataList[lineTimer].y);

                     }

                     drawCircle(self.ctx,self.lineDataList[lineTimer+1].x,self.lineDataList[lineTimer+1].y);

                     self.ctx.beginPath();

                     self.ctx.moveTo(self.lineDataList[lineTimer].x,self.lineDataList[lineTimer].y);

                     self.ctx.lineTo(self.lineDataList[lineTimer+1].x,self.lineDataList[lineTimer+1].y);

                     self.ctx.strokeStyle = self.options.lineChartColor;

                     self.ctx.lineWidth = 2*self.axisBorderWidth/3;

                     self.ctx.stroke();

                     lineTimer++;

                 }

                 else

                 {

                     window.cancelAnimationFrame(lineChartLooped);

                     lineChartLooped = null;

                     lineTimer = 0;

                 }

             }

             //画柱形图

             function drawRectangle(context,x,y,width,height){

                 context.beginPath();

                 context.fillRect(x,y,width,height);

             }

             //画圆

             function drawCircle(context,x,y){

                 context.beginPath();

                 context.arc(x,y,self.axisBorderWidth/2,0,2*Math.PI,true);

                 context.strokeStyle=self.options.lineChartColor;

                 context.stroke();

                 context.closePath();

             }

             if(self.options.isNeedAnimation)

             {

                 if(self.options.isNeedColumnChart)

                 {

                     loopColumnChart();

                 }

                 else

                 {

                     if(self.options.isNeedLineChart) {

                         loopLineChart();

                     }

                 }

             }

             else

             {

                 if(self.options.isNeedColumnChart)

                 {

                     for(var k=0;k<self.options.columnChartData.length;k++)

                     {

                         self.ctx.fillStyle =self.options.columnChartColor;

                         drawRectangle(self.ctx,self.lineDataList[k].x-self.reactAngleWidth/2,self.options.canvasHeight-((self.options.canvasHeight-2*self.options.paddingTop)*self.options.columnChartData[k].PT
                                          +self.options.paddingTop),self.reactAngleWidth,(self.options.canvasHeight-2*self.options.paddingTop)*self.options.columnChartData[k].PT);

                     }

                 }

                 if(self.options.isNeedLineChart) {

                     for (var l = 0; l < self.lineDataList.length - 1; l++) {

                         self.ctx.lineWidth = 4;

                         if (l == 0) {

                             drawCircle(self.ctx, self.lineDataList[l].x, self.lineDataList[l].y);

                         }

                         drawCircle(self.ctx, self.lineDataList[l + 1].x, self.lineDataList[l + 1].y);

                         self.ctx.beginPath();

                         self.ctx.moveTo(self.lineDataList[l].x, self.lineDataList[l].y);

                         self.ctx.lineTo(self.lineDataList[l + 1].x, self.lineDataList[l + 1].y);

                         self.ctx.strokeStyle = self.options.lineChartColor;

                         self.ctx.lineWidth = 2*self.axisBorderWidth/3;

                         self.ctx.stroke();

                     }

                 }

             }

         }

         function transformAxis(data)

         {

             var newData=[];

             for(var i=0;i<data.length;i++){

                 newData.push({

                     x:data[i].x,

                     y:self.options.canvasHeight-data[i].y

                 })

             }

             return newData;

         }

         function drawLine(context,point,width){

             context.beginPath();

             context.moveTo(point[0].x,point[0].y);

             if(point.length>2)

             {

                 for(var i=1;i<point.length;i++)

                 {

                     context.lineTo(point[i].x,point[i].y);

                 }

             }

             context.lineWidth = width;

             context.lineJoin='round';

             context.stroke();

             context.closePath();

         }

         //画y轴title

         function drawYText(context,x,y,str) {

             context.beginPath();

             context.font = '{fontSize} Microsoft Yahei'.replace("{fontSize}",self.fontSize+"px");

             context.fillStyle = 'white';

             context.textAlign = 'right';

             context.fillText(str,x,self.options.canvasHeight-y);

             context.closePath();

         }

         //画x轴title

         function drawXText(context,x,y,str) {

             context.beginPath();

             context.font = '{fontSize} Microsoft Yahei'.replace("{fontSize}",self.fontSize+"px");

             context.fillStyle = 'white';

             context.textAlign = 'center';

             context.fillText(str,x,self.options.canvasHeight-y);

             context.closePath();

         }

         function drawDottedLine(context,x1,y1,x2,y2,totalLength,length,lineWidth){

             y1 = self.options.canvasHeight-y1;

             y2 = self.options.canvasHeight-y2;

             var dashLen = length === undefined ? 5 : length;

             //计算有多少个线段

             context.beginPath();

             var num = Math.floor(totalLength/dashLen);

             context.lineWidth = lineWidth;

             for(var i = 0 ; i < num; i++)

             {

                 context[i%2==0 ? 'moveTo' : 'lineTo'](x1+(x2-x1)/num*i,y1+(y2-y1)/num*i);

             }

             context.stroke();

         }

     };

     window.ChartDraws = ChartDraws;

 }(window,document));
下面还有一个是实现requestAnimationFrame浏览器兼容的
 (function(){

     var lastTime = 0;

     var prefixes = ['ms','webkit','o','moz']; //各浏览器前缀

     var requestAnimationFrame = window.requestAnimationFrame;

     var cancelAnimationFrame = window.cancelAnimationFrame;

     var prefix;

     //通过遍历各浏览器前缀,来得到requestAnimationFrame和cancelAnimationFrame在当前浏览器的实现形式

     for( var i = 0; i < prefixes.length; i++ ) {

         if ( requestAnimationFrame && cancelAnimationFrame ) {

             break;

         }

         prefix = prefixes[i];

         requestAnimationFrame = requestAnimationFrame || window[ prefix + 'RequestAnimationFrame' ];

         cancelAnimationFrame  = cancelAnimationFrame  || window[ prefix + 'CancelAnimationFrame' ] || window[ prefix + 'CancelRequestAnimationFrame' ];

     }

     //如果当前浏览器不支持requestAnimationFrame和cancelAnimationFrame,则会退到setTimeout

     if ( !requestAnimationFrame || !cancelAnimationFrame ) {

         requestAnimationFrame = function( callback, element ) {

             var currTime = new Date().getTime();

             //为了使setTimteout的尽可能的接近每秒60帧的效果

             var timeToCall = Math.max( 0, 16 - ( currTime - lastTime ) );

             var id = window.setTimeout( function() {

                 callback( currTime + timeToCall );

             }, timeToCall );

             lastTime = currTime + timeToCall;

             return id;

         };

         cancelAnimationFrame = function( id ) {

             window.clearTimeout( id );

         };

     }

     window.requestAnimationFrame = requestAnimationFrame;

     window.cancelAnimationFrame = cancelAnimationFrame;

 }());
附上<script>调用
 ChartDraws({

         "containerId" : "chart1",       //canvas所在容器id

         "canvasWidth" : 1000,

         "canvasHeight" : 250,

         "paddingLeft" : 50,

         "paddingTop" : 50,

         "columnChartData": [

             {NO:0,PT:0.2,Name:"Html/Css"},

             {NO:1,PT:0.4,Name:"Html5/Css3"},

             {NO:2,PT:0.4,Name:"JavaScript"},

             {NO:3,PT:0.5,Name:"JQuery"},

             {NO:4,PT:0.2,Name:"Angular.js"},

             {NO:5,PT:0.8,Name:"BootStrap"},

             {NO:6,PT:0.6,Name:"React.js"},

             {NO:7,PT:0.5,Name:"Java"}

         ],

         "yChartData" : [

             {NO:0,Name:"熟悉"},

             {NO:1,Name:"掌握"},

             {NO:2,Name:"精通"}

         ],

         "isNeedAnimation" : false,

         "isNeedBorder" : false,

         "isNeedLineChart":true,

         "axisColor" : "#8DEEEE"

     });

     ChartDraws({

         "containerId" : "chart2",       //canvas所在容器id

         "canvasWidth" : 1000,

         "canvasHeight" : 250,

         "paddingLeft" : 50,

         "paddingTop" : 50,

         "columnChartData": [

             {NO:0,PT:0.4,Name:"Html/Css"},

             {NO:1,PT:0.5,Name:"Html5/Css3"},

             {NO:2,PT:0.2,Name:"JavaScript"},

             {NO:3,PT:0.7,Name:"JQuery"},

             {NO:4,PT:0.2,Name:"Angular.js"},

             {NO:5,PT:0.3,Name:"BootStrap"},

             {NO:6,PT:0.8,Name:"React.js"},

             {NO:7,PT:0.2,Name:"Java"}

         ],

         "yChartData" : [

             {NO:0,Name:"熟悉"},

             {NO:1,Name:"掌握"},

             {NO:2,Name:"精通"}

         ],

         "isNeedAnimation" : false,

         "isNeedBorder" : false,

         "isNeedLineChart":false,

         "isNeedColumnChart" : true,

         "columnChartColor":"#9370DB"

     });

     ChartDraws({

         "containerId" : "chart3",       //canvas所在容器id

         "canvasWidth" : 1000,

         "canvasHeight" : 250,

         "paddingLeft" : 50,

         "paddingTop" : 50,

         "columnChartData": [

             {NO:0,PT:0.4,Name:"Html/Css"},

             {NO:1,PT:0.5,Name:"Html5/Css3"},

             {NO:2,PT:0.2,Name:"JavaScript"},

             {NO:3,PT:0.7,Name:"JQuery"},

             {NO:4,PT:0.2,Name:"Angular.js"},

             {NO:5,PT:0.3,Name:"BootStrap"},

             {NO:6,PT:0.8,Name:"React.js"},

             {NO:7,PT:0.2,Name:"Java"}

         ],

         "yChartData" : [

             {NO:0,Name:"熟悉"},

             {NO:1,Name:"掌握"},

             {NO:2,Name:"精通"}

         ],

         "isNeedAnimation" : false,

         "isNeedBorder" : true,

         "isNeedLineChart":true,

         "isNeedColumnChart" : false,

         "lineChartColor" : "#8DB6CD",

         "borderColor" : "#87CEFA"

     })
html代码
 <div class="section">

     <div id="chart1"></div>

     <div id="chart2"></div>

     <div id="chart3"></div>

  </div>
下面是一个实现后的效果图
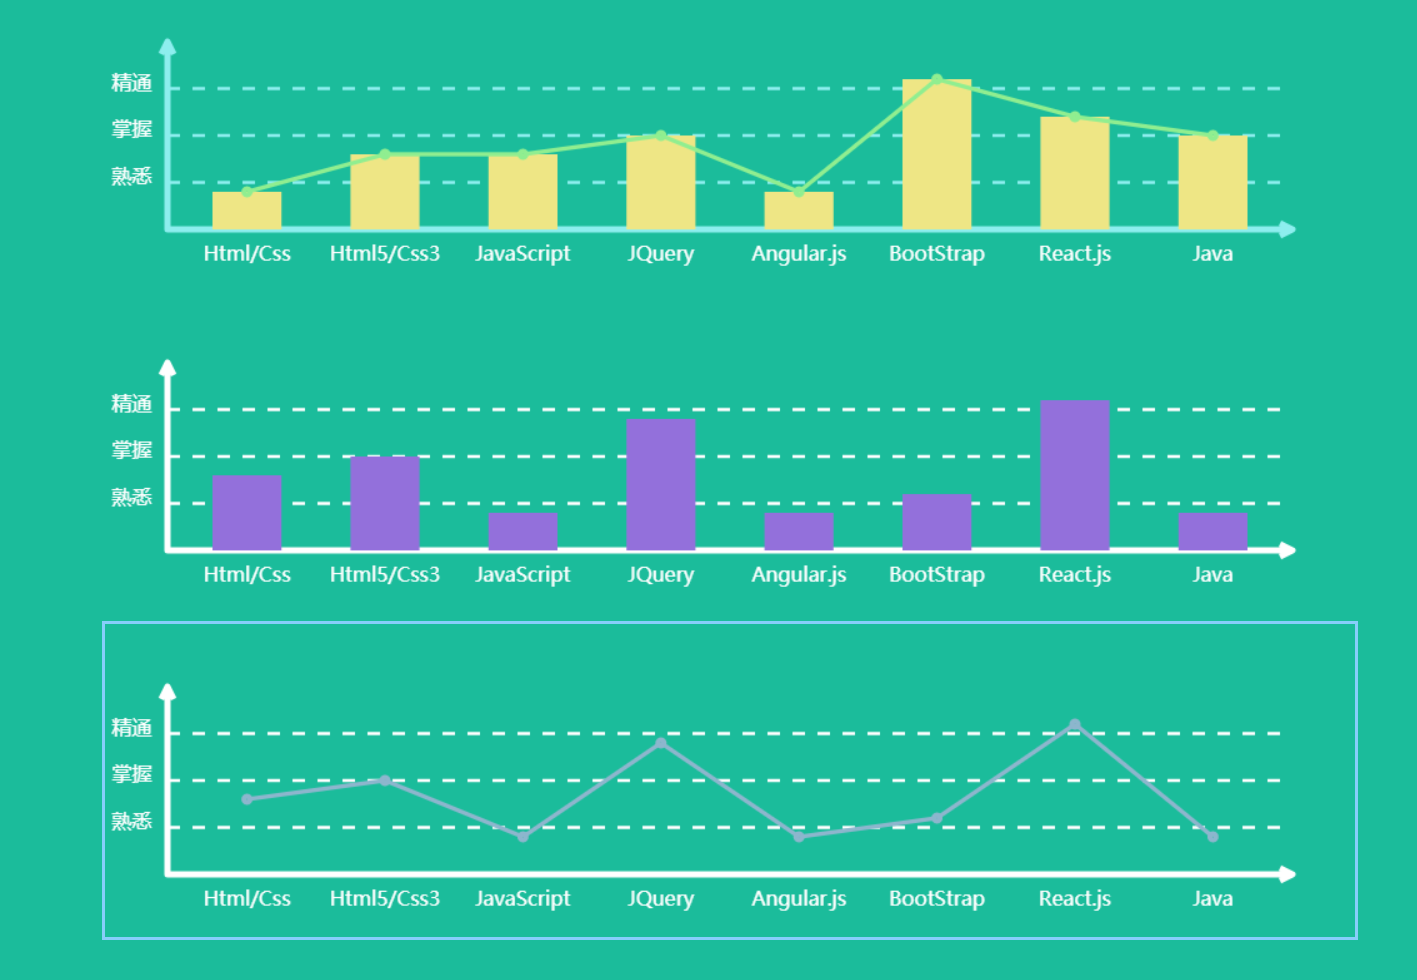
在整个编码的过程中我把代码改过一次,为什么改呢,因为在第一次的时候我在js里面使用了大量的 ChartDraws.prototype.XXXX = function(){};
后来我一想不对啊,我为什么要把这么多的方法暴露给外部呢......这不是没事找事么.......
所以现在就改成这样了,如果有不对的地方和可以改进的地方,希望路过的指点下,谢谢!还有那个白条代码背景怎么删不掉...........
js封装成插件-------Canvas统计图插件编写的更多相关文章
- js封装成插件
由于项目原因,工作一年多还没用js写过插件,项目太成熟,平时基本都是在使用已经封装好的功能插件.感觉自己好low......这两天想自己抽空写一个canvas画统计图与折现图的插件,所以就去网上学习了 ...
- JS21. 使用原生JS封装一个公共的Alert插件(HTML5: Shadow Dom)
效果预览 Shadow DOM Web components 的一个重要属性是封装--可以将标记结构.样式和行为隐藏起来,并与页面上的其他代码相隔离,保证不同的部分不会混在一起,可使代码更加干净.整 ...
- 自己做jQuery插件:将audio5js封装成jQuery语音播放插件
日前的一个项目需要用到语音播放功能.发现Audio5js符合需求且使用简单,又鉴于jQuery控件便于开发操作,于是有了以下的封装. 首先先简单介绍一下Audio5js吧. Audio5js是一个能够 ...
- JS封装移动端触摸滑动插件应用于导航banner【精装版】
自己封装了一个小插件,一个小尝试. 可用于类似于京东导航等效果,效果多样化,很方便. 欢迎大家提点意见. mrChenSwiper( {parent, child, type, parentN, c ...
- 如何将Js代码封装成Jquery插件
很多相同的Jquery代码会在很多页面使用,每次都复制粘贴太麻烦了,不如封装成一个Jquery插件就方便了,至于影响网页的速度不,我就没有测试了哈. 代码如下 这是一个自定闪烁打印文字的Jquery特 ...
- 原生JS封装Ajax插件(同域&&jsonp跨域)
抛出一个问题,其实所谓的熟悉原生JS,怎样的程度才是熟悉呢? 最近都在做原生JS熟悉的练习... 用原生Js封装了一个Ajax插件,引入一般的项目,传传数据,感觉还是可行的...简单说说思路,如有不正 ...
- 把jQuery的类、插件封装成seajs的模块的方法
这篇文章主要介绍了把jQuery的类.插件封装成seajs的模块的方法,需要的朋友可以参考下 注:本文使用的seajs版本是2.1.1 一.把Jquery封装成seajs的模块 define(func ...
- jQuery实现轮播切换以及将其封装成插件(3)
在前两篇博文中,我们写了一个普通的轮播切换.但是我们不能每一次需要这个功能就把这些代码有重新敲一次.下面我们就将它封装成一个插件. 至于什么是插件,又为什么要封装插件,不是本文考虑的内容. 我们趁着 ...
- 星级评分--封装成jquery插件
<!DOCTYPE html> <html> <head> <meta charset="utf-8"> <title> ...
随机推荐
- Scrapy提取多个标签的text
对于要提取嵌套标签所有内容的情况, 使用string或//text(), 注意两者区别 >>> from scrapy import Selector >>> &g ...
- list集合为空或为null的区别
简述 判断一个list集合是否为空,我们的惯性思维是判断list是否等于null即可,但是在Java中,list集合为空还是为null,这是两码事. 新建一个list对象,默认值是空,而非null: ...
- IntelliJ IDEA(2017.2)安装和破解(转)
如果有一定的经济基础,请支持正版,这里提供破解方法. 一.下载并安装, IntelliJ IDEA的官网:https://www.jetbrains.com 二.破解. 百度下载一个 Jetbrain ...
- MySQL之删_delete-truncate
MySQL增删改查之删_delete-truncate 一.DELETE语句 删除数据记录 1.在单表中删除行 语法: DELETE [IGNORE] FROM tbl_name [WHERE whe ...
- 数据库分库分表中间件 Sharding-JDBC 源码分析 —— SQL 解析(四)之插入SQL
- 使用MySQL-Proxy读写分离时的注意事项
在动手操作前最好先安装好MySQL-Proxy,并配置好MySQL主从服务器.补充:新版MySQL已经内建支持 延迟问题 读写分离不能回避的问题之一就是延迟,可以考虑Google提供的SemiSync ...
- php创建多级目录完整封装类操作
创建多级目录函数中调用创建指定下的指定文件的函数: public function create_dir($dir,$mode=0777) { return is_dir($dir) or ($thi ...
- SVProgressHUD源码解读(2.0.3)
SVProgressHUD是iOS开发中比较常用的一个三方库,用来在执行耗时操作或者指示用户操作结果的场合,由于使用简单,功能丰富,交互友好,被广泛应用.本文从源码的角度,解读一下实现的过程,希望能起 ...
- php面试题汇总四(基础篇附答案)
1. 什么事面向对象?主要特征是什么? 面向对象是程序的一种设计方式,它利于提高程序的重用性,使程序结构更加清晰.主要特征:封装.继承.多态. 2. SESSION 与 COOKIE的区别是什么,请从 ...
- Python 数据模型
p.p1 { margin: 0.0px 0.0px 0.0px 0.0px; font: 25.0px Helvetica } 一摞Python风格的纸牌 from collections impo ...