使用python画3D立体爱心
原理
1.使用python中的matplotlib库。
2.立体爱心面公式
\]
点画法(实心)
代码
import matplotlib.pyplot as plt #导入绘图模块

from mpl_toolkits.mplot3d import Axes3D #3d绘图模块

import numpy as np #导入数值计算拓展模块

#start generating points

x_lim=np.linspace(-10,10,150)

y_lim=np.linspace(-10,10,150)

z_lim=np.linspace(-10,10,150)

X_points=[] #用来存放绘图点X坐标

Y_points=[] #用来存放绘图点Y坐标

Z_points=[] #用来存放绘图点Z坐标

for x in x_lim:

    for y in y_lim:

        for z in z_lim:

            if (x**2+(9/4)*y**2+z**2-1)**3-(9/80)*y**2*z**3-x**2*z**3<=0:

                X_points.append(x)

                Y_points.append(y)

                Z_points.append(z)

plt.style.use('seaborn')

fig=plt.figure()

ax=fig.add_subplot(111,projection='3d')

ax.scatter(X_points,Y_points,Z_points,color="red")

plt.show()
运行效果
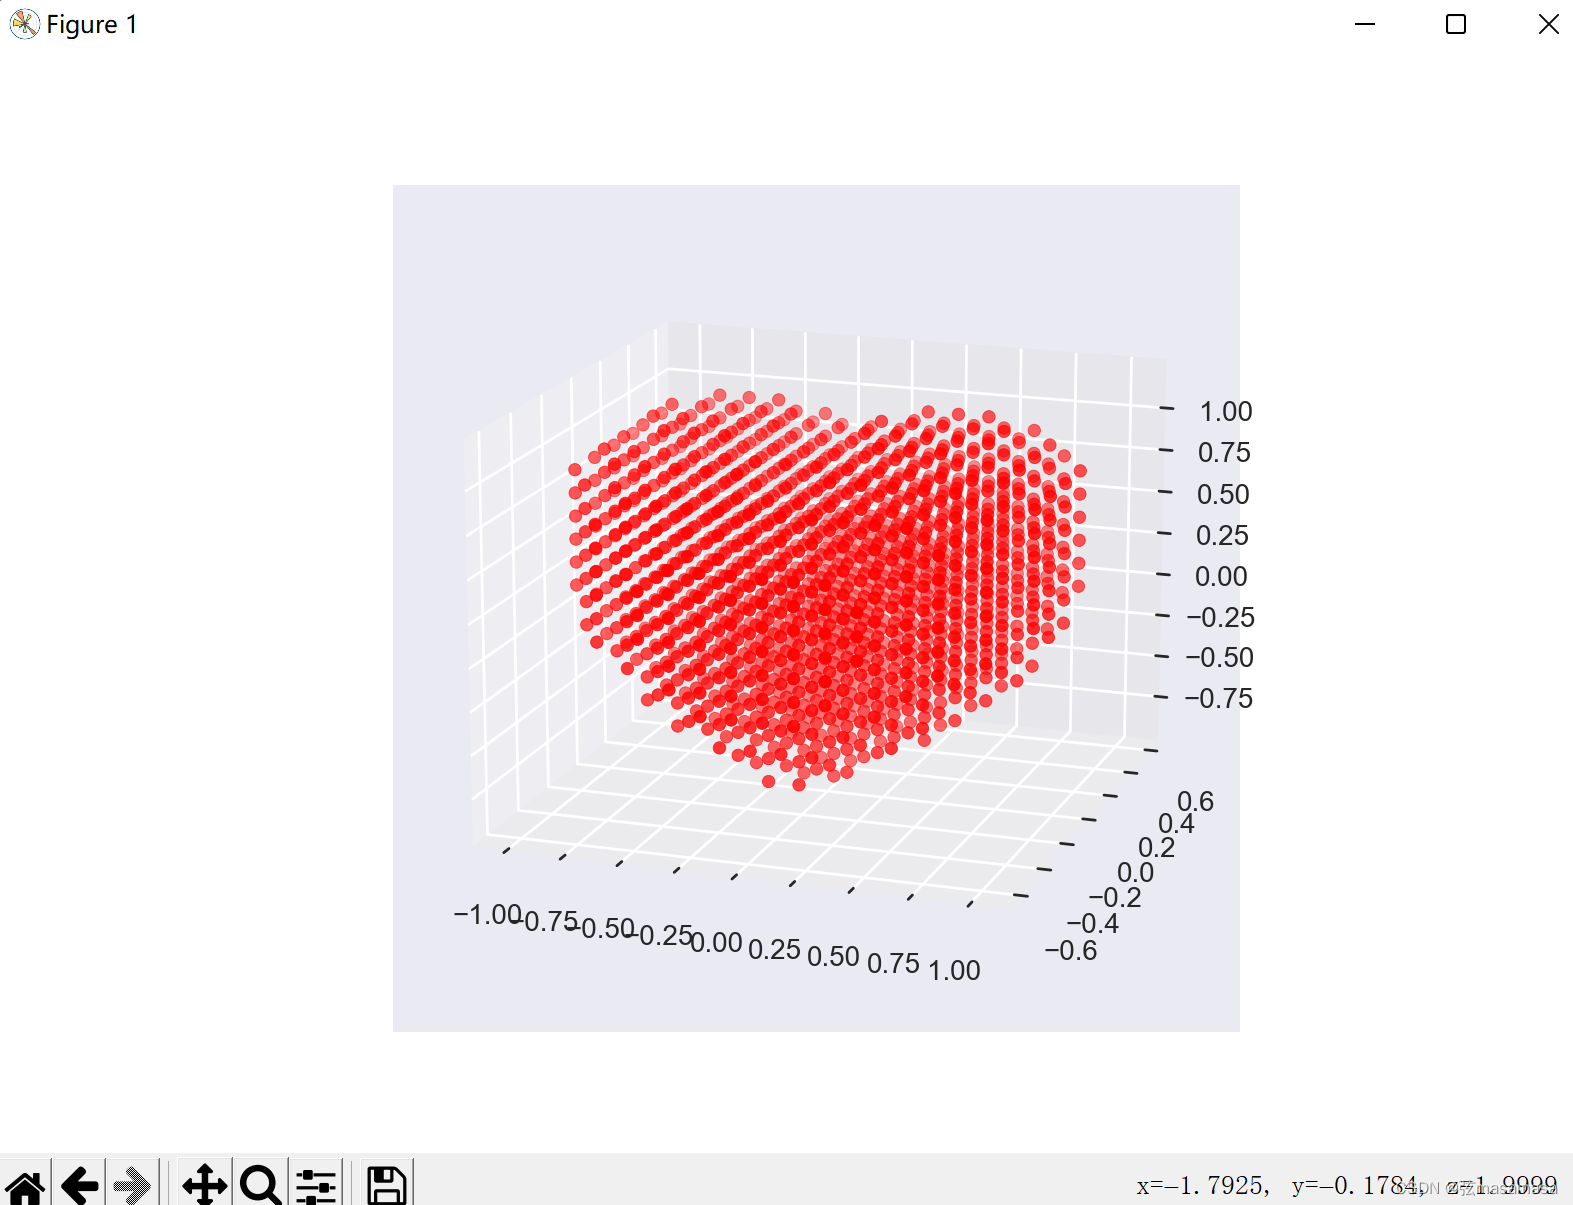
这个画法侧面看起来很无语。
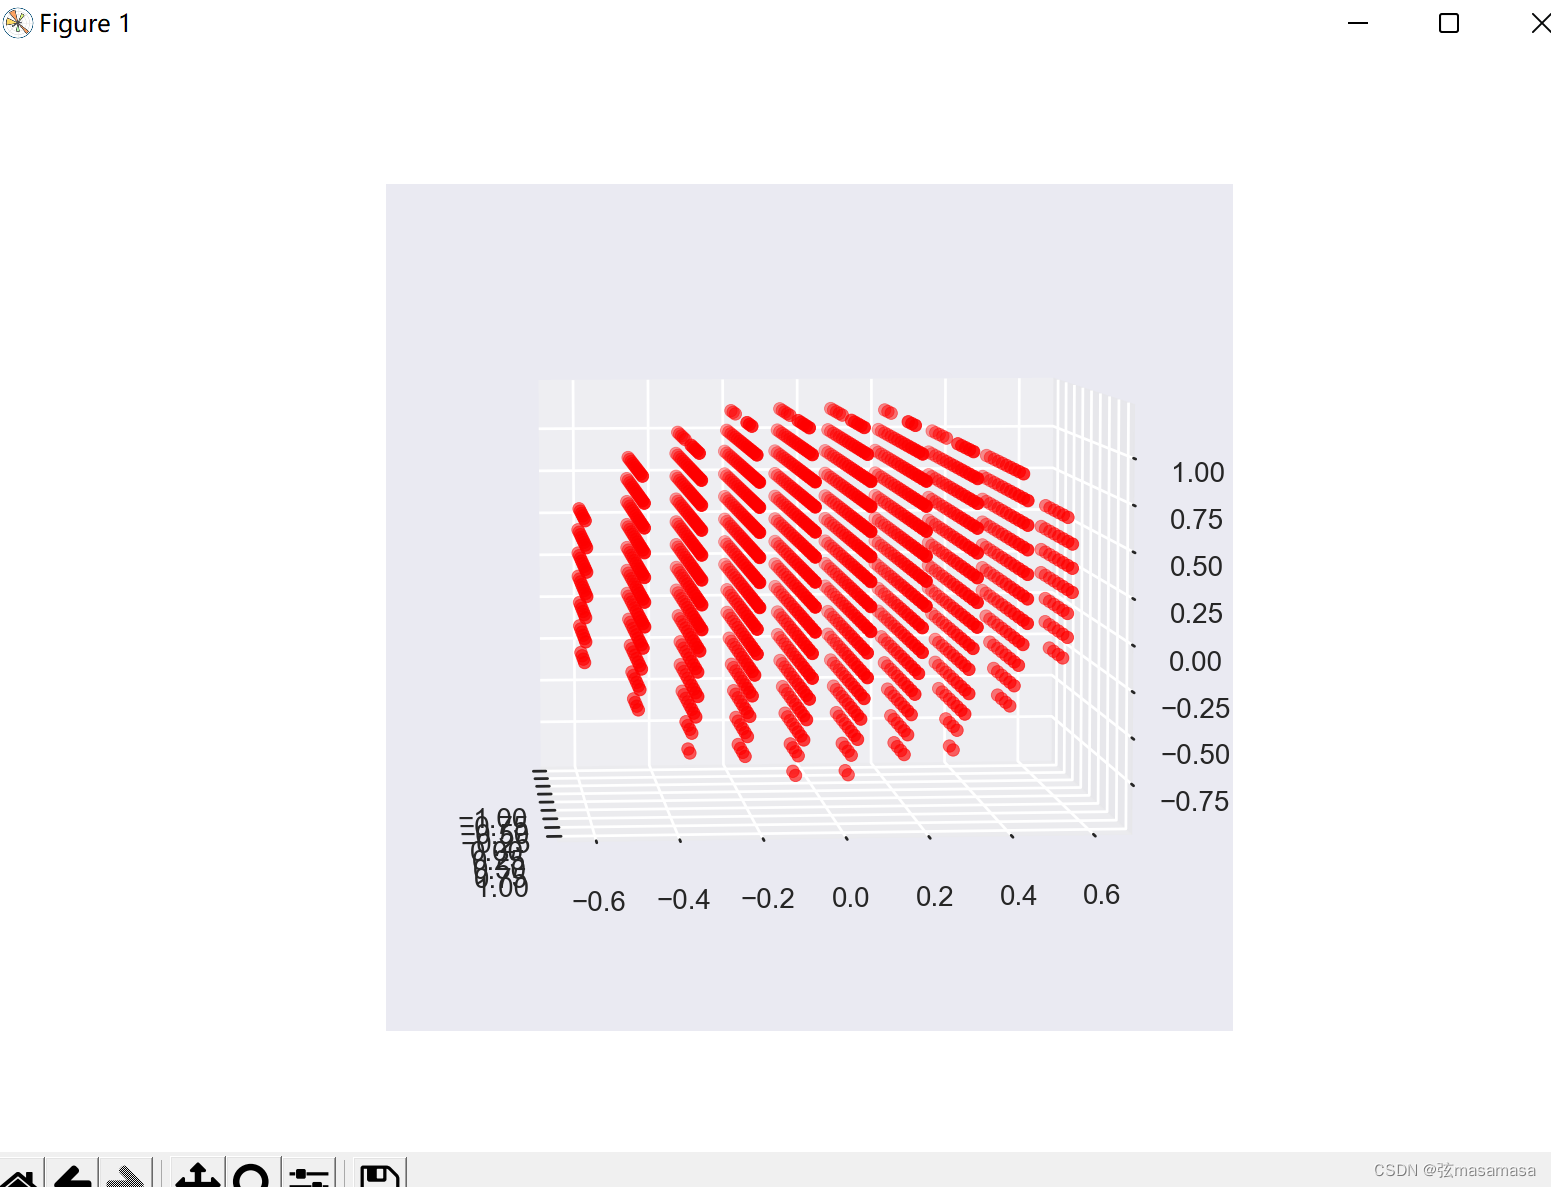
点画法(空心)
代码
import matplotlib.pyplot as plt #导入绘图模块

from mpl_toolkits.mplot3d import Axes3D #3d绘图模块

import numpy as np #导入数值计算拓展模块

#start generating points

x_lim=np.linspace(-10,10,200)

y_lim=np.linspace(-10,10,200)

z_lim=np.linspace(-10,10,200)

X_points=[] #用来存放绘图点X坐标

Y_points=[] #用来存放绘图点Y坐标

Z_tmp=[]

Z_points=[] #用来存放绘图点Z坐标

for y in y_lim:

    for x in x_lim:

        for z in z_lim:

            k=(x**2+(9/4)*y**2+z**2-1)**3-(9/80)*y**2*z**3-x**2*z**3

            if k<=0 :

                Z_tmp.append(z)

                if y<=-0.55 or y>=0.55:

                    X_points.append(x)

                    Y_points.append(y)

                    Z_points.append(z)

        if Z_tmp:

            X_points.append(x)

            Y_points.append(y)

            Z_points.append(max(Z_tmp))

            X_points.append(x)

            Y_points.append(y)

            Z_points.append(min(Z_tmp))

            Z_tmp.clear()

plt.style.use('seaborn')

fig=plt.figure()

ax=fig.add_subplot(111,projection='3d')

ax.set_zlim(-1, 1)

ax.set_xlim(-1, 1)

ax.set_ylim(-1, 1)

ax.scatter(X_points,Y_points,Z_points)

plt.show()
运行效果

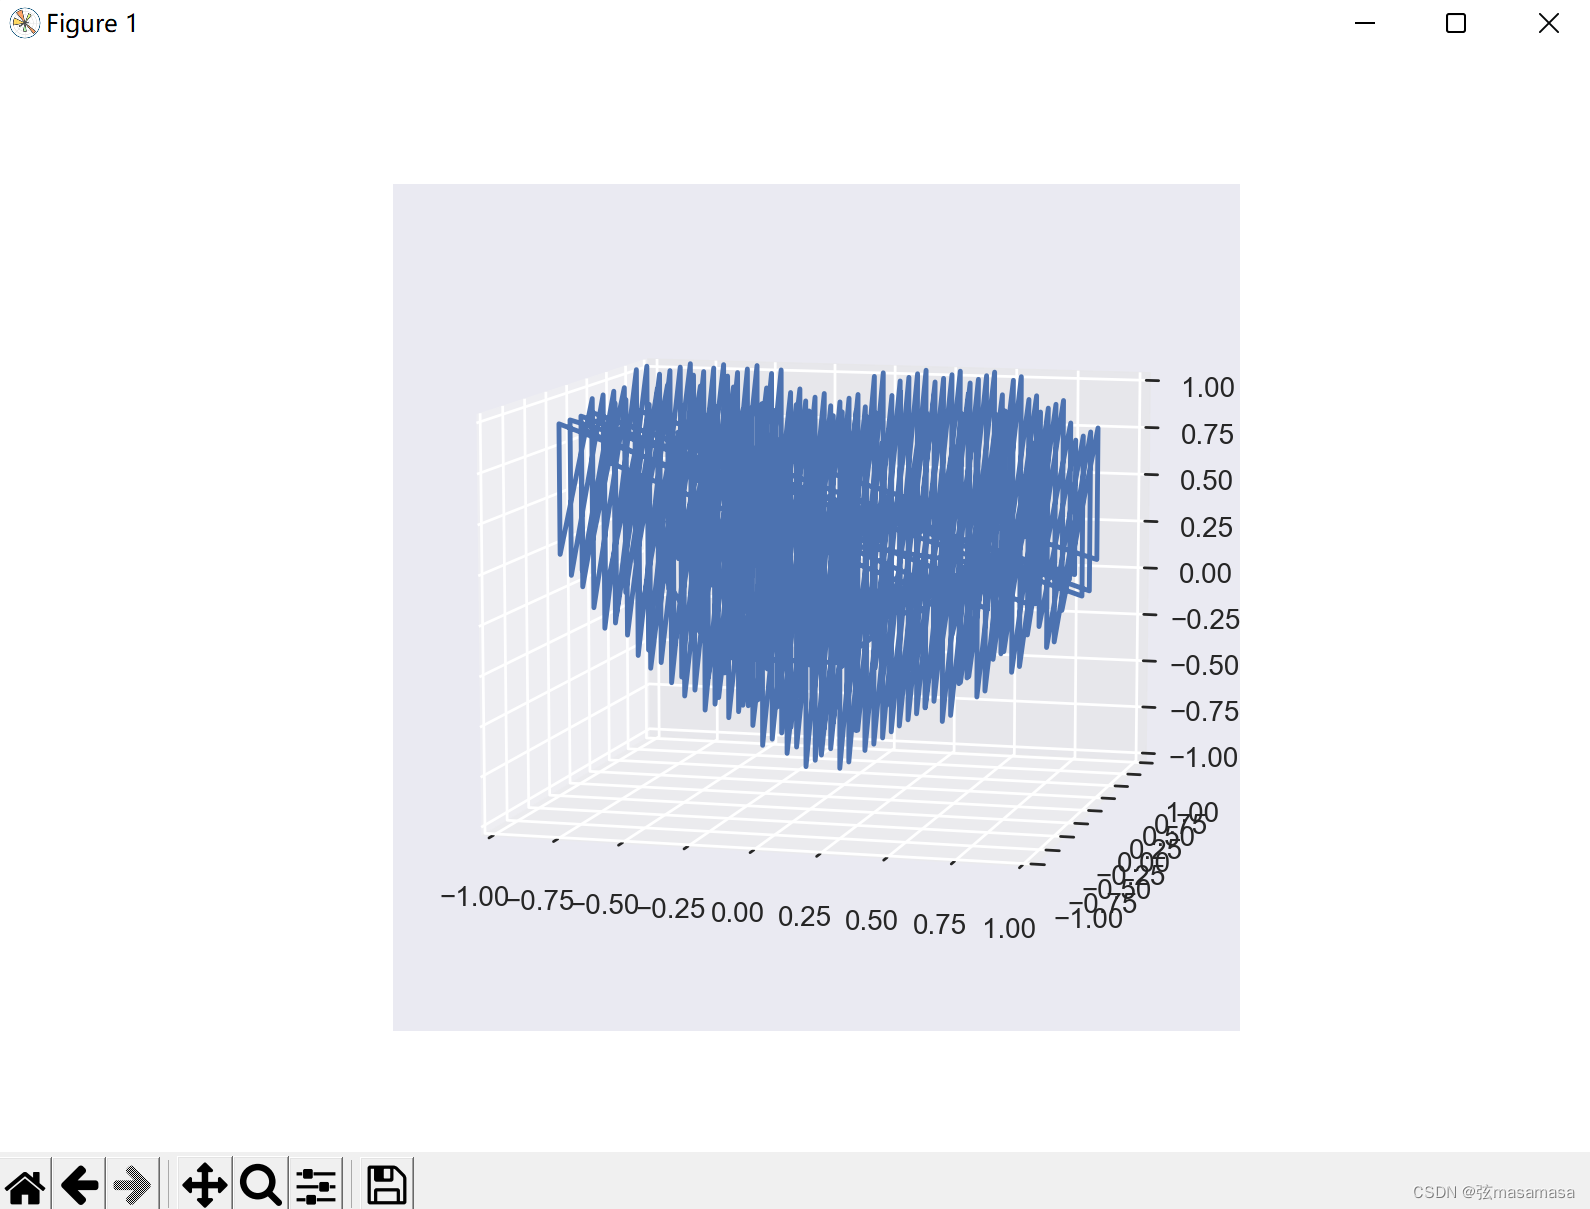
折线画法 (线团)
代码
import matplotlib.pyplot as plt #导入绘图模块

from mpl_toolkits.mplot3d import Axes3D #3d绘图模块

import numpy as np #导入数值计算拓展模块

#start generating points

x_lim=np.linspace(-10,10,150)

y_lim=np.linspace(-10,10,150)

z_lim=np.linspace(-10,10,150)

X_points=[] #用来存放绘图点X坐标

Y_points=[] #用来存放绘图点Y坐标

Z_tmp=[]

Z_points=[] #用来存放绘图点Z坐标

for y in y_lim:

    for x in x_lim:

        for z in z_lim:

            k=(x**2+(9/4)*y**2+z**2-1)**3-(9/80)*y**2*z**3-x**2*z**3

            if k<=0 :

                Z_tmp.append(z)

                if y<=-0.55 or y>=0.55:

                    X_points.append(x)

                    Y_points.append(y)

                    Z_points.append(z)

        if Z_tmp:

            X_points.append(x)

            Y_points.append(y)

            Z_points.append(max(Z_tmp))

            X_points.append(x)

            Y_points.append(y)

            Z_points.append(min(Z_tmp))

            Z_tmp.clear()

plt.style.use('seaborn')

fig=plt.figure()

ax=fig.add_subplot(111,projection='3d')

ax.set_zlim(-1, 1)

ax.set_xlim(-1, 1)

ax.set_ylim(-1, 1)

ax.plot(X_points,Y_points,Z_points)

plt.show()
运行效果
等高线画法(线框)
代码
from mpl_toolkits.mplot3d import Axes3D

from matplotlib import cm

from matplotlib.ticker import LinearLocator, FormatStrFormatter

import matplotlib.pyplot as plt

import numpy as np

def heart_3d(x, y, z):

    return (x**2+(9/4)*y**2+z**2-1)**3-x**2*z**3-(9/80)*y**2*z**3

def plot_implicit(fn, bbox=(-1.5, 1.5)):

    xmin, xmax, ymin, ymax, zmin, zmax = bbox*3

    fig = plt.figure()

    ax = fig.add_subplot(projection='3d')

    A = np.linspace(xmin, xmax, 100)  # resolution of the contour

    B = np.linspace(xmin, xmax, 10)  # number of slices

    A1, A2 = np.meshgrid(A, A)  # grid on which the contour is plotted

    for z in B:  # plot contours in the XY plane

        X, Y = A1, A2

        Z = fn(X, Y, z)

        cset = ax.contour(X, Y, Z+z, [z], zdir='z', colors=('r',))

    for y in B:  # plot contours in the XZ plane

        X, Z = A1, A2

        Y = fn(X, y, Z)

        cset = ax.contour(X, Y+y, Z, [y], zdir='y', colors=('red',))

    for x in B:  # plot contours in the YZ plane

        Y, Z = A1, A2

        X = fn(x, Y, Z)

        cset = ax.contour(X+x, Y, Z, [x], zdir='x', colors=('red',))

    # must set plot limits because the contour will likely extend

    # way beyond the displayed level. Otherwise matplotlib extends the plot limits

    # to encompass all values in the contour.

    ax.set_zlim3d(zmin, zmax)

    ax.set_xlim3d(xmin, xmax)

    ax.set_ylim3d(ymin, ymax)

    plt.show()

if __name__ == '__main__':

    plot_implicit(heart_3d)
运行效果
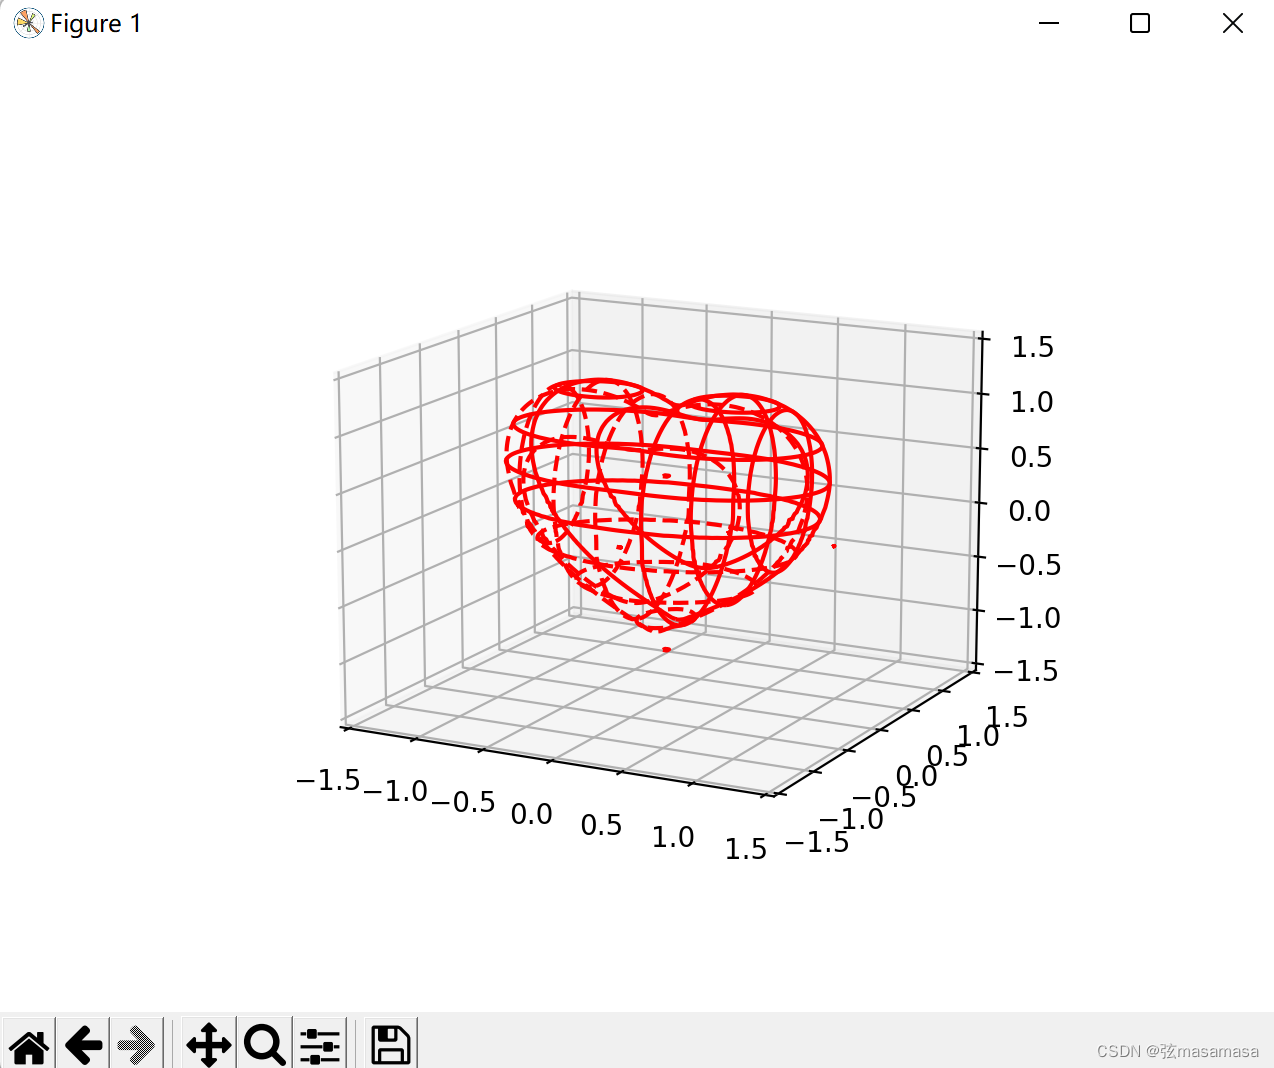
这么好看所以并不是我自己写的代码。
抄的网上,出处懒得找了(自我保护)。
使用python画3D立体爱心的更多相关文章
- python 画3D的高斯曲线
用python画3D的高斯曲线,我想如果有多个峰怎么画? import numpy as npimport matplotlib.pyplot as pltimport mathimport mpl_ ...
- Python 画3D图像
绘制一副3D图像 draw3D(X,Y,Z, angle) import numpy as np from matplotlib import pyplot as plt from mpl_toolk ...
- 使用python画3D线条
"""用于验证整体趋势正确性""" #!python3 #-*- coding:utf-8 -*- import matplotlib as ...
- WPF用SkewTransform画3D柱状图
WPF用SkewTransform画3D柱状图 SkewTransform主要是对控件实现一种2-D扭曲,具体内容可以查看以下链接: http://msdn.microsoft.com/zh-cn/l ...
- 沉淀再出发:用python画各种图表
沉淀再出发:用python画各种图表 一.前言 最近需要用python来做一些统计和画图,因此做一些笔记. 二.python画各种图表 2.1.使用turtle来画图 import turtle as ...
- 用ChemDraw画3D图的方法
在绘制化学图形的时候,很多的用户都会发现很多的图形都是三维的,这个时候就需要找一款能够绘制3D图形的化学绘图软件.ChemOffice 15.1是最新的化学绘图工具套件,总共有三个组件,其中ChemD ...
- Css3动画(一) 如何画3D旋转效果或者卫星围绕旋转效果
如何画3D旋转效果或者卫星围绕旋转效果,当然这个也是工作中的一个任务,我在网上翻了一下,并没有找到类似的东西,所以写下来还是费了一番功夫,因此我把它拿出来记录一下,当然替换了一部分内容.好了,话不多说 ...
- 用python画 pareto front
用python画 pareto front 觉得有用的话,欢迎一起讨论相互学习~Follow Me 2D pf import os import matplotlib.pyplot as plt im ...
- 用Python画如此漂亮的专业插图 ?简直So easy!
本文整理自知乎问答,仅用于学术分享,著作权归作者所有.如有侵权,请联系我删文处理.多多转发,多多学习! 方法一 强烈推荐 Python 的绘图模块 matplotlib: python plottin ...
- css3实现3D立体翻转效果
1.在IE下无法显示翻转效果,火狐和谷歌可以 /*样式css*/ .nav-menu li { display: inline; } .nav-menu li a { color: #fff; dis ...
随机推荐
- <HarmonyOS第一课01>HarmonyOS介绍
视频链接: https://developer.huawei.com/consumer/cn/training/course/slightMooc/C101717496599725471?ha_sou ...
- ubuntu下搭建Gitea代码托管平台
在 Ubuntu 上部署 Gitea 是设置本地代码托管平台的简洁和高效选择.以下是详细步骤: 步骤 1:更新系统 sudo apt update && sudo apt upgrad ...
- RabbitMQ高级使用
概述 在支付场景中,支付成功后利用RabbitMQ通知交易服务,更新业务订单状态为已支付.但是大家思考一下,如果这里MQ通知失败,支付服务中支付流水显示支付成功,而交易服务中的订单状态却显示未支付,数 ...
- 消息队列, 一种取舍的选择 Redis Stream
人多公司方便多个业务方解耦, 常用一些成熟的消息队列. 会有专门部门帮你维护好. 但在小公司, 看成本靠个人. 有的简单可能就是 redis list or mysql 存一些状态, 有问题了就自己手 ...
- centos7系统安装后的基础优化2
1.更改网卡信息 1 2 3 4 5 6 7 8 9 10 11 12 13 14 15 16 17 18 19 20 21 22 23 24 25 26 27 28 29 30 31 32 33 3 ...
- 【2020.11.17提高组模拟】数数(cuvelia) 题解
[2020.11.17提高组模拟]数数(cuvelia) 题解 题目描述 给你一个长度为n的序列\(a_1...a_n\).对于所有的\(k\in [1,n]\)选择序列中的\(k\)个数(下标为\( ...
- 网络安全中windows系统常用指令
windows系统常用指令 dir 显示指定目录下的文件和文件夹列表 cd 更改当前工作目录,cd .. 返回上一级目录 cls 清除命令行窗口的内容 echo 在命令提示符(CMD)中输出文本或显示 ...
- SonarQube的使用
一.简单介绍 SonarQube是一种自动代码审查工具,用于检测代码中的错误,漏洞和代码异味.它可以与您现有的工作流程集成,以便在项目分支和拉取请求之间进行连续的代码检查,在很多企业中都会使用到,进行 ...
- (各种数组之间的互相转换)int 数组与List互相转换,object数组转换int数组
Stream流之List.Integer[].int[]相互转化 一.int[ ] 1.1.int[ ] 转 Integer[ ] public static void main(String[] a ...
- 函数使用十五:BAPI_PO_RELEASE
*&---------------------------------------------------------------------* *& Report ZBAPI_PO_ ...