【转】iOS 自动化性能采集
前言
对于iOS总体生态是比较封闭的,相比Android没有像adb这种可以查看内存、cpu的命令.在日常做性能测试,需要借助xcode中instruments查看内存、cpu等数据.
但是借助instruments比较麻烦、又不能提供命令行.在持续集成中,很难时时的监控app的性能指标.并且现在app发版一般是2周左右,留给做专项测试的时间更少了,那么做核心场景性能测试,肯定是来不及的.
所以需要借助一些自动化工具来减轻手工采集性能指标的工作量.
性能采集项
app中基本性能采集项,内存、cpu、fps、电量等,因为自动化采集中手机设备是插着电脑充电的,所以不能采集电量数据.
已有工具
- instruments是官方提供的,不能做到自动化采集
- 腾讯gt,需要在app中集成sdk,有一定的接入成本
- 第三sdk,类似腾讯gt需要在app集成,可能会有数据泄漏风险
脚本开发
上述的已有工具都不满足,在持续集成中做到自动化采集性能数据,期望的性能测试工具有一下几点:
- 方便接入
- 可生成性能报告
- 可持续化
- 数据收集精准
所以基于这几点,需要自己开发一套性能采集脚本.
使用官方提供的api做性能采集
获取内存、cpu等
#import <mach/mach.h>

/**

 *  获取内存

 */

- (NSString *)get_memory {

    int64_t memoryUsageInByte = 0;

    task_vm_info_data_t vmInfo;

    mach_msg_type_number_t count = TASK_VM_INFO_COUNT;

    kern_return_t kernelReturn = task_info(mach_task_self(), TASK_VM_INFO, (task_info_t) &vmInfo, &count);

    if(kernelReturn == KERN_SUCCESS) {

        memoryUsageInByte = (int64_t) vmInfo.phys_footprint;

        NSLog(@"Memory in use (in bytes): %lld", memoryUsageInByte);

    } else {

        NSLog(@"Error with task_info(): %s", mach_error_string(kernelReturn));

    }

    double mem = memoryUsageInByte / (1024.0 * 1024.0);

    NSString *memtostring ;

    memtostring = [NSString stringWithFormat:@"%.1lf",mem];

    return memtostring;

}

/**

 * 获取cpu

 */

- (NSString *) get_cpu{

    kern_return_t kr;

    task_info_data_t tinfo;

    mach_msg_type_number_t task_info_count;

    task_info_count = TASK_INFO_MAX;

    kr = task_info(mach_task_self(), TASK_BASIC_INFO, (task_info_t)tinfo, &task_info_count);

    if (kr != KERN_SUCCESS) {

        return [ NSString stringWithFormat: @"%f" ,-1];

    }

    task_basic_info_t      basic_info;

    thread_array_t         thread_list;

    mach_msg_type_number_t thread_count;

    thread_info_data_t     thinfo;

    mach_msg_type_number_t thread_info_count;

    thread_basic_info_t basic_info_th;

    uint32_t stat_thread = 0; // Mach threads

    basic_info = (task_basic_info_t)tinfo;

    // get threads in the task

    kr = task_threads(mach_task_self(), &thread_list, &thread_count);

    if (kr != KERN_SUCCESS) {

        return [ NSString stringWithFormat: @"%f" ,-1];

    }

    if (thread_count > 0)

        stat_thread += thread_count;

    long tot_sec = 0;

    long tot_usec = 0;

    float tot_cpu = 0;

    int j;

    for (j = 0; j < thread_count; j++)

    {

        thread_info_count = THREAD_INFO_MAX;

        kr = thread_info(thread_list[j], THREAD_BASIC_INFO,

                         (thread_info_t)thinfo, &thread_info_count);

        if (kr != KERN_SUCCESS) {

            tot_cpu = -1;

            //return -1;

        }

        basic_info_th = (thread_basic_info_t)thinfo;

        if (!(basic_info_th->flags & TH_FLAGS_IDLE)) {

            tot_sec = tot_sec + basic_info_th->user_time.seconds + basic_info_th->system_time.seconds;

            tot_usec = tot_usec + basic_info_th->user_time.microseconds + basic_info_th->system_time.microseconds;

            tot_cpu = tot_cpu + basic_info_th->cpu_usage / (float)TH_USAGE_SCALE * 100.0;

        }

    } // for each thread

    kr = vm_deallocate(mach_task_self(), (vm_offset_t)thread_list, thread_count * sizeof(thread_t));

    assert(kr == KERN_SUCCESS);

    NSString *tostring = nil ;

    tostring = [ NSString stringWithFormat: @"%.1f" ,tot_cpu];

    NSLog (@"performance  cpu:%@",tostring);

    return tostring;

}

获取页面vc
上边收集了内存和cpu,还需要在收集数据的同时和页面对应上.这样就清楚了是当前页面的内存和cpu情况.
/**

 *获取当前vc

 */

- (UIViewController *) get_vc {

    UIWindow *keyWindow = [UIApplication sharedApplication].keyWindow;

    __weak typeof(self) weakSelf = self;

    dispatch_async(dispatch_get_main_queue(), ^{

        if ([keyWindow.rootViewController isKindOfClass:[UITabBarController class]]) {

            UITabBarController *tab = (UITabBarController *)keyWindow.rootViewController;

            UINavigationController *nav = tab.childViewControllers[tab.selectedIndex];

            DDContainerController *content = [nav topViewController];

            weakSelf.vc = [content contentViewController];

        }

    });

    return self.vc;

}
获取设备信息
/*

 *获取设备名称

 */

- (NSString *) get_devicesName {

    NSString *devicesName = [UIDevice currentDevice].name; //设备名称

    NSLog(@"performance   devicesName:%@", devicesName);

    return devicesName;

}

/*

 *获取系统版本

 */

- (NSString *) get_systemVersion{

    NSString *systemVersion = [UIDevice currentDevice].systemVersion; //系统版本

    NSLog(@"performance   version:%@", systemVersion);

    return systemVersion;

}

/*

 *获取设备idf

 */

- (NSString *) get_idf {

    NSString *idf = [UIDevice currentDevice].identifierForVendor.UUIDString;

    NSLog(@"performance   idf:%@", idf);

    return idf;

}
数据拼接
最终要把内存、cpu等数据拼接成字典的形式,方便输出查看
输出log日志的数据格式
{

    "cpu": "0.4",

    "fps": "60 FPS",

    "version": "11.2",

    "appname": "xxxxxx",

    "battery": "-100.0",

    "appversion": "5.0.4",

    "time": "2018-09-07 11:45:24",

    "memory": "141.9",

    "devicesName": "xxxxxx",

    "vcClass": "DDAlreadPaidTabListVC",

    "idf": "8863F83E-70CB-43D5-B6C7-EAB85F3A2AAD"

}
开启子线程采集
开一个子线程定时采集数据
/*

 * 性能采集子线程

 */

- (void) performancethread {

    NSThread *thread = [[NSThread alloc] initWithBlock:^{

        NSLog(@"performance   ======get performance======");

        [self get_fps];

        while (true) {

            DDPerformanceModel *model = [DDPerformanceModel new];

            model.time=[self get_time];

            model.appname=[self get_appname];

            model.appversion=[self get_appversion];

            model.idf =[self get_idf];

            model.devicesName =[self get_devicesName];

            model.version = [self get_systemVersion ];

            model.vcClass = NSStringFromClass([self get_vc].class);

            model.memory = [self get_memory];

            model.battery = [self get_battery];

            model.cpu = [self get_cpu];

            model.fps = self.percount;

            NSString *json = [model modelToJSONString];

//            printf(" getperformance    %s\r\n", [json UTF8String]);

            NSLog(@"getperformance model  %@", json);

            sleep(5);

        }

    }];

    [thread start];

    NSLog(@"performance   ======continue mainblock======");

}
初始化性能采集
AppDelegate.m文件中didFinishLaunchingWithOptions方法中用户各种初始化操作,可以在第一行初始化性能采集,
这样app启动以后就可以定时采集数据

- (BOOL)application:(UIApplication *)application didFinishLaunchingWithOptions:(NSDictionary *)launchOptions {

    [[getperformance new] performancethread];//获取性能数据

    }
性能采集日志存储
一般来说日志存储都是写入到本地log日志,然后读取.但是有两个问题
- 需要读写文件代码,对于不熟悉oc的人来说比较难
- 因为是定时采集,文件IO操作频繁
所以不考虑存储本地log日志的方式,可以在代码中打印出数据,通过截获当前设备运行的日志获取数据.
模拟器可以使用xcrun simctl命令获取当前设备运行日志,
真机用libimobiledevice获取日志

xcrun simctl spawn booted log stream --level=debug | grep getperformance

输出log日志的数据格式,这块做了json美化,每歌几秒在控制台就打印一次

{
    "cpu": "0.4",
    "fps": "60 FPS",
    "version": "11.2",
    "appname": "xxxxxx",
    "battery": "-100.0",
    "appversion": "5.0.4",
    "time": "2018-09-07 11:45:24",
    "memory": "141.9",
    "devicesName": "xxxxxx",
    "vcClass": "DDAlreadPaidTabListVC",
    "idf": "8863F83E-70CB-43D5-B6C7-EAB85F3A2AAD"
}

如果获取多次数据可以使用shell脚本把命令放到后台,定时写入到logpath中
nohup xcrun simctl spawn booted log stream --level=debug >${logpath} &
代码插入到工程中
因为在持续集成中,每次打取的代码都是不带性能测试代码,这些代码是单独写到文件中.在编译项目前,用shell把代码插入到工程中,这样打出来的包才能有采集性能数据功能.
scriptrootpath=${2}
AddFiles=${2}"/GetPerformance/performancefiles"
localDDPerformanceModelh=${scriptrootpath}"/GetPerformance/performancefiles/DDPerformanceModel.h"
localDDPerformanceModelm=${scriptrootpath}"/GetPerformance/performancefiles/DDPerformanceModel.m"
localgetperformanceh=${scriptrootpath}"/GetPerformance/performancefiles/getperformance.h"
localgetperformancem=${scriptrootpath}"/GetPerformance/performancefiles/getperformance.m"

addfiles(){

    echo "删除${projectaddpath}中的原性能采集文件"

    rm -rf ${DDPerformanceModelh}
    rm -rf ${DDPerformanceModelm}
    rm -rf ${getperformanceh}
    rm -rf ${getperformancem}

    echo "复制文件到${projectaddpath}路径"

    cp  ${localDDPerformanceModelh} ${projectaddpath}
    cp  ${localDDPerformanceModelm} ${projectaddpath}
    cp  ${localgetperformanceh} ${projectaddpath}
    cp  ${localgetperformancem} ${projectaddpath}

}
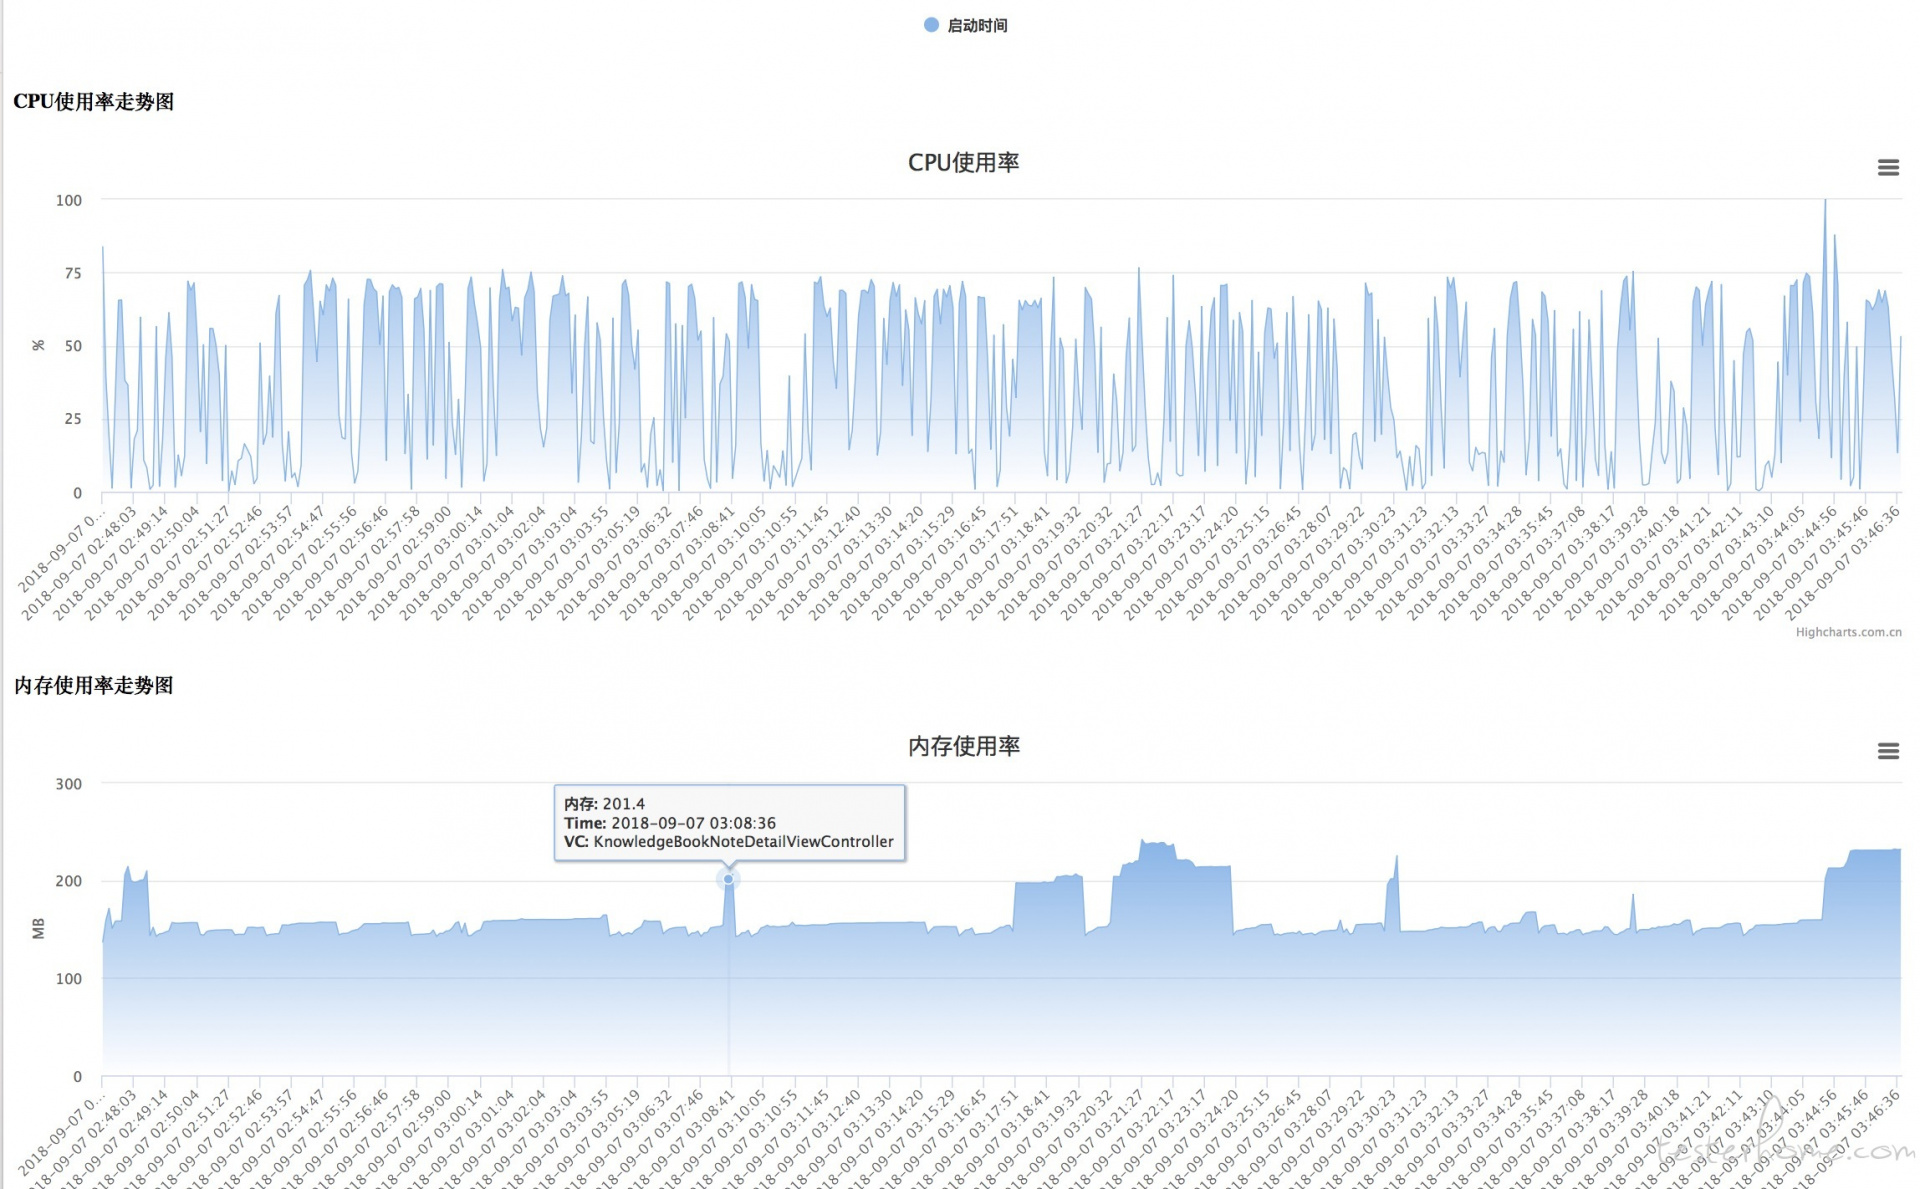
性能数据绘制
在手工和自动化使用插入性能测试代码的app,如果截获性能数据后,可以对数据做性能数据绘制.
用Higcharts或者echarts绘制性能走势图
如何在持续集成中使用
monkey和UI自动化中使用,最终会发送一份性能报告.
Demo代码
已经把性能代码脱了主项目,可在Demo代码中编译,github地址:https://github.com/xinxi1990/iOSPerformanceTest
原文: https://testerhome.com/topics/16064
最后
虽然iOS生态封闭,但是对于开发者和测试者还是有一些空间可以利用的.
[腾讯 TMQ] iOS 电量测试实践
https://testerhome.com/topics/10666
【转】iOS 自动化性能采集的更多相关文章
- 【Android测试】【随笔】性能采集工具——小松鼠诞生记
◆版权声明:本文出自胖喵~的博客,转载必须注明出处. 转载请注明出处:http://www.cnblogs.com/by-dream/p/4945066.html 起因 去年刚加入TX的时候,我便接手 ...
- 一招让 IOS 自动化化快的飞起
前言 最近在做IOS自动化测试,IOS的Appium环境都配置OK,Demo脚本运行没有问题,多开执行没有问题,IOS安卓统一平台调度集成没有问题,可以进行自动化测试.课时真正执行用例时发现个严重问题 ...
- 【iOS Instrument性能优化集】
iOS Instrument性能优化集 1.UIImage缓存取舍 在项目代码中看到大量使用如下代码: UIImage使用 在Main Thread中发现不同动画场景中Image IO 开销和耗时所占 ...
- 初识ios自动化(一)
Appium进行自动化测试有两个好处: 1. Appium在不同平台中使用了标准的自动化APIs,所以在跨平台时,不需要重新编译或者修改自己的应用. 2. Appium支持Selenium WebDr ...
- iOS app性能优化的那些事
iPhone上面的应用一直都是以流畅的操作体验而著称,但是由于之前开发人员把注意力更多的放在开发功能上面,比较少去考虑性能的问题,可能这其中涉及到objective-c,c++跟lua,优化起来相对 ...
- iOS程序性能优化
iOS程序性能优化 一.初级 使用ARC进行内存管理 在iOS5发布的ARC,它解决了最常见的内存泄露问题.但是值得注意的是,ARC并不能避免所有的内存泄露.使用ARC之后,工程中可能还会有内存泄露, ...
- iOS应用性能调优的25个建议和技巧【转】
转载自:http://blog.jobbole.com/37984/ 首页 最新文章 资讯 程序员 设计 IT技术 创业 在国外 营销 趣文 特别分享 更多 > - Navigation - ...
- iOS应用性能调优的4个建议和技巧
任何一个能在用户手机屏幕中占有一席之地的iOS app都包含3个关键因素:想法好.设计出色.性能卓越.本文将分享一些iOS应用性能调优的4个建议和技巧. Tip #1:把图片资源压缩到最小. i ...
- iOS 程序性能优化
前言 转载自:http://www.samirchen.com/ios-performance-optimization/ 程序性能优化不应该是一件放在功能完成之后的事,对性能的概念应该从我们一开始写 ...
随机推荐
- CSS TYPOGRAPHY
CSS TYPOGRAPHY Review Great job! You learned how to style an important aspect of the user experience ...
- 应用DBExportDoc导出mysql库为word07文档
1.相关软件下载 DBExportDoc V1.0 For MySQL 密码:znu3 MySQL Connector/ODBC 2.安装mysql-connector-odbc并配置数据源 安装略. ...
- ReactiveX 学习笔记(16)RxPY
RxPY RxPY 是 ReactiveX 的 Python语言实现. # 安装 RxPY $ pip3 install rx Successfully installed rx-1.6.1 Basi ...
- Kotlin语言学习笔记(3)
数据类(Data Classes) data class User(val name: String, val age: Int) 编译器自动生成的有: equals()/hashCode() toS ...
- Linux下GDB调试简单示例
这里介绍对文件first.c的基本GDB调试操作,只有部分命令,只是一个示例,运行环境为装有gcc编译器和gdb调试器的Linux环境,基本GDB调试命令如下表: 命令 ...
- list 转datatable
//public static DataTable ListToDataTable(List<FwImage> entitys) //{ // //检查实体集合不能为空 // if (en ...
- mongoDB如何处理多对多关系
问题描述: 例如在关系数据库中有一个Team表,一个User表,两者是多对多的关系,即一个Team可以有多个User,一个User也可能属于多个Team,请问这样的关系在MongoDB中如何存储? 如 ...
- C# 读取ini文件,读不出来原因
先赋上相关读取ini文件代码 public class INIHelper { public string inipath; [DllImport("kernel32")] pri ...
- unity3d热更新插件uLua学习整理
前言 IOS不能热更新,不是因为不能用反射,是因为System.Reflection.Assembly.Load 无法使用System.Reflection.Emit 无法使用System.CodeD ...
- C# 依赖注入那些事儿
原文地址:http://www.cnblogs.com/leoo2sk/archive/2009/06/17/1504693.html 里面有一个例子差了些代码,补全后贴上. 3.1.3 依赖获取 u ...