Windbg程序调试系列5-高CPU问题分析
上篇博客中给大家分享了使用Windbg进行Live Debugging:
本篇中我们继续,跟大家分享常见的应用程序高CPU使用率问题分析。
先说Windows下CPU使用率这个概念:
CPU使用率:在任务管理器的刷新周期内CPU忙的时间与整个刷新周期的比值。默认的刷新周期是1s。
即1s内,反映出系统的CPU繁忙程度
我们打开Windows的任务管理器,可以看到CPU的使用率:
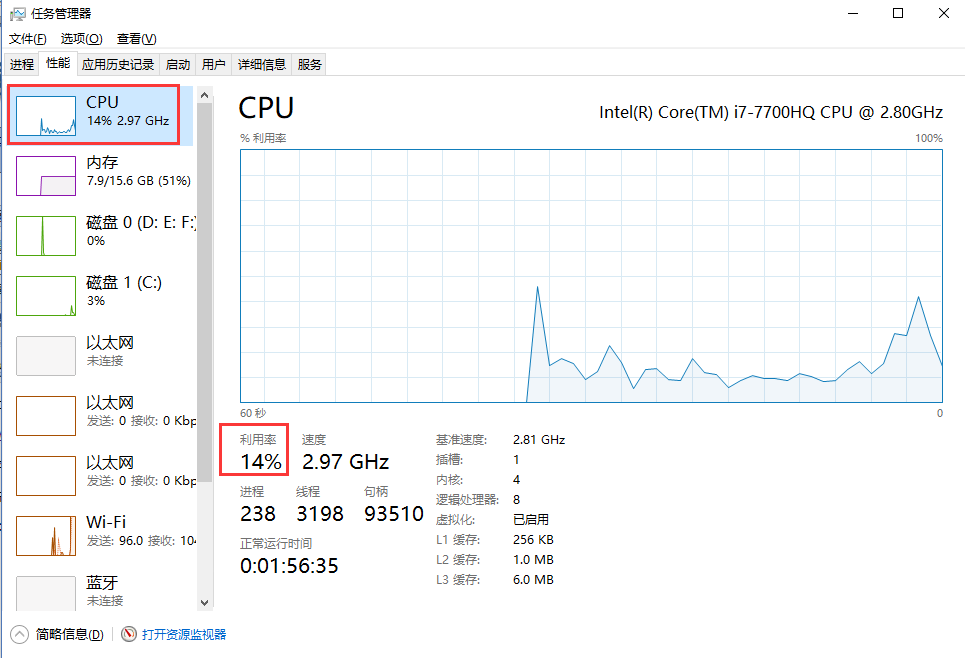
当然,这个CPU使用率是整个所有核心CPU的使用率。比如我本机是8核心的CPU。整体的CPU使用率 在某一瞬间是14%。
这个CPU使用率是如何计算出来的,有两个重要的时间sysTime和idleTime:
sysTime:表示该时间段内总的CPU时间=CPU处于用户态和内核态CPU时间的总和,即sysTime =kerneTimel + userTime
(注:这里并不包括idleTime,因为当CPU处于空闲状态时,是在内核模式下运行System Idle Process这个进程,所以kernelTime实际上已经包含了idleTime);
idleTime:表示在该时间段内CPU处于空闲状态的时间;
CPU% = 1 – idleTime / sysTime * 100
说到这里,我们分析一个应用的高cpu问题,更多的是:分析用户态的CPU耗时。即,我们应用程序本身运行时消耗的CPU时间片总和。
然后,进入今天的正题,使用Windbg分析高CPU问题:
一、首先我们用C#写一个Any CPU架构的Console模拟程序
using System;

using System.Collections.Generic;

using System.Linq;

using System.Text;

using System.Threading;

using System.Threading.Tasks;

namespace HighCpuDemo

{

    class Program

    {

        static void Main(string[] args)

        {

            var normalThread = new Thread(NormalMethod);

            normalThread.Start();

            var longRunningThread = new Thread(LongRunningMethod);

            longRunningThread.Start();

            Console.ReadKey();

        }

        private static void NormalMethod()

        {

            int a = 0;

            int b = 100000;

            var list = new List<int>();

            for (int i = 0; i < b; i++)

            {

                a += i;

                list.Add(a);

                var max = list.Max();

                var min = list.Min();

                var avg = list.Average();

                Console.WriteLine(string.Format("Thread:{0}, writeline:{1}", Thread.CurrentThread.ManagedThreadId, a));

                //休息一下

                Thread.Sleep(100);

            }

        }

        private static void LongRunningMethod()

        {

            for (int c = 0; c < 100000; c++)

            {

                int a = 0;

                int b = 100000;

                var list = new List<int>();

                for (int i = 0; i < b; i++)

                {

                    a += i;

                    list.Add(a);

                    var max = list.Max();

                    var min = list.Min();

                    var avg = list.Average();

                    Console.WriteLine(string.Format("Thread:{0}, writeline:{1}", Thread.CurrentThread.ManagedThreadId, a));

                }

            }

        }

    }

}
代码中有两个线程,一个是“正常”的计算输出线程NormalThread(每次输出,会休息一下 100s),一个是长时间运行的线程LongRunningThread,一直在计算,输出。
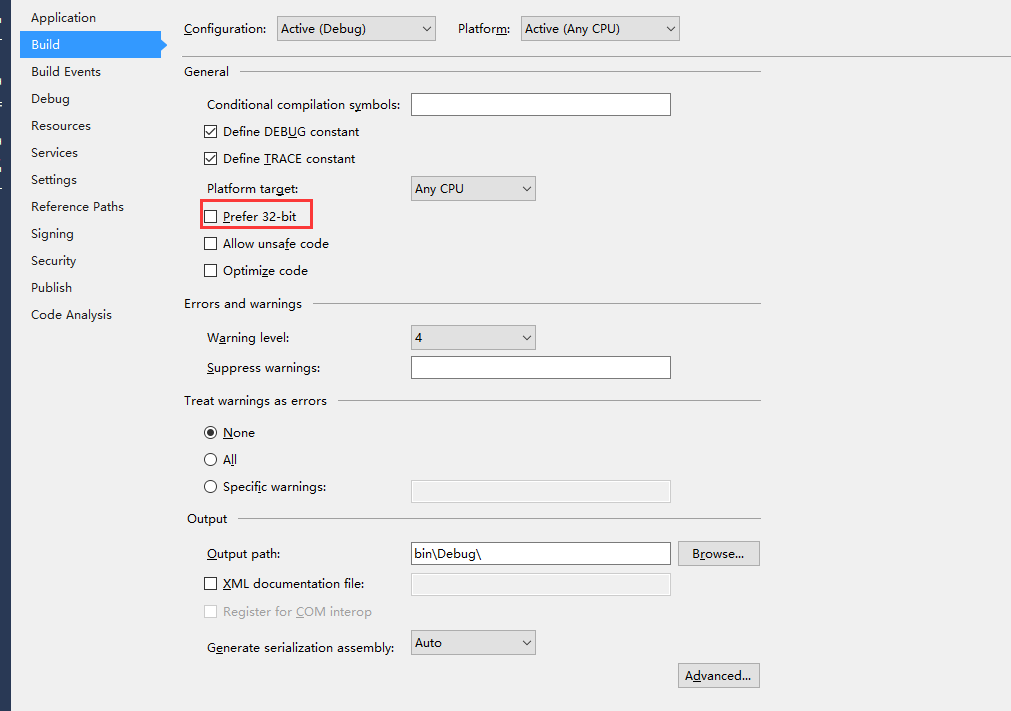
代码写好之后,设置为Any CPU架构,支持64位模式:
看程序输出:
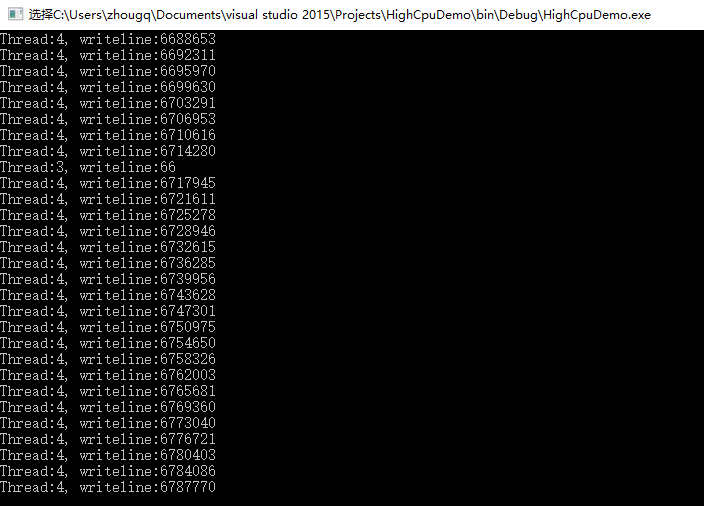
很明显,3号线程是NormalThread, 4号线程是LongRunningThread。
二、 查看应用进程的CPU使用率
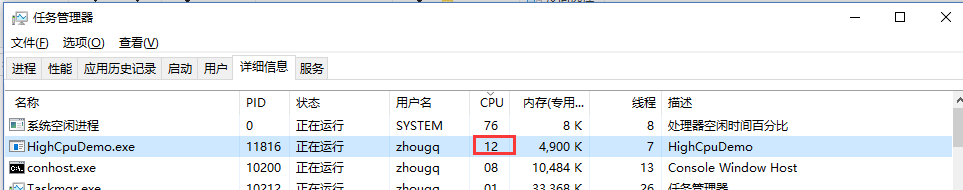
从任务管理器上,能够发现,HighCpuDemo这个进程的CPU使用率是12%
三、间隔30s,抓两个Dump

这里有个问题:为什么要间隔一段时间抓2个dump?我们先把问题放在这。
四、使用Windbg分析两个Dump文件,使用!runaway找到最消耗CPU时间片的线程,然后优化
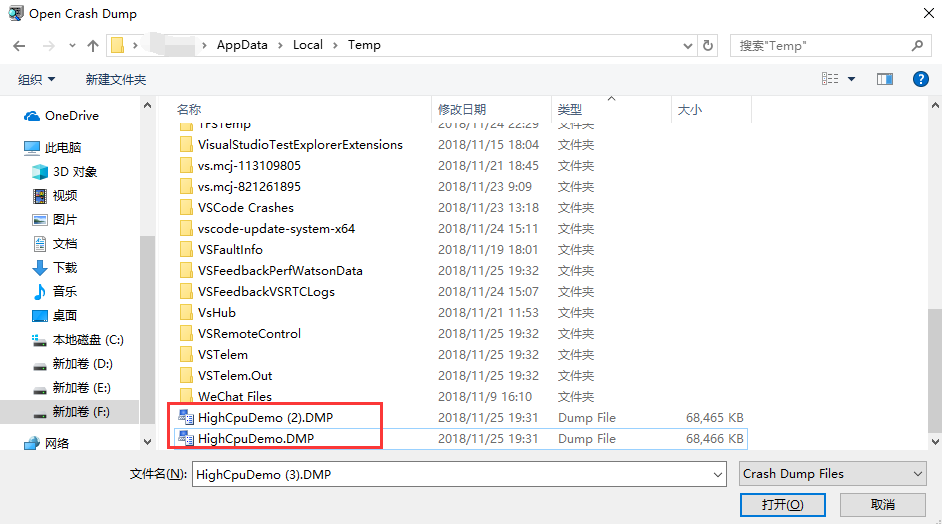
Windbg打开这两个Dump后,分别执行以下命令:
:> .loadby sos clr

:> !runaway
对比看着两个Dump的输出:
第一个Dump:
Debug session time: Sun Nov  20:16:39.000 2018 (GMT+8)

System Uptime:  days ::00.195

Process Uptime:  days ::31.000

.............................

Loading unloaded module list

.

ntdll!ZwDeviceIoControlFile+0x14:

00007ffc`c01b03a4 c3              ret

:> .loadby sos clr

:> !runaway

 User Mode Time

  Thread       Time

   :      0 days 0:07:38.531

   :325c       days ::00.390

   :       days ::00.015

   :4c3c       days ::00.000

   :17d0       days ::00.000

   :        days ::00.000

   :       days ::00.000
第二个Dump:
Debug session time: Sun Nov  20:17:06.000 2018 (GMT+8)

System Uptime:  days ::27.136

Process Uptime:  days ::58.000

.............................

Loading unloaded module list

.

ntdll!ZwDeviceIoControlFile+0x14:

00007ffc`c01b03a4 c3              ret

:> .loadby sos clr

:> !runaway

 User Mode Time

  Thread       Time

   :       days 0:08:01.984

   :325c       days ::00.406

   :       days ::00.015

   :4c3c       days ::00.000

   :17d0       days ::00.000

   :        days ::00.000

   :       days ::00.000
这里有个关键的Windbg指令 !runaway, 它有什么作用,输出的是什么:
This extension is a quick way to find out which threads are spinning out of control or consuming too much CPU time.

The display identifies each thread by the debugger's internal thread numbering and by the thread ID in hexadecimal. The debugger IDs are also shown.

Here is an example:

:> !runaway

 User Mode Time

 Thread       Time

 :55c        ::00.0093

 :1a4        ::00.0000

 Kernel Mode Time

 Thread       Time

 :55c        ::00.0140

 :1a4        ::00.0000

 Elapsed Time

 Thread       Time

 :55c        ::43.0533

 :1a4        ::25.0876
使用这个指令,可以查看每个线程的"用户态"CPU使用时间:
从上面两个Dump中,我们能看出,4号线程 User Mode Time 一直在增加,我们看看4号线程的堆栈:
:> ~4s

*** WARNING: Unable to verify checksum for System.Core.ni.dll

System_Core_ni+0x588b44:

00007ffc`a4268b44 488b4de8        mov     rcx,qword ptr [rbp-18h] ss:000000c1`df0ff2a8=000001d4633eb280

:> !clrstack

OS Thread Id: 0x3758 ()

        Child SP               IP Call Site

000000c1df0ff280 00007ffca4268b44 System.Linq.Enumerable.Min(System.Collections.Generic.IEnumerable`<Int32>)

000000c1df0ff2d0 00007ffc4b930660 *** WARNING: Unable to verify checksum for HighCpuDemo.exe

HighCpuDemo.Program.LongRunningMethod() [c:\users\zhougq\documents\visual studio \Projects\HighCpuDemo\Program.cs @ ]

000000c1df0ff3a0 00007ffca7e24770 System.Threading.ExecutionContext.RunInternal(System.Threading.ExecutionContext, System.Threading.ContextCallback, System.Object, Boolean) [f:\dd\ndp\clr\src\BCL\system\threading\executioncontext.cs @ ]

000000c1df0ff470 00007ffca7e24604 System.Threading.ExecutionContext.Run(System.Threading.ExecutionContext, System.Threading.ContextCallback, System.Object, Boolean) [f:\dd\ndp\clr\src\BCL\system\threading\executioncontext.cs @ ]

000000c1df0ff4a0 00007ffca7e245d2 System.Threading.ExecutionContext.Run(System.Threading.ExecutionContext, System.Threading.ContextCallback, System.Object) [f:\dd\ndp\clr\src\BCL\system\threading\executioncontext.cs @ ]

000000c1df0ff4f0 00007ffca7eacff2 System.Threading.ThreadHelper.ThreadStart() [f:\dd\ndp\clr\src\BCL\system\threading\thread.cs @ ]

000000c1df0ff748 00007ffcaaf35863 [GCFrame: 000000c1df0ff748]

000000c1df0ffa98 00007ffcaaf35863 [DebuggerU2MCatchHandlerFrame: 000000c1df0ffa98]
正如我们代码中所写的,LongRunningMethod方法一直在执行、消耗CPU资源。
定位到代码问题,就可以进一步修改代码,解决问题了。
以上就是使用Windbg 调试高CPU问题的方法思路,总结一下:
1. 查看应用进程的CPU使用率
2. 间隔一段时间,抓两个Dump
3. 使用Windbg分析两个Dump文件,使用!runaway找到最消耗CPU时间片的线程,然后优化
分享给大家。
周国庆
2018/11/25
Windbg程序调试系列5-高CPU问题分析的更多相关文章
- Windbg程序调试系列3-线程阻塞问题
上一篇博文给大家分享了使用Windbg分析内存泄露问题: Windbg程序调试系列2-内存泄露问题 本篇我们继续跟大家分享,如何分析解决线程阻塞问题. 从根本上讲,线程阻塞属于程序Hang的一种,其表 ...
- Windbg程序调试系列4-Live Debugging
上篇博文中给大家分享了使用Windbg分析线程阻塞问题: Windbg程序调试系列3-线程阻塞问题 本篇中我们继续,跟大家分享附加进程实时调试-Live Debugging. 先说一下使用Windbg ...
- Windbg程序调试系列-索引篇
最近整理了一下Windbg程序调试系列的文章,做个了索引贴,方便大家查询.搜索: Windbg程序调试系列1-常用命令说明&示例 Windbg程序调试系列1-Mex扩展使用总结 Windbg程 ...
- Windbg程序调试系列1-常用命令说明&示例
Windbg程序调试是.Net高级开发需要掌握的必备技能,分析内存泄露.分析高CPU.分析线程阻塞.分析内存对象.分析线程堆栈.Live Dedugging.这个领域可以说一个技能+场景化应用的结合, ...
- Windbg程序调试系列2-内存泄露问题
上篇文章给大家解释了Windbg的基本命令和说明,这一篇给大家介绍内存泄露场景的问题分析. 文章大纲: 描述问题背景和现象 确定问题是否是内存泄露 梳理问题分析思路 动手分析解决 总结 1. 先说问题 ...
- Windbg程序调试系列1-Mex扩展使用总结
最近一直在频繁使用Windbg做线上Dump调试,与微软做Case交流的时候,发现微软CSS团队,用了一个非常效率的Windbg 插件,Mex: 使用介绍: https://blogs.msdn.mi ...
- Windows程序调试系列: 使用VC++生成调试信息 转
Windows程序调试系列: 使用VC++生成调试信息 ZhangTao,zhangtao.it@gmail.com, 译自 “Generating debug information with Vi ...
- Windbg程序调试--转载
WinDbg是微软发布的一款相当优秀的源码级(source-level)调试工具,可以用于Kernel模式调试和用户模式调试,还可以调试Dump文件. WinDbg是微软很重要的诊断调试工具: 可以查 ...
- Expert 诊断优化系列------------------你的CPU高么?
现在很多用户被数据库的慢的问题所困扰,又苦于花钱请一个专业的DBA成本太高.软件维护人员对数据库的了解又不是那么深入,所以导致问题迟迟不能解决,或只能暂时解决不能得到根治.开发人员解决数据问题基本又是 ...
随机推荐
- django——CRM项目
1.引言 CRM,客户关系管理系统(Customer Relationship Management).企业用CRM技术来管理与客户之间的关系,以求提升企业成功的管理方式,其目的是协助企业管理销售循环 ...
- docker备份mongodb数据,导入导出
场景:服务器要升级,之前在linux部署的mongodb没有用docker,升级后,mongodb要用docker部署,并将原有的mongodb数据导入到docker部署的mongodb中. 1.在l ...
- selenium3+java+POM 跨浏览器测试之------读取配置文件
我们知道,web 测试的时候是需要切换不同的浏览器以查看每个功能在不同浏览器上的运行情况,使得开发的程序更具有健壮性.本文先总结一下如何通过读取配置文件来切换浏览器. 具体步骤如下: 一.编写配置文件 ...
- 利用PIL和Selenium实现页面元素截图
预备 照张相片 selenium.webdriver可以实现对显示页面的截图: from selenium import webdriver dr = webdriver.Firefox() dr.g ...
- laravel之ORM增删改查数据
1.首先在控制器中添加方法,然后添加路由,接着在模型中操作: 以下是模型 2.以下是控制器中的操作 一下是通过ORM进行更新 删除数据
- linux 文件 IO 目录操作及文件属性
///练习:实现列出某个目录中所有文件属性(文件大小,文件最后修改时间,文件名)//目录名由参数传入 ./dir /home/linux#include <sys/stat.h>#incl ...
- Hibernate 的hql查询简介【申明:来源于网络】
Hibernate 的hql查询简介[申明:来源于网络] Hibernate 的hql查询简介:http://blog.csdn.net/leaf_130/article/details/539329 ...
- ApiShell
using System; using System.Runtime.InteropServices; using HWND = System.IntPtr; using HANDLE = Syste ...
- OUTLOOK2019 解决 无法验证您连接到的服务器使用的安全证书
在配置好Outlook后,每次打开Outlook,都会弹框提醒“无法验证您连接到的服务器使用的安全证书”,网上搜的很多办法都无法解决,最后在微软的官方解答中找到了解决方案,分享给大家! 打开Out ...
- shell 爬取图片下载到本地
#!/bin/bash #ddmm // #if [ -z $string ] 如果string 为空 #-z STRING the length of STRING is zero read -p ...