
在OAF页面中集成ECharts以及highcharts用于显示图表
历史博文中有讲解在请求中输出基础图表的方式,见地址:EBS 请求输出Html报表集成Echarts
本文讲述在OAF中集成这两类图表。
集成的基本思路:在OAF页面中加入一个rawText组件,在rawText中加入html代码即可,如此简单。
步骤一:官网下载echarts,highcharts相应的js,放入OA_HTML路径(本例在OA_HTML中加入了文件夹cux)。
步骤二:写OAF页面及CO。
ECharts示例
EChartsPG
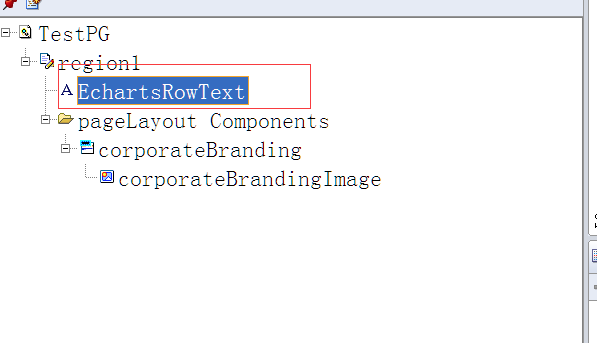
<?xml version = '1.0' encoding = 'UTF-8'?>

<page xmlns:jrad="http://xmlns.oracle.com/jrad" xmlns:oa="http://xmlns.oracle.com/oa" xmlns:ui="http://xmlns.oracle.com/uix/ui" version="10.1.3_" xml:lang="en-US" xmlns:user="http://xmlns.oracle.com/jrad/user" xmlns="http://xmlns.oracle.com/jrad" file-version="$Header$">

   <content>

      <oa:pageLayout id="region1" amDefName="bailian.oracle.apps.cux.test.server.TestAM" controllerClass="bailian.oracle.apps.cux.test.webui.TestPGCO" windowTitle="TEST PAGE" title="TEST PAGE">

         <ui:corporateBranding>

            <oa:image id="corporateBrandingImage" source="/OA_MEDIA/FNDSSCORP.gif"/>

         </ui:corporateBranding>

         <ui:contents>

            <oa:rawText id="EchartsRowText" text=""/>

         </ui:contents>

      </oa:pageLayout>

   </content>

</page>
对应的CO(本代码中只给出了静态数据示例):
package cux.oracle.apps.cux.test.webui;

import oracle.apps.fnd.common.VersionInfo;

import oracle.apps.fnd.framework.webui.OAControllerImpl;

import oracle.apps.fnd.framework.webui.OAPageContext;

import oracle.apps.fnd.framework.webui.beans.OARawTextBean;

import oracle.apps.fnd.framework.webui.beans.OAWebBean;

/**

 * Controller for ...

 */

public class TestPGCO extends OAControllerImpl

{

  public static final String RCS_ID="$Header$";

  public static final boolean RCS_ID_RECORDED =

        VersionInfo.recordClassVersion(RCS_ID, "%packagename%");

  /**

   * Layout and page setup logic for a region.

   * @param pageContext the current OA page context

   * @param webBean the web bean corresponding to the region

   */

  public void processRequest(OAPageContext pageContext, OAWebBean webBean)

  {

    super.processRequest(pageContext, webBean);

//      pageContext.removeJavaScriptLibrary("echarts");

      if(pageContext.getJavaScriptLibrary("echarts")==null){

          pageContext.putJavaScriptLibrary("echarts","cuxjs/echarts.min.js");

      }

      OARawTextBean rawTextBean =

          (OARawTextBean)webBean.findChildRecursive("EchartsRowText");

      if (rawTextBean != null) {

          String rawTextMessage = null;

          rawTextMessage = "<html>\n" +

          "<body>\n" +

          "    <!-- 为ECharts准备一个具备大小(宽高)的Dom -->\n" +

          "    <div id=\"main\" style=\"width: 600px;height:400px;\"></div>\n" +

          "    <script type=\"text/javascript\">\n" +

          "        // 基于准备好的dom,初始化echarts实例\n" +

          "        var myChart = echarts.init(document.getElementById('main'));\n" +

          "\n" +

          "        // 指定图表的配置项和数据\n" +

          "        var option = {\n" +

          "            title: {\n" +

          "                text: 'ECharts 入门示例'\n" +

          "            },\n" +

          "            tooltip: {},\n" +

          "            legend: {\n" +

          "                data:['销量']\n" +

          "            },\n" +

          "            xAxis: {\n" +

          "                data: [\"衬衫\",\"羊毛衫\",\"雪纺衫\",\"裤子\",\"高跟鞋\",\"袜子\"]\n" +

          "            },\n" +

          "            yAxis: {},\n" +

          "            series: [{\n" +

          "                name: '销量',\n" +

          "                type: 'bar',\n" +

          "                data: [5, 20, 36, 10, 10, 20]\n" +

          "            }]\n" +

          "        };\n" +

          "\n" +

          "        // 使用刚指定的配置项和数据显示图表。\n" +

          "        myChart.setOption(option);\n" +

          "    </script>\n" +

          "</body>\n" +

          "</html>";

          rawTextBean.setText(rawTextMessage);

      }

  }

  /**

   * Procedure to handle form submissions for form elements in

   * a region.

   * @param pageContext the current OA page context

   * @param webBean the web bean corresponding to the region

   */

  public void processFormRequest(OAPageContext pageContext, OAWebBean webBean)

  {

    super.processFormRequest(pageContext, webBean);

  }

}
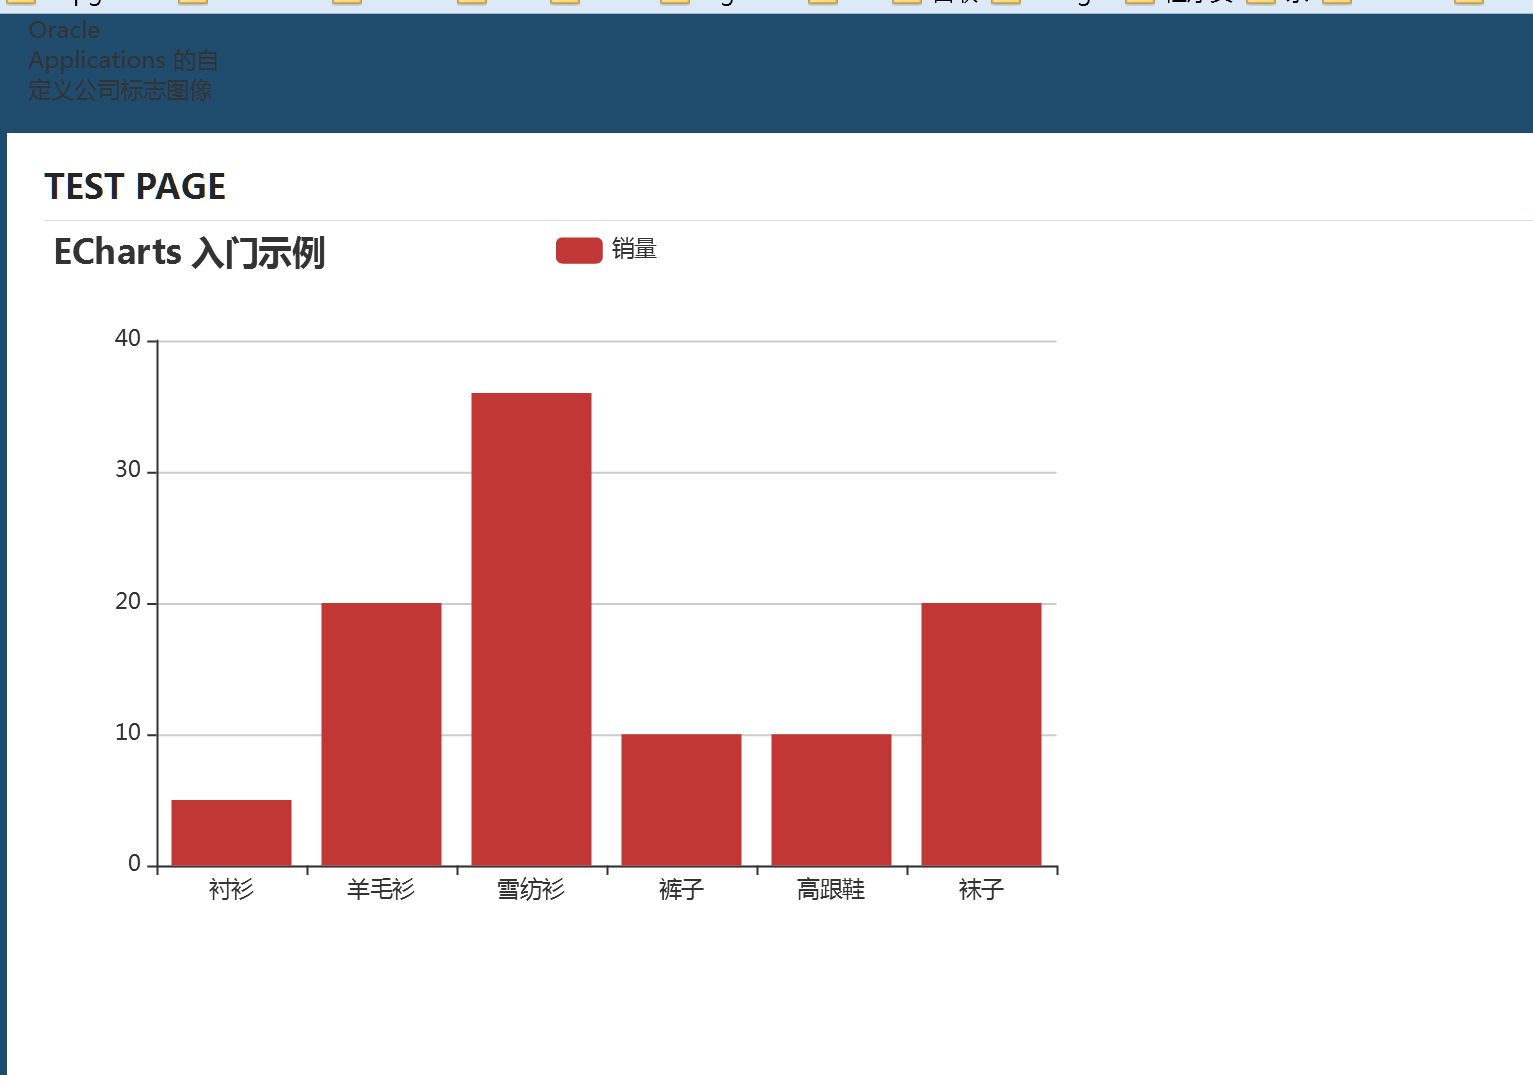
效果如下:
HCharts示例:
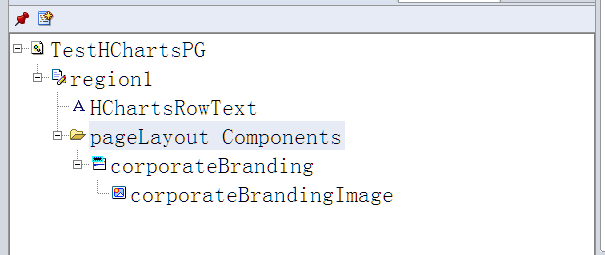
<?xml version = '1.0' encoding = 'UTF-8'?>

<page xmlns:jrad="http://xmlns.oracle.com/jrad" xmlns:oa="http://xmlns.oracle.com/oa" xmlns:ui="http://xmlns.oracle.com/uix/ui" version="10.1.3_" xml:lang="en-US" xmlns:user="http://xmlns.oracle.com/jrad/user" xmlns="http://xmlns.oracle.com/jrad" file-version="$Header$">

   <content>

      <oa:pageLayout id="region1" amDefName="bailian.oracle.apps.cux.test.server.TestAM" controllerClass="bailian.oracle.apps.cux.test.webui.TestHChartsPGCO" windowTitle="TEST PAGE" title="TEST PAGE">

         <ui:corporateBranding>

            <oa:image id="corporateBrandingImage" source="/OA_MEDIA/FNDSSCORP.gif"/>

         </ui:corporateBranding>

         <ui:contents>

            <oa:rawText id="HChartsRowText" text=""/>

         </ui:contents>

      </oa:pageLayout>

   </content>

</page>
对应的CO(本代码中只给出了静态数据示例):
package cux.oracle.apps.cux.test.webui;

import oracle.apps.fnd.common.VersionInfo;

import oracle.apps.fnd.framework.webui.OAControllerImpl;

import oracle.apps.fnd.framework.webui.OAPageContext;

import oracle.apps.fnd.framework.webui.beans.OARawTextBean;

import oracle.apps.fnd.framework.webui.beans.OAWebBean;

/**

 * Controller for ...

 */

public class TestHChartsPGCO extends OAControllerImpl

{

  public static final String RCS_ID="$Header$";

  public static final boolean RCS_ID_RECORDED =

        VersionInfo.recordClassVersion(RCS_ID, "%packagename%");

  /**

   * Layout and page setup logic for a region.

   * @param pageContext the current OA page context

   * @param webBean the web bean corresponding to the region

   */

  public void processRequest(OAPageContext pageContext, OAWebBean webBean)

  {

    super.processRequest(pageContext, webBean);

//      pageContext.removeJavaScriptLibrary("hcharts");

      if(pageContext.getJavaScriptLibrary("hcharts")==null){

          pageContext.putJavaScriptLibrary("hcharts","cuxjs/highcharts.js");

      };

      OARawTextBean rawTextBean =

          (OARawTextBean)webBean.findChildRecursive("HChartsRowText");

      if (rawTextBean != null) {

          String rawTextMessage = null;

          rawTextMessage =    "<html>\n" +

                              "<body>\n" +

                              "    <!-- 为HCharts准备一个具备大小(宽高)的Dom -->\n" +

                              "    <!--<div id=\"container\" style=\"width: 400px;height:400px;\"></div>-->\n" +

                              "    <div id=\"container\" style=\"width: 600px;min-width:400px;height:400px\"></div>\n" +

                              "    <script type=\"text/javascript\">\n" +

                              "        // 基于准备好的dom,初始化echarts实例\n" +

                              "        var chart = Highcharts.chart('container',{\n" +

                              "            chart: {\n" +

                              "                type: 'column'\n" +

                              "            },\n" +

                              "            credits: {\n" +

                              "                enabled:false\n" +

                              "            },\n" +

                              "            title: {\n" +

                              "                text: 'HCharts 入门示例'\n" +

                              "            },\n" +

                              "            xAxis: {\n" +

                              "                categories: [\n" +

                              "                    '衬衫','羊毛衫','雪纺衫','裤子','高跟鞋','袜子'\n" +

                              "                ],\n" +

                              "            },\n" +

                              "            yAxis: {\n" +

                              "                min: 0,\n" +

                              "                title: {\n" +

                              "                    text: '销量'\n" +

                              "                }\n" +

                              "            },\n" +

                              "            series: [{\n" +

                              "                name: '销量',\n" +

                              "                data: [5, 20, 36, 10, 10, 20]\n" +

                              "            }]\n" +

                              "        });\n" +

                              "    </script>\n" +

                              "</body>\n" +

                              "</html>";

          rawTextBean.setText(rawTextMessage);

      }

  }

  /**

   * Procedure to handle form submissions for form elements in

   * a region.

   * @param pageContext the current OA page context

   * @param webBean the web bean corresponding to the region

   */

  public void processFormRequest(OAPageContext pageContext, OAWebBean webBean)

  {

    super.processFormRequest(pageContext, webBean);

  }

}
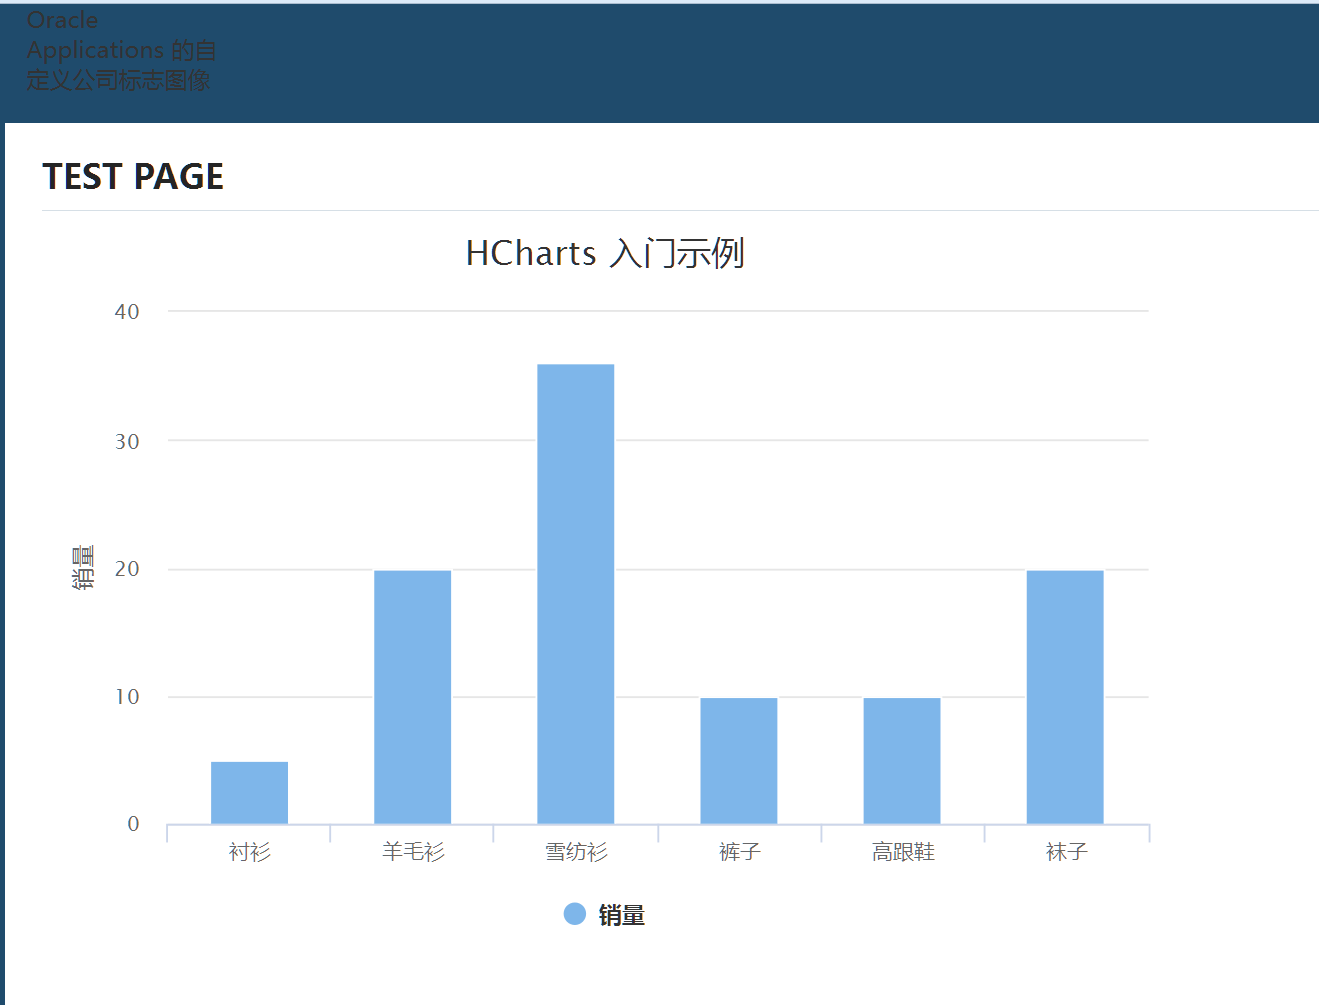
显示效果如下:
在OAF页面中集成ECharts以及highcharts用于显示图表的更多相关文章
- Asp.Net Core Razor页面中使用echarts展示图形
Asp.Net Core Razor页面中使用echarts展示图形 要在Razor页面中使用echarts显示图形,主要问题点在于如何将数据传递给js文件. 1,下载安装echarts库文件 首先引 ...
- VUE中集成echarts时 getAttribute of null错误
错误 错误场景一: 错误提示: 在运行Vue项目时出现了上述错误,出现该错误的原因是Echarts的图形容器还未生成就对其进行了初始化所造成的,代码如下: // 基于准备好的dom,初始化echart ...
- 润乾报表一个页面中的echarts地图与其他区块的联动
需求概述: DBD样式效果如下图所示,需要点击左侧地图中的地区,右侧的仪表盘,柱线图可以对应显示对应该地区的数据. 实现思路: 分别制作带有地图.仪表盘.柱线图的3张报表:将3张报表放到DBD中设置布 ...
- 系统管理模块_部门管理_改进_抽取添加与修改JSP页面中的公共代码_在显示层抽取BaseAction_合并Service层与Dao层
系统管理模块_部门管理_改进1:抽取添加与修改JSP页面中的公共代码 commons.jspf <%@ page language="java" import="j ...
- Selenium WebDriver-判断页面中某一元素是否已经显示,通常用于断言
判断界面中某一元素是否已经呈现,多用于断言,代码如下: #encoding=utf-8 import unittest import time from selenium import webdriv ...
- Django工程中使用echarts怎么循环遍历显示数据
前言: 后面要开发测试管理平台,需要用到数据可视化,所以研究了一下 先看下最后的图吧,单击最上方的按钮可以控制柱状图显隐 views.py # -*- coding: utf-8 -*- from _ ...
- struts2标签在jsp页面中构建map集合,循环显示
<s:radio name="gender" list="{'男', '女'}"></s:radio> <s:select nam ...
- Ionic2系列——在Ionic2中使用ECharts
在群里看到有人问怎么在Ionic2中集成ECharts来显示图表.当时答应说写个blog,简单写下步骤. 在TypeScript中如果要使用第三方库,必须要有d.ts,也就是定义文件,没有这个文件的话 ...
- Form_Form与OAF页面互相调用(案例)
2014-12-27 Created By BaoXinjian
随机推荐
- Kindle:自动追更之Calibre2脚本
#!/usr/bin/env python2 # vim:fileencoding=utf-8 from __future__ import unicode_literals, division, a ...
- Linux格式化、挂载及卸载数据盘
注意: 磁盘分区和格式化是高风险行为,请慎重操作.本文档描述如何处理一个新买的数据盘,如果您的数据盘上有数据,请务必对数据进行备份以避免可能的数据丢失. 服务器仅支持对 数据盘 进行分区,而不支持对 ...
- node获取当前路径的三种方法
node提供了3种获取路径的方法 ,在当前目录下,运行node const {resolve} = require('path') console.log('__dirname : ' + __di ...
- IP通信基础学习第三周(下)
TTL的最值是255. 数据部分不参与检验和的计算. 接收端的结果若为0,则保留:否则,会丢弃该数据报. IP数据报选项字段是可选的,主要用于网络测试和调试. IP辅助协议ICMP的消息类型有错误消息 ...
- Thanks David's Share
2019.4.12 Today, we got the invitation letter from US, when we discuss the journey, i saw perfect sh ...
- sai u 2016
再过20分钟,我就要结束2016年的工作回家过春节了.真是难过的一天啊,从来没有今天那么感受深刻,那么嫌弃时间太慢,没有归家心似箭,没有近乡情怯,只是好想,呵呵,来个午睡,来场电影,来点小说,哈哈哈. ...
- 微信省市区 Mysql数据库
$jsonStr = '[{"cities":["\u5b89\u5e86","\u868c\u57e0","\u4eb3\u5d ...
- Gatling实战(一)
对Gatling早有耳闻,据说比jmeter的性能要好很多,我第一次试用的时候因为本机安装的jdk版本不对无法跑起来,试用失败后,因为没时间就一直没继续研究了.我当时是去java官网下载最新的jdk覆 ...
- iperf 测试工具
Iperf是一个网络性能测试工具.Iperf可以测试TCP和UDP带宽质量.Iperf可以测量最大TCP带宽,具有多种参数和UDP特性. Iperf可以报告带宽,延迟抖动和数据包丢失.利用Iperf这 ...
- 20175307《Java程序设计》第5周学习总结
教材内容总结 6.1 接口 1接口声明 接口使用关键字interface来进行声明 eg:interface 接口的名字 2接口体 接口体中包含常量的声明和抽象方法两部分(没有变量) 注意一定的要 ...