学习ELK日志平台(一)
一、需求及基础:
场景:
1、开发人员不能登录线上服务器查看详细日志
2、各个系统都有日志,日志数据分散难以查找
3、日志数据量大,查询速度慢,或者数据不够实时
4、一个调用会涉及到多个系统,难以在这些协调中快速定位数据
二、ELS的概念:
elasticsearch:搜索引擎,提供索引,搜索功能
Logstash:接收,处理,转发日志
Kibana:独立的、美观的图形数据web界面
三、安装及配置
1、 elasticsearch安装
安装java环境,1.8.20或以上的版本
1、安装Java环境

tar xf jdk-8u201-linux-x64.tar.gz

vim /etc/profile

 export JAVA_HOME=/root/jdk

 export PATH=$JAVA_HOME/bin:$PATH

source  /etc/profile

2、安装elasticsearch

wget  https://download.elastic.co/elasticsearch/elasticsearch/elasticsearch-1.7.0.tar.gz

tar xf  elasticsearch-1.7.0.tar.gz

ln -s elasticsearch-1.7.0  /usr/local/elasticsearch

3、修改配置文件

grep -n  '^[a-z]' /usr/local/elasticsearch/config/elasticsearch.yml

 32:cluster.name: elasticsearch     #必须修改

 40:node.name: "stu02"              #必须修改

 47:node.master: true

 51:node.data: true

 107:index.number_of_shards: 5

 111:index.number_of_replicas: 1

 145:path.conf: /usr/local/elasticsearch/config

 149:path.data: /usr/local/elasticsearch/data

 159:path.work: /usr/local/elasticsearch/work

 163:path.logs: /usr/local/elasticsearch/logs

 167:path.plugins: /usr/local/elasticsearch/plugins

 184:bootstrap.mlockall: true

4、启动

/usr/local/elasticsearch/bin/elasticsearch -d   #(可加入参数,-Xms512m -Xmx512m)

netstat -lnt | egrep '9200|9300'

jps -lvm
测试:
curl 127.0.0.1:9200

curl  -i -XGET http://192.168.4.16:9200
安装ELS监控管理插件
1、离线安装插件

wget  http://download.elasticsearch.org/elasticsearch/marvel/marvel-latest.zip

/usr/local/elasticsearch/bin/plugin  -i marvel -u file:///tmp/marvel-latest.zip

2、在线安装插件

/usr/local/elasticsearch/bin/plugin  -i elasticsearch/marvel/latest/

/usr/local/elasticsearch/bin/plugin install mobz/elasticsearch-head

3、卸载插件

/usr/local/elasticsearch/bin/plugin  -r marvel
生产可能需要配置已下:
max_file_descriptors: 64000

/etc/sysctl.conf

sysctl -w vm_max_count=262144
2、 logstash安装
1、安装Java环境

tar xf jdk-8u201-linux-x64.tar.gz

vim /etc/profile

 export JAVA_HOME=/root/jdk

 export PATH=$JAVA_HOME/bin:$PATH

source  /etc/profile

2、安装logstash

wget https://download.elastic.co/logstash/logstash/logstash-1.5.3.tar.gz

tar xf logstash-1.5.3.tar.gz

ln -s /root/logstash-1.5.3/    /usr/local/logstash
标准输入和标准输出
/usr/local/logstash/bin/logstash -e 'input { stdin{} } output { stdout{} }'
使用ruby进行更详细的输出
/usr/local/logstash/bin/logstash -e 'input { stdin{} } output { stdout{codec => rubydebug}}'
输出到elasticsearch
/usr/local/logstash/bin/logstash -e 'input { stdin{} }   output {  elasticsearch
 { host => "192.168.4.16" protocol => "http"}  }'
读取日志并输出到/tmp下
vim   /etc/logstash/conf.d/logstash.conf
 input {

        file {

                path =>  "/tmp/messages"

        }

 }

 output {

        file {

                path => "/tmp/log-%{+YYYY-MM-dd}messages.gz"

                gzip => true

        }

 }
测试配置文件
/usr/local/logstash/bin/logstash -f /etc/logstash/conf.d/logstash.conf -t
启动服务
/usr/local/logstash/bin/logstash -f /etc/logstash/conf.d/logstash.conf
测试
cat /var/log/messages >> /tmp/messages
ll /tmp/log-2019-02-11messages.gz
把输出直接传输到elasticsearch
vim   /etc/logstash/conf.d/logstash.conf

 input {

        file {

                path =>  "/tmp/messages"

        }

 }

 output {

        file {

                path => "/tmp/log-%{+YYYY-MM-dd}.messages.gz"

                gzip => true

        }

        elasticsearch {

                host => ["192.168.4.16"]

                protocol => "http"

                index => "system-message-%{+YYYY.MM.dd}"

        }

}
在集群管理平台查看结果
打开浏览器输入:http://192.168.4.16:9200/_plugin/head/
将logstash输出给redis
一台logstash的配置文件
input {

       file {

               path =>"/tmp/messages"

       }

}

output {

      redis {

               data_type => "list"

               key => "system-message"

               host => "192.168.4.17"

               port => "6379"

               db => "0"

    }

}
另一台logstash的配置文件
input {

    redis {

        data_type => "list"

        key => "system-message"

        host => "192.168.4.17"

        port => "6379"

        db => "0"

    }

}

output {

    elasticsearch {

        host => ["192.168.4.16"]

        protocol => "http"

        index => "redis-message-%{+YYYY.MM.dd}"

    }

}
logstash日志json格式
安装nginx,将nginx的日志设置为json模式
log_format logstash_json '{"@timestamp":"$time_iso8601",' #定义日志格式logstash_json

        '"host":"$server_addr",'

        '"clientip":"$remote_addr",'

        '"size":$body_bytes_sent,'

        '"responsetime":$request_time,'

        '"upstreamtime":"$upstream_response_time",'

        '"upstreamhost":"$upstream_addr",'

        '"http_host":"$host",'

        '"url":"$uri",'

        '"domain":"$host",'

        '"xff":"$http_x_forwarded_for",'

        '"referer":"$http_referer",'

        '"agent":"$http_user_agent",'

        '"status":"$status"}';

access_log  /var/log/nginx/json.access.log  logstash_json;  #日志文件保存路径及使用上面定义的日志格式logstash_json
配置logstash将nginx的json日志并写入到redis
一台配置
input {

    file {

        path => "/var/log/nginx/json.access.log"  #读取指定的json格式的日志

        codec => "json"                           #指定json格式

    }

}


output {

    redis {

        data_type => "list"

        key => "nginx-json-log"                   #nginx的json格式日志的key名称

        host => "192.168.4.17"

        port => "6379"

        db => "1"

    }

}
另一台
input {

    redis {

        data_type => "list"

        key => "nginx-json-log"

        host => "192.168.4.17"

        port => "6379"

        db => "1"

    }

}

output {

    elasticsearch {

        host => ["192.168.4.16"]

        protocol => "http"

        index => "nginx-json-log-%{+YYYY.MM.dd}"

    }

}
使用ab访问nginx测试日志
ab -n1000 -c10 http://192.168.4.16:81 #一共1000个请求,每次并发10个,即100次请求完成
打开浏览器输入:http://192.168.4.16:9200/_plugin/head/
3、kibana安装
1、安装

wget https://download.elastic.co/kibana/kibana/kibana-4.1.1-linux-x64.tar.gz

tar xf kibana-4.1.1-linux-x64.tar.gz

ln -s /root/kibana-4.1.1-linux-x64/   /usr/local/kibana

2、修改配置

vim /usr/local/kibana/config/kibana.yml

elasticsearch_url: "http://192.168.4.16:9200"

pid_file: /var/run/kibana.pid

log_file: /usr/local/kibana/kibana.log

3、启动

/usr/local/kibana/bin/kibana    #直接启动

nohup /usr/local/kibana/bin/kibana  &  #后台启动
访问测试:默认监听端口5601
打开浏览器输入:http://192.168.4.16:5601
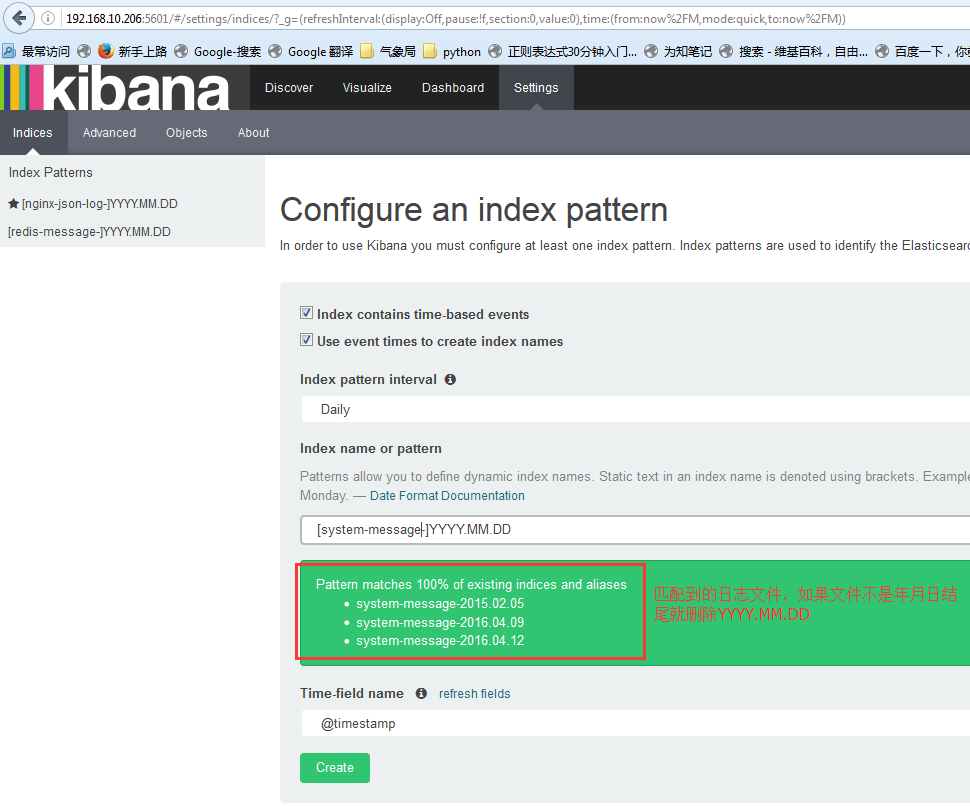
配置索引:索引的名称要和logstash的output生成的索引能进行匹配才可以
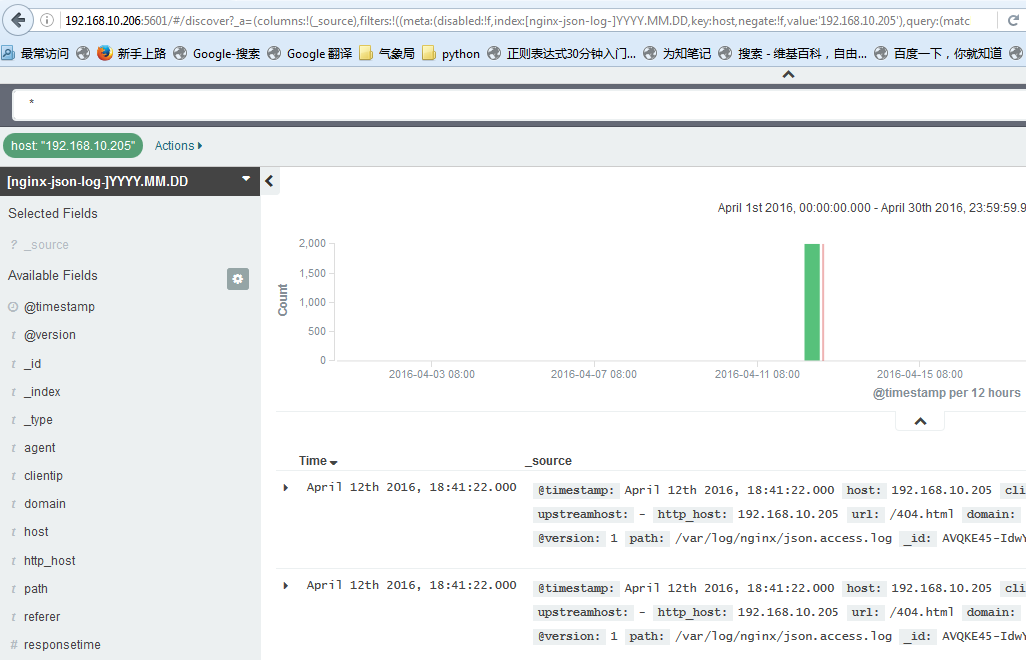
查看数据:默认显示最新的500个文档
数据精确搜索:
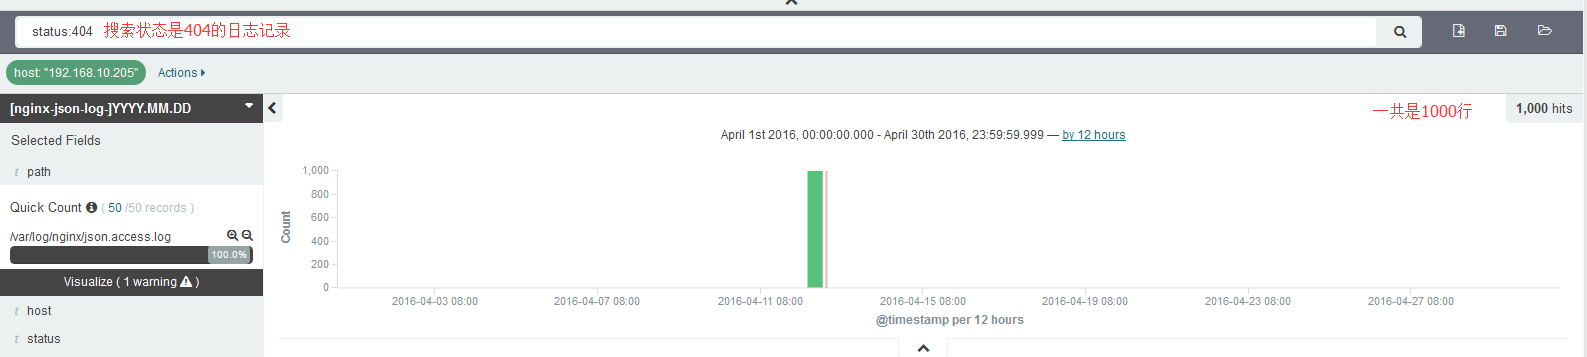
搜索高级语法:
status:404 OR status:500            #搜索状态是404或者是500之一的

status:301 AND status:200           #搜索即是301和200同时匹配的

status:[200 TO 300]               #搜索指定范围的
其他的常用模块:
1、系统日志收集---> syslog:配置syslog结果写入到elasticsearch,指定端口514,主机就是要收集日志的服务器IP地址,即可使用
2、访问日志:nginx转换成json格式
3、错误日志:使用codec插件:
https://www.elastic.co/guide/en/logstash/1.5/codec-plugins.html

input {

  stdin {

    codec => multiline {                       #多行日志,比如java的日志

      pattern => "^\s"  #pattern => ".*\t.*"   #找到换行符,会把多行认为是一行,即会把当前行和上一行合成一行,直到有换行符结束

      what => "previous"

    }

  }

}
4、运行日志 codec => json,如果不是json要使用grok进行匹配,相对比较麻烦,如果丢日志就看logstash.log,另外检查日志是否有效的json格式:
json效验地址:http://www.bejson.com/

5、kibana的时区和时间问题:kibana会自动根据浏览器将时间加8小时,通过logstash写入会自动解决,如果通过python脚本等写入会产生时间问题
6、在地图显示IP具体来源地址:
https://www.elastic.co/guide/en/logstash/1.5/filter-plugins.html
7、条件判断:
input {

  file {

    type => "apache"

    path => "/var/log/apache.log"

  }

  file {

    type => "tomcat"

    path => "/var/log/tomcat.log"

  }

}

filter {

  if [type] == "apache" { #假如索引为apache,就执行以下操作

    redis {

    data_type => "list"

    key => "system-message-jack"

    host => "192.168.10.205"

    port => "6379"

    db => "0"

    }

  if [type] == "tomcat" { #假如索引为tomcat,就执行一次操作

    redis {

    data_type => "list"

    key => "system-message-tomcat"

    host => "192.168.10.205"

    port => "6379"

    db => "1" #写不同的数据库

     }

}
测试logstash配置文件语法是否正确
/etc/init.d/logstash configtest
8、将tomcat日志的格式定义为json的格式:
directory="logs"  prefix="localhost_access_log." suffix=".log"

     pattern="{"client":"%h",  "client user":"%l",
               "authenticated":"%u",   "access time":"%t",
               "method":"%r",   "status":"%s",
               "send bytes":"%b",  "Query?string":"%q",
               "partner":"%{Referer}i",  "Agent version":"%{User-Agent}i"}"/>
取到的日志结果为:
{"client":"180.95.129.206", "client user":"-", "authenticated":"-", "access time":"[20/Apr/2016:03:47:40 +0000]", "method":"GET /image/android_logo.png HTTP/1.1", "status":"200", "send bytes":"1915", "Query string":"", "partner":"http://mobile.weathercn.com/index.do?id=101160101&partner=1000001003", "Agent version":"Mozilla/5.0 (Linux; U; Android 5.1.1; zh-cn; NX510J Build/LMY47V) AppleWebKit/537.36 (KHTML, like Gecko)Version/4.0 Chrome/37.0.0.0 MQQBrowser/6.6 Mobile Safari/537.36"}
学习ELK日志平台(一)的更多相关文章
- 学习ELK日志平台(二)
一.ELK介绍 1.1 elasticsearch 1.1.1 elasticsearch介绍 ElasticSearch是一个基于Lucene的搜索服务器.它提供了一个分布式多用户能力的全文搜索 ...
- 学习ELK日志平台(四)
一:需求及基础: 场景: 1.开发人员不能登录线上服务器查看详细日志 2.各个系统都有日志,日志数据分散难以查找 3.日志数据量大,查询速度慢,或者数据不够实时 4.一个调用会涉及到多个系统,难以在这 ...
- 学习ELK日志平台(三)
ELK(elasticsearch.logstash.kibana) Elastic Stack是原ELK Stack在5.0版本加入Beats套件后的新称呼 解决痛点: 开发人员不能登录线上serv ...
- 学习ELK日志平台(五)
ELK Stack 通常情况下: 1,开发人员是不能登录线上服务器查看日志信息 2,各个系统的日志繁多,日志数据分散难以查找 3,日志数据量较大,查询速度慢,数据不够实时性 4,一个调用会涉及到多个系 ...
- ELK 日志平台构建
elastic中文社区 https://elasticsearch.cn/ 完整参考 ELK实时日志分析平台环境部署--完整记录 https://www.cnblogs.com/kevingrace/ ...
- elk日志平台搭建小记
最近抽出点时间,搭建了新版本的elk日志平台 elastaicsearch 和logstash,kibana和filebeat都是5.6版本的 中间使用redis做缓存,版本为3.2 使用的系统为ce ...
- Springboot项目使用aop切面保存详细日志到ELK日志平台
上一篇讲过了将Springboot项目中logback日志插入到ELK日志平台,它只是个示例.这一篇来看一下实际使用中,我们应该怎样通过aop切面,拦截所有请求日志插入到ELK日志系统.同时,由于往往 ...
- Springboot项目搭配ELK日志平台
上一篇讲过了elasticsearch和kibana的可视化组合查询,这一篇就来看看大名鼎鼎的ELK日志平台是如何搞定的. elasticsearch负责数据的存储和检索,kibana提供图形界面便于 ...
- 亿级 ELK 日志平台构建部署实践
本篇主要讲工作中的真实经历,我们怎么打造亿级日志平台,同时手把手教大家建立起这样一套亿级 ELK 系统.日志平台具体发展历程可以参考上篇 「从 ELK 到 EFK 演进」 废话不多说,老司机们座好了, ...
随机推荐
- 【C# TAP 异步编程】四、SynchronizationContext 同步上下文|ExecutionContext
一.同步上下文(SynchronizationContext)概述 由来 多线程程序在.net框架出现之前就已经存在了.这些程序通常需要一个线程将一个工作单元传递给另一个线程.Windows程序以消息 ...
- oracle 11g rac修改监听端口(远程监听和本地监听)
转至:https://www.cnblogs.com/yj411511/p/12459533.html 目录 1.修改远程监听端口 1.1 查看远程监听状态 1.2 修改SCAN listener端口 ...
- oj教程--栈
栈(stack)又名堆栈,它是一种运算受限的线性表.其限制是仅允许在表的一端进行插入和删除运算.这一端被称为栈顶,相对地,把另一端称为栈底.向一个栈插入新元素又称作进栈.入栈或压栈,它是把新元素放到栈 ...
- WPS二级标题链接到一级标题
WPS二级标题链接到一级标题,即2后出现2.1 2.2而不是1.3 1.4什么的 样式中的编号什么的都不用动,默认即可,关键在于这些多级标题是否选择了同一个编号方式 WPS中,只需要将它们的编号选择为 ...
- C#10新特性-lambda 表达式和方法组的改进
C# 10 中对Lambda的语法和类型进行了多项改进: 1. Lambda自然类型 Lambda 表达式现在有时具有"自然"类型. 这意味着编译器通常可以推断出 lambda 表 ...
- 在线配置文档connectionStrings.com
在线配置文档网址:https://www.connectionstrings.com/ 用于查询以什么样的格式将连接信息写入配置文件时App.config 例如C#中写连接SQL Server的格式: ...
- Hive数仓
分层设计 ODS(Operational Data Store):数据运营层 "面向主题的"数据运营层,也叫ODS层,是最接近数据源中数据的一层,数据源中的数据,经过抽取.洗净. ...
- SQL从零到迅速精通【实用函数(2)】
1.对查询结果进行排序 查询stu_info表中所有学生信息,并按照成绩由高到底进行排序,输入语句如下. SELECT * FROM stu_info ORDER BY s_score DESC; ...
- c++ 11 线程池---完全使用c++ 11新特性
前言: 目前网上的c++线程池资源多是使用老版本或者使用系统接口实现,使用c++ 11新特性的不多,最近研究了一下,实现一个简单版本,可实现任意任意参数函数的调用以及获得返回值. 0 前置知识 首先介 ...
- Django-Multitenant,分布式多租户数据库项目实战(Python/Django+Postgres+Citus)
Python/Django 支持分布式多租户数据库,如 Postgres+Citus. 通过将租户上下文添加到您的查询来实现轻松横向扩展,使数据库(例如 Citus)能够有效地将查询路由到正确的数据库 ...