H5实现图表和地图
H5实现图表和地图的代码如下:
 <!DOCTYPE html>

 <html>

     <head>

         <title>图表和地图</title>

         <meta name="viewport" content="width=device-width, initial-scale=1.0, maximum-scale=1.0, minimum-scale=1.0, user-scalable=no" />

         <style type="text/css">

             html,body{

                 width:100%;

                 height:100%;

             }

             *{

                 margin:0px;

                 padding:0px;

             }

             body, button, input, select, textarea {

                 font: 12px/16px Verdana, Helvetica, Arial, sans-serif;

             }

             p{

                 width:603px;

                 padding-top:3px;

                 overflow:hidden;

             }

             .btn{

                 width:142px;

             }

             #container{

                 width:100%;

                 height:300px;

             }

         </style>

     </head>

     <body>

         <div id="main" style="width: 100%;height:400px;"></div>

         <div id="container"style="margin-bottom: 50px"></div>

         <script type="text/javascript" src="asset/js/jquery-2.2.4.js"></script>

         <script type="text/javascript" src="asset/js/echarts.min.js"></script>

         <script charset="utf-8" src="https://map.qq.com/api/js?v=2.exp&key=IZJBZ-PAUKF-YQOJ6-JM4TR-T3RT5-N6BM5"></script>

         <script charset="utf-8" src="https://map.qq.com/api/js?v=2.exp&key=IZJBZ-PAUKF-YQOJ6-JM4TR-T3RT5-N6BM5&libraries=drawing,geometry,place,convertor,visualization"></script>

         <script type="text/javascript">

         // 基于准备好的dom,初始化echarts实例

         var myChart = echarts.init(document.getElementById('main'));

         // 指定图表的配置项和数据

         myChart.setOption({

                 xAxis: {

                   type: 'category',

                   data: [1,2,3,4,5],

                   axisLabel:{

                     textStyle:{

                       fontSize:8

                     }

                   }

                 },

                 yAxis: {

                   type: 'value',

                   axisLabel:{

                     formatter:'{value}℃',

                     textStyle:{

                       fontSize:8

                     }

                   }

                 },

                 series: [

                   {

                     data: [20,30,50,60,30],

                     type: 'line',

                     smooth: true,

                     symbol: 'none',//去掉小圆点

                     itemStyle: {

                       normal: {

                         color: '#537FE2',

                         lineStyle: {

                           color: '#537FE2'

                         }

                       }

                     }

                   },

                   {

                     data: [10,10,10,10,10],

                     type: 'line',

                     smooth: false,

                     symbol: 'none',//去掉小圆点

                     itemStyle:{

                       normal:{

                         lineStyle:{

                           width:2,

                           type:'dotted',  //'dotted'虚线 'solid'实线

                           color:'#2BB4DF'

                         }

                       }

                     }

                   },

                   {

                     data: [60,60,60,60,60],

                     type: 'line',

                     smooth: false,

                     symbol: 'none',//去掉小圆点

                     itemStyle:{

                       normal:{

                         lineStyle:{

                           width:2,

                           type:'dotted',  //'dotted'虚线 'solid'实线

                           color:'#2BB4DF'

                         }

                       }

                     }

                   },

                 ],

               })

       </script>

       <script>

         window.onload = function(){

         //直接加载地图

         //初始化地图函数  自定义函数名init

         function init() {

             //定义map变量 调用 qq.maps.Map() 构造函数   获取地图显示容器

             var map = new qq.maps.Map(document.getElementById("container"), {

                 center: new qq.maps.LatLng(39.910,116.399),  // 地图的中心地理坐标。

                 zoom:14//地图的中心地理坐标。

             });

             var polyline = new qq.maps.Polyline({

                 path: [

                     new qq.maps.LatLng(39.915, 116.399),

                     new qq.maps.LatLng(39.920, 116.389),

                     new qq.maps.LatLng(39.930, 116.399)

                 ],

                 strokeColor: '#000000',

                 strokeWeight: 2,

                 map

             });

             var marker = new qq.maps.Marker({

                 position: new qq.maps.LatLng(39.920,116.380),

                 map: map,

             });

                var anchor = new qq.maps.Point(0, 39),

                   size = new qq.maps.Size(42, 68),

                   origin = new qq.maps.Point(0, 0),

                   markerIcon = new qq.maps.MarkerImage(

               "https://3gimg.qq.com/lightmap/api_v2/2/4/99/theme/default/imgs/marker.png",

               size,

               origin,

               anchor

             );

             marker.setIcon(markerIcon);

         }

         //调用初始化函数地图

         init();

         }

         </script>

     </body>

 </html>
手机端效果图如下:
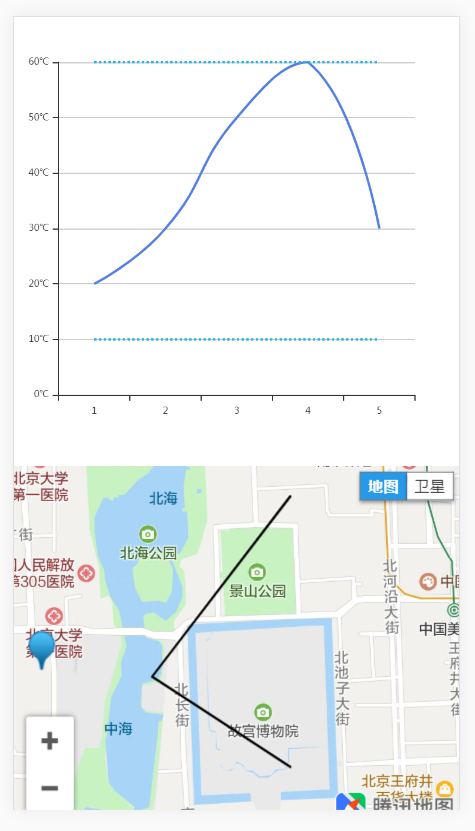
我们对以上代码进行分析,
图表使用了echarts,引入了echarts.min.js。
地图用的是腾讯地图,引用了线上的两个库。
 <script charset="utf-8" src="https://map.qq.com/api/js?v=2.exp&key=IZJBZ-PAUKF-YQOJ6-JM4TR-T3RT5-N6BM5"></script>

 <script charset="utf-8" src="https://map.qq.com/api/js?v=2.exp&key=IZJBZ-PAUKF-YQOJ6-JM4TR-T3RT5-N6BM5&libraries=drawing,geometry,place,convertor,visualization"></script>
图表是折线图,设置好x轴(xAxis)的数据,
 xAxis: {

   type: 'category',

   data: [1,2,3,4,5],

   axisLabel:{

     textStyle:{

       fontSize:8

     }

   }

 },
在formatter里设置y轴的单位,
 yAxis: {

   type: 'value',

   axisLabel:{

     formatter:'{value}℃',

     textStyle:{

       fontSize:8

     }

   }

 },
然后设置y轴(yAxis)的数据。
 series: [

   {

     data: [20,30,50,60,30],

     type: 'line',

     smooth: true,

     symbol: 'none',//去掉小圆点

     itemStyle: {

       normal: {

         color: '#537FE2',

         lineStyle: {

           color: '#537FE2'

         }

       }

     }

   },

   {

     data: [10,10,10,10,10],

     type: 'line',

     smooth: false,

     symbol: 'none',//去掉小圆点

     itemStyle:{

       normal:{

         lineStyle:{

           width:2,

           type:'dotted',  //'dotted'虚线 'solid'实线

           color:'#2BB4DF'

         }

       }

     }

   },

   {

     data: [60,60,60,60,60],

     type: 'line',

     smooth: false,

     symbol: 'none',//去掉小圆点

     itemStyle:{

       normal:{

         lineStyle:{

           width:2,

           type:'dotted',  //'dotted'虚线 'solid'实线

           color:'#2BB4DF'

         }

       }

     }

   },

 ],
可以画出多条折线,并设置颜色、虚实线、是否加上小圆点等状态。
地图则可以设置中心坐标,
 //定义map变量 调用 qq.maps.Map() 构造函数   获取地图显示容器

 var map = new qq.maps.Map(document.getElementById("container"), {

     center: new qq.maps.LatLng(39.910,116.399),  // 地图的中心地理坐标。

     zoom:14//地图的中心地理坐标。

 });
并根据多个点的坐标画出路径线(polyline),
 var polyline = new qq.maps.Polyline({

     path: [

         new qq.maps.LatLng(39.915, 116.399),

         new qq.maps.LatLng(39.920, 116.389),

         new qq.maps.LatLng(39.930, 116.399)

     ],

     strokeColor: '#000000',

     strokeWeight: 2,

     map

 });
然后可以设置标记(marker)的位置和更换标记的图标。
 var marker = new qq.maps.Marker({

     position: new qq.maps.LatLng(39.920,116.380),

     map: map,

 });

      var anchor = new qq.maps.Point(0, 39),

       size = new qq.maps.Size(42, 68),

       origin = new qq.maps.Point(0, 0),

       markerIcon = new qq.maps.MarkerImage(

   "https://3gimg.qq.com/lightmap/api_v2/2/4/99/theme/default/imgs/marker.png",

   size,

   origin,

   anchor

 );

 marker.setIcon(markerIcon);
代码示例地址:https://github.com/LuoYiHao/chart-and-map。
H5实现图表和地图的更多相关文章
- AGS API for JavaScript 图表上地图
原文:AGS API for JavaScript 图表上地图 图1 图2 图3 -------------------------------------华丽丽的分割线--------------- ...
- uniapp H5引入腾讯地图
在网上搜索了许多关于uniapp引入腾讯地图的方法都以失败告终,我开发的应用主要使用于H5,小程序与H5是不同的sdk,就不在这说了,况且小程序有手把手教学,可参考腾讯地图官网https://lbs. ...
- H5微信通过百度地图API实现导航方式二
要有服务器才行哦 <!DOCTYPE html><html><head> <meta http-equiv="Content-Type&quo ...
- H5微信通过百度地图API实现导航方式一
根据业务需求修改百度API,实现微信中的导航功能.因为源码中SearchInfoWindow_min.js有点小问题(部分小城市公交线路少,查不到路线时没有提示),所以这里在源码的基础上改了一点点.可 ...
- 微信H5页面嵌入百度地图---解决手机的webKit定位,ios系统对非https网站不提供支持问题
<script type="text/javascript" src="http://api.map.baidu.com/api?v=2.0&ak=yGQt ...
- H5调用腾讯地图
获取当前定位的经纬度并在容器内显示当前位置 (安卓上的位置有点偏差) 在vue的index.html中需要引用 template <div id="container" st ...
- H5页面,百度地图点击事件
需求:用户点击地图的时候获取地址街道,编码等详细信息. 然后看百度API文档,看到了click事件,关键时候还是需要看文档的. 实现 这样子虽然在浏览器的手机模拟器下是没有问题的 但是放在机器上测试的 ...
- h5跳转高德地图
<a href="https://uri.amap.com/marker?position=经度,纬度&name=所在的位置名称">高德地图</a>
- h5画图表
折线: <!DOCTYPE html><html lang="en"><head> <meta charset="UTF-8&q ...
随机推荐
- jenkins插件之Publish Over SSH的使用
1,安装 在插件管理选项搜索Publish Over SSH,然后点击安装即可完成 2,安装完成之后,就可以在jenkins的配置系统中找到Publish Over SSH 配置完服务器之后,然后在项 ...
- Python + opencv 实现图片文字的分割
实现步骤: 1.通过水平投影对图形进行水平分割,获取每一行的图像: 2.通过垂直投影对分割的每一行图像进行垂直分割,最终确定每一个字符的坐标位置,分割出每一个字符: 先简单介绍一下投影法:分别在水平和 ...
- Android Studio [跑马灯]
MainActivity package com.xdw.secondapp; import android.graphics.Paint; import android.support.v7.app ...
- Multiple types were found that match the controller named 'Auth'.
偶然的一个机会,修改了已经开发完毕的一个项目的命名.突然运行发现: { "Message": "An error has occurred.", "E ...
- 性能优化:虚拟列表,如何渲染10万条数据的dom,页面同时不卡顿
列表大概有2万条数据,又不让做成分页,如果页面直接渲染2万条数据,在一些低配电脑上可能会照成页面卡死,基于这个需求,我们来手写一个虚拟列表 思路 列表中固定只显示少量的数据,比如60条 在列表滚动的时 ...
- python自动化测试三部曲之untitest框架
终于等到十一,有时间写博客了,准备利用十一这几天的假期把这个系列的博客写完 该系列文章本人准备写三篇博客 第一篇:介绍python自动化测试框架unittest 第二篇:介绍django框架+requ ...
- jar 命令使用
1.jar命令一般用来对jar包文件处理,jar包是由JDK安装目录\bin\jar.exe命令生成的,当我们安装好JDK,设置好path路径,就可以正常使用jar.exe命令,它会用lib\tool ...
- 利用python爬虫关键词批量下载高清大图
前言 在上一篇写文章没高质量配图?python爬虫绕过限制一键搜索下载图虫创意图片!中,我们在未登录的情况下实现了图虫创意无水印高清小图的批量下载.虽然小图能够在一些移动端可能展示的还行,但是放到pc ...
- Shell之Glob和RE的区别
目录 Shell之Glob和RE的区别 参考 Glob RE Shell之Glob和RE的区别
- 开发电商平台用PHP语言和JAVA语言有什么区别?哪种语言更好?
现在很多行业都通过电子商务拓展业务,所以商城系统开发成为很多企业的刚性需求.一般有一点技术基础的客户应该知道目前商城系统开发主流语言有两个,PHP和Java.那么很多客户朋友会纠结是选择哪个语言开发好 ...