
Spring Boot 2.X(十六):应用监控之 Spring Boot Actuator 使用及配置
Actuator 简介
Actuator 是 Spring Boot 提供的对应用系统的自省和监控功能。通过 Actuator,可以使用数据化的指标去度量应用的运行情况,比如查看服务器的磁盘、内存、CPU等信息,系统的线程、gc、运行状态等等。
Actuator 通常通过使用 HTTP 和 JMX 来管理和监控应用,大多数情况使用 HTTP 的方式。
Actuator 端点说明
| 端点 | 描述 |
|---|---|
| auditevents | 获取当前应用暴露的审计事件信息 |
| beans | 获取应用中所有的 Spring Beans 的完整关系列表 |
| caches | 获取公开可以用的缓存 |
| conditions | 获取自动配置条件信息,记录哪些自动配置条件通过和没通过的原因 |
| configprops | 获取所有配置属性,包括默认配置,显示一个所有 @ConfigurationProperties 的整理列版本 |
| env | 获取所有环境变量 |
| flyway | 获取已应用的所有Flyway数据库迁移信息,需要一个或多个 Flyway Bean |
| liquibase | 获取已应用的所有Liquibase数据库迁移。需要一个或多个 Liquibase Bean |
| health | 获取应用程序健康指标(运行状况信息) |
| httptrace | 获取HTTP跟踪信息(默认情况下,最近100个HTTP请求-响应交换)。需要 HttpTraceRepository Bean |
| info | 获取应用程序信息 |
| integrationgraph | 显示 Spring Integration 图。需要依赖 spring-integration-core |
| loggers | 显示和修改应用程序中日志的配置 |
| logfile | 返回日志文件的内容(如果已设置logging.file.name或logging.file.path属性) |
| metrics | 获取系统度量指标信息 |
| mappings | 显示所有@RequestMapping路径的整理列表 |
| scheduledtasks | 显示应用程序中的计划任务 |
| sessions | 允许从Spring Session支持的会话存储中检索和删除用户会话。需要使用Spring Session的基于Servlet的Web应用程序 |
| shutdown | 关闭应用,要求endpoints.shutdown.enabled设置为true,默认为 false |
| threaddump | 获取系统线程转储信息 |
| heapdump | 返回hprof堆转储文件 |
| jolokia | 通过HTTP公开JMX bean(当Jolokia在类路径上时,不适用于WebFlux)。需要依赖 jolokia-core |
| prometheus | 以Prometheus服务器可以抓取的格式公开指标。需要依赖 micrometer-registry-prometheus |
Actuator 使用及配置
快速使用
项目依赖
<dependencies>

		<dependency>

			<groupId>org.springframework.boot</groupId>

			<artifactId>spring-boot-starter-web</artifactId>

		</dependency>

        <!-- actuator -->

		<dependency>

			<groupId>org.springframework.boot</groupId>

			<artifactId>spring-boot-starter-actuator</artifactId>

		</dependency>

</dependencies>
配置文件
management.endpoints.enabled-by-default=true

#启动所有端点

management.endpoints.web.exposure.include=*

#自定义管理端点路径

#management.endpoints.web.base-path=/manage
Spring Boot 2.X 中,Actuator 默认只开放 health 和 info 两个端点。
添加management.endpoints.web.exposure.include=*配置后启动应用,访问 http://127.0.0.1:8080/actuator 我们可以看到所有的 Actuator 端点列表。
如果将management.endpoints.enabled-by-default设置为false,则禁用所有端点,如需启用则如下:
management.endpoints.enabled-by-default=false

management.endpoint.info.enabled=true
禁用的端点将从应用程序上下文中完全删除。如果只想更改公开端点,使用include和exclude属性。使用如下:
management.endpoints.web.exposure.include=*

management.endpoints.web.exposure.exclude=env,beans
management.endpoints.web.base-path=/manage 配置表示将 /actuator 路径重定义为 /manage。
常用端点详解
health
主要用来检测应用的运行状况,是使用最多的一个监控点。监控软件通常使用该接口实时监测应用运行状况,在系统出现故障时把报警信息推送给相关人员,如磁盘空间使用情况、数据库和缓存等的一些健康指标。
默认情况下 health 端点是开放的,访问 http://127.0.0.1:8080/actuator/health 即可看到应用运行状态。
{"status":"UP"}
如果需要看到详细信息,则需要做添加配置:
management.endpoint.health.show-details=always
访问返回信息如下:
{"status":"UP","details":{"diskSpace":{"status":"UP","details":{"total":180002725888,"free":8687988736,"threshold":10485760}}}}
info
查看应用信息是否在 application.properties 中配置。如我们在项目中配置是:
info.app.name=Spring Boot Actuator Demo

info.app.version=v1.0.0

info.app.description=Spring Boot Actuator Demo
启动项目,访问 http://127.0.0.1:8080/actuator/info 返回信息如下:
{"app":{"name":"Spring Boot Actuator Demo","version":"v1.0.0","description":"Spring Boot Actuator Demo"}}
env
通过 env 可以获取到所有关于当前 Spring Boot 应用程序的运行环境信息,如:操作系统信息(systemProperties)、环境变量信息、JDK 版本及 ClassPath 信息、当前启用的配置文件(activeProfiles)、propertySources、应用程序配置信息(applicationConfig)等。
可以通过 http://127.0.0.1:8080/actuator/env/{name} ,name表示想要查看的信息,可以独立显示。
beans
访问 http://127.0.0.1:8080/actuator/beans 返回部分信息如下:
{

    "contexts": {

        "Spring Boot Actuator Demo": {

            "beans": {

                "endpointCachingOperationInvokerAdvisor": {

                    "aliases": [

                    ],

                    "scope": "singleton",

                    "type": "org.springframework.boot.actuate.endpoint.invoker.cache.CachingOperationInvokerAdvisor",

                    "resource": "class path resource [org/springframework/boot/actuate/autoconfigure/endpoint/EndpointAutoConfiguration.class]",

                    "dependencies": [

                        "environment"

                    ]

                },

                "defaultServletHandlerMapping": {

                    "aliases": [

                    ],

                    "scope": "singleton",

                    "type": "org.springframework.web.servlet.HandlerMapping",

                    "resource": "class path resource [org/springframework/boot/autoconfigure/web/servlet/WebMvcAutoConfiguration$EnableWebMvcConfiguration.class]",

                    "dependencies": [

                    ]

                },

                ...

            }

        }

    }

}
从返回的信息中我们可以看出主要展示了 bean 的别名、类型、是否单例、类的地址、依赖等信息。
conditions
通过 conditions 可以在应用运行时查看代码了某个配置在什么条件下生效,或者某个自动配置为什么没有生效。
访问 http://127.0.0.1:8080/actuator/conditions 返回部分信息如下:
{

    "contexts": {

        "Spring Boot Actuator Demo": {

            "positiveMatches": {

                "SpringBootAdminClientAutoConfiguration": [

                    {

                        "condition": "OnWebApplicationCondition",

                        "message": "@ConditionalOnWebApplication (required) found 'session' scope"

                    },

                    {

                        "condition": "SpringBootAdminClientEnabledCondition",

                        "message": "matched"

                    }

                ],

                "SpringBootAdminClientAutoConfiguration#metadataContributor": [

                    {

                        "condition": "OnBeanCondition",

                        "message": "@ConditionalOnMissingBean (types: de.codecentric.boot.admin.client.registration.metadata.CompositeMetadataContributor; SearchStrategy: all) did not find any beans"

                    }

                ],

                ...

            }

        }

    }

}
loggers
获取系统的日志信息。
访问 http://127.0.0.1:8080/actuator/loggers 返回部分信息如下:
{

    "levels": [

        "OFF",

        "ERROR",

        "WARN",

        "INFO",

        "DEBUG",

        "TRACE"

    ],

    "loggers": {

        "ROOT": {

            "configuredLevel": "INFO",

            "effectiveLevel": "INFO"

        },

        "cn": {

            "configuredLevel": null,

            "effectiveLevel": "INFO"

        },

        "cn.zwqh": {

            "configuredLevel": null,

            "effectiveLevel": "INFO"

        },

        "cn.zwqh.springboot": {

            "configuredLevel": null,

            "effectiveLevel": "INFO"

        },

        ...

    }

}
mappings
查看所有 URL 映射,即所有 @RequestMapping 路径的整理列表。
访问 http://127.0.0.1:8080/actuator/mappings 返回部分信息如下:
{

    "contexts": {

        "Spring Boot Actuator Demo": {

            "mappings": {

                "dispatcherServlets": {

                    "dispatcherServlet": [

                        {

                            "handler": "ResourceHttpRequestHandler [class path resource [META-INF/resources/], class path resource [resources/], class path resource [static/], class path resource [public/], ServletContext resource [/], class path resource []]",

                            "predicate": "/**/favicon.ico",

                            "details": null

                        },

                        ...

                    ]

                }

            }

        }

    }

}
heapdump
访问:http://127.0.0.1:8080/actuator/heapdump会自动生成一个 GZip 压缩的 Jvm 的堆文件 heapdump,我们可以使用 JDK 自带的 Jvm 监控工具 VisualVM 打开此文件查看。如图:
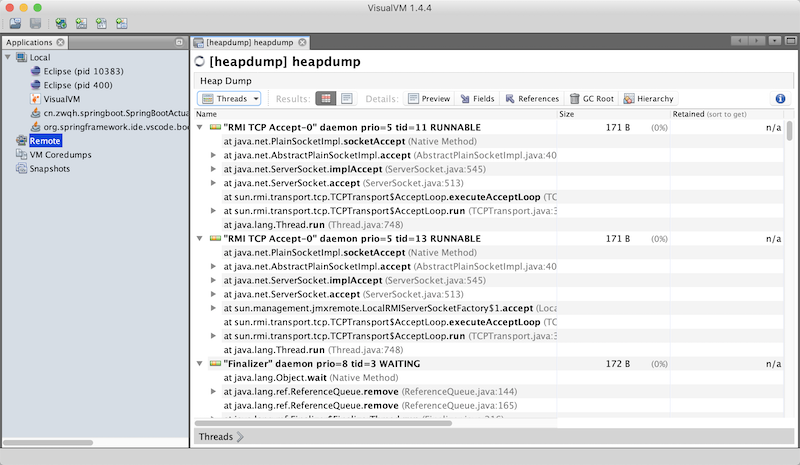
VisualVM下载:https://visualvm.github.io/download.html
threaddump
获取系统线程的转储信息,主要展示了线程名、线程ID、线程的状态、是否等待锁资源等信息。在工作中,我们可以通过查看线程的情况来排查相关问题。
访问 http://127.0.0.1:8080/actuator/threaddump 返回部分信息如下:
{

    "threads": [

        {

            "threadName": "DestroyJavaVM",

            "threadId": 40,

            "blockedTime": -1,

            "blockedCount": 0,

            "waitedTime": -1,

            "waitedCount": 0,

            "lockName": null,

            "lockOwnerId": -1,

            "lockOwnerName": null,

            "inNative": false,

            "suspended": false,

            "threadState": "RUNNABLE",

            "stackTrace": [

            ],

            "lockedMonitors": [

            ],

            "lockedSynchronizers": [

            ],

            "lockInfo": null

        },

        ...

    ]

}
shutdown
开启可以接口关闭 Spring Boot 应用,要使用这个功能需要做如下配置:
management.endpoint.shutdown.enabled=true
可以通过 post(仅支持 post) 请求访问 http://127.0.0.1:8080/actuator/shutdown 关闭应用。
metrics
访问 http://127.0.0.1:8080/actuator/metrics 可以获取系统度量指标信息项如下:
{

    "names": [

        "jvm.memory.max",

        "jvm.threads.states",

        "jvm.gc.pause",

        "http.server.requests",

        "process.files.max",

        "jvm.gc.memory.promoted",

        "system.load.average.1m",

        "jvm.memory.used",

        "jvm.gc.max.data.size",

        "jvm.memory.committed",

        "system.cpu.count",

        "logback.events",

        "tomcat.global.sent",

        "jvm.buffer.memory.used",

        "tomcat.sessions.created",

        "jvm.threads.daemon",

        "system.cpu.usage",

        "jvm.gc.memory.allocated",

        "tomcat.global.request.max",

        "tomcat.global.request",

        "tomcat.sessions.expired",

        "jvm.threads.live",

        "jvm.threads.peak",

        "tomcat.global.received",

        "process.uptime",

        "tomcat.sessions.rejected",

        "process.cpu.usage",

        "tomcat.threads.config.max",

        "jvm.classes.loaded",

        "jvm.classes.unloaded",

        "tomcat.global.error",

        "tomcat.sessions.active.current",

        "tomcat.sessions.alive.max",

        "jvm.gc.live.data.size",

        "tomcat.threads.current",

        "process.files.open",

        "jvm.buffer.count",

        "jvm.buffer.total.capacity",

        "tomcat.sessions.active.max",

        "tomcat.threads.busy",

        "process.start.time"

    ]

}
对应访问 names 中的指标,可以查看具体的指标信息。如访问 http://127.0.0.1:8080/actuator/metrics/jvm.memory.used 返回信息如下:
{

    "name": "jvm.memory.used",

    "description": "The amount of used memory",

    "baseUnit": "bytes",

    "measurements": [

        {

            "statistic": "VALUE",

            "value": 1.16828136E8

        }

    ],

    "availableTags": [

        {

            "tag": "area",

            "values": [

                "heap",

                "nonheap"

            ]

        },

        {

            "tag": "id",

            "values": [

                "Compressed Class Space",

                "PS Survivor Space",

                "PS Old Gen",

                "Metaspace",

                "PS Eden Space",

                "Code Cache"

            ]

        }

    ]

}
示例代码
参考文档
https://docs.spring.io/spring-boot/docs/2.2.1.RELEASE/reference/html/production-ready-features.html
非特殊说明,本文版权归 朝雾轻寒 所有,转载请注明出处.
原文标题:Spring Boot 2.X(十六):应用监控之 Spring Boot Actuator 使用及配置
原文地址:https://www.zwqh.top/article/info/25
如果文章对您有帮助,请扫码关注下我的公众号,文章持续更新中...

Spring Boot 2.X(十六):应用监控之 Spring Boot Actuator 使用及配置的更多相关文章
- Spring Security(三十六):12. Spring MVC Test Integration
Spring Security provides comprehensive integration with Spring MVC Test Spring Security提供与Spring MVC ...
- Spring Security(二十六):8. Spring Security Community
8.1 Issue Tracking Spring Security uses JIRA to manage bug reports and enhancement requests. If you ...
- 二十六:Struts2 和 spring整合
二十六:Struts2 和 spring整合 将项目名称为day29_02_struts2Spring下的scr目录下的Struts.xml文件拷贝到新项目的scr目录下 在新项目的WebRoot-- ...
- Spring Boot 2.X(十七):应用监控之 Spring Boot Admin 使用及配置
Admin 简介 Spring Boot Admin 是 Spring Boot 应用程序运行状态监控和管理的后台界面.最新UI使用vue.js重写里. Spring Boot Admin 为已注册的 ...
- RabbitMQ入门教程(十六):RabbitMQ与Spring集成
原文:RabbitMQ入门教程(十六):RabbitMQ与Spring集成 版权声明:本文为博主原创文章,遵循CC 4.0 BY-SA版权协议,转载请附上原文出处链接和本声明. 本文链接:https: ...
- Spring Boot2 系列教程(十六)定时任务的两种实现方式
在 Spring + SpringMVC 环境中,一般来说,要实现定时任务,我们有两中方案,一种是使用 Spring 自带的定时任务处理器 @Scheduled 注解,另一种就是使用第三方框架 Qua ...
- spring boot(十六)使用Jenkins部署spring boot
jenkins是devops神器,本篇文章介绍如何安装和使用jenkins部署Spring Boot项目 jenkins搭建 部署分为三个步骤: 第一步,jenkins安装 第二步,插件安装和配置 第 ...
- Spring Boot教程(十六)属性配置文件详解(1)
相信很多人选择Spring Boot主要是考虑到它既能兼顾Spring的强大功能,还能实现快速开发的便捷.我们在Spring Boot使用过程中,最直观的感受就是没有了原来自己整合Spring应用时繁 ...
- 学习Spring Boot:(十六)使用Shiro与JWT 实现认证服务
前言 需要把Web应用做成无状态的,即服务器端无状态,就是说服务器端不会存储像会话这种东西,而是每次请求时access_token进行资源访问.这里我们将使用 JWT 1,基于散列的消息认证码,使用一 ...
随机推荐
- Requests实践详解
Requests是什么 Requests是用python语言基于urllib编写的,采用的是Apache2 Licensed开源协议的HTTP库 如果你看过上篇文章关于urllib库的使用,你会发现, ...
- B-概率论-熵和信息增益
目录 熵和信息增益 一.熵(Entropy) 二.条件熵(Conditional Entropy) 三.联合熵(Joint Entropy) 四.相对熵(Relative Entropy) 4.1 相 ...
- SEER流量众筹模块开发测试网络及使用文档发布
SEER利用区块链奖励机制,可解决传统体育赛事痛点,提高行业运转效率.比如提高赛事方收入,让观众自由选择想看的比赛,给予赛事众筹的参与者贡献影响力,使其获得由智能合约量化的激励等.此功能可广泛应用于包 ...
- GO 第一个程序Hello world
第一个程序:HelloWorld 一.go项目工程结构 配置好工作目录后,就可以编码开发了,在这之前,我们看下go的通用项目结构,这里的结构主要是源代码相应地资源文件存放目录结构. 1.1 gopat ...
- Unreal Engine 4 系列教程 Part 2:蓝图教程
.katex { display: block; text-align: center; white-space: nowrap; } .katex-display > .katex > ...
- drf框架serializers中ModelSerializer类简化序列化和反序列化操作
0905自我总结 drf框架serializers中ModelSerializer类 基于seriallizer类进行简化 https://www.cnblogs.com/pythonywy/p/11 ...
- Mysql多数据库备份
备份数据脚本 #!/bin/bash # date是linux的一个命令 date [参数] [+格式] time=` date +%Y_%m_%d_%H_%M_%S ` # 备份输出路径 backu ...
- 渗透测试中Linux下反弹shell的认识
最近老是觉得自己白天工作累,晚上理应休息 堕落了几天才发觉自己真垃圾,加紧向前吧. 0x00 前言 在平时渗透还是工作中经常会遇到shell反弹的情况,网上一搜反弹shell都是一大堆,但是真正遇到反 ...
- 快速傅里叶变换(FFT)略解
前言 如果我们能用一种时间上比 \(O(n^2)\) 更优秀的方法来计算大整数(函数)的乘法,那就好了.快速傅里叶变换(FFT) 可以帮我们在 \(O(n\log n)\) 的时间内解决问题. 函数乘 ...
- Hash Table Implementation in C++
对于字符串,所用的hash函数为: size_t _Hash_bytes(const void* ptr, size_t len, size_t seed) { static const size_t ...