Affinity Propagation Demo1学习
利用AP算法进行聚类:
首先导入需要的包:
from sklearn.cluster import AffinityPropagation

from sklearn import metrics

from sklearn.datasets.samples_generator import make_blobs
生成一组数据:
centers = [[1, 1], [-1, -1], [1, -1]]

X, labels_true = make_blobs(n_samples=300, centers=centers, cluster_std=0.5, random_state=0)
以上代码包括3个类簇的中心点以及300个以这3个点为中心的样本点。
接下来要利用AP算法对这300个点进行聚类。
af = AffinityPropagation(preference=-50).fit(X) # preference采用负的欧氏距离

cluster_centers_indices = af.cluster_centers_indices_

labels = af.labels_  # 样本标签

n_clusters_ = len(cluster_centers_indices) # 类簇数
打印各种评价指标分数:
print('估计的类簇数: %d' % n_clusters_)

print('Homogeneity: %0.3f' % metrics.homogeneity_score(labels_true, labels))

print('Completeness: %0.3f' %metrics.completeness_score(labels_true, labels))

print('V-measure: %0.3f' %metrics.v_measure_score(labels_true, labels))

print('Adjusted Rand Index:%0.3f' %metrics.adjusted_rand_score(labels_true, labels))

print('Adjusted Mutual Information:%0.3f'%metrics.adjusted_mutual_info_score(labels_true, labels))

print('Silhouette Coefficient:%0.3f' %metrics.silhouette_score(X, labels, metric='sqeuclidean')) # sqeuclidean欧式距离平方
可视化聚类结果:
导入画图需要的包:
import matplotlib.pyplot as plt

from itertools import cycle

plt.close('all')

plt.figure(1)

plt.clf() # 清除当前图的所有信息

colors = cycle('bgrcmykbgrcmykbgrcmykbgrcmyk')
close()方法介绍【可忽略】
close方法简介:

matplotlib.pyplot.close(*args)   --- Close a figure window.

close() by itself closes the current figure

close(fig) closes the Figure instance fig

close(num) closes the figure number num

close(name) where name is a string, closes figure with that label

close('all') closes all the figure windows
for k, col in zip(range(n_clusters_),colors):

    class_members = labels == k;

    print('k:',k)

    print('labels:',labels)

    print('cls_member--------',class_members)

  cluster_center = X[cluster_centers_indices[k]]

  print('cluster_center:', cluster_center)

   # 画样本点

  plt.plot(X[class_members, 0], X[class_members, 1], col + '.')

  # 画中心点

  plt.plot(cluster_center[0], cluster_center[1], 'o',

         markeredgecolor='k', markersize=28)


# 划线

  for x in X[class_members]:

      plt.plot([cluster_center[0], x[0]], [cluster_center[1], x[1]], col)

plt.title('Estimated number of clusters:%d' %n_clusters_)

plt.show()# 显示图
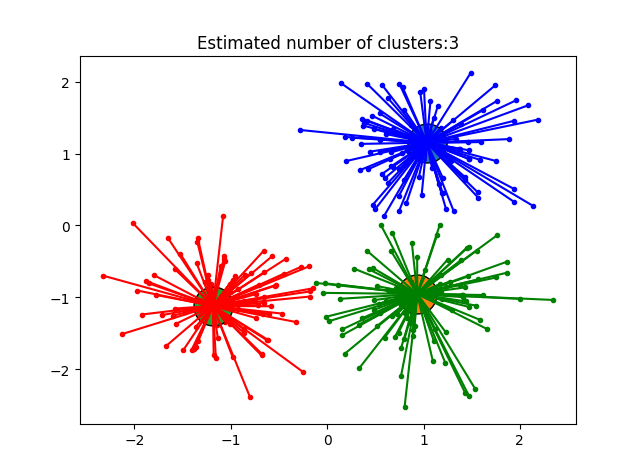
运行结果:
完整代码:
print(__doc__)

from sklearn.cluster import AffinityPropagation

from sklearn import metrics

from sklearn.datasets.samples_generator import make_blobs

# #################################################

# generate sample data

centers = [[1, 1], [-1, -1], [1, -1]]

X, labels_true = make_blobs(n_samples=300, centers=centers, cluster_std=0.5, random_state=0)

# #######################################################

# Compute Affinity Propagation

af = AffinityPropagation(preference=-50).fit(X) # preference采用负的欧氏距离

cluster_centers_indices = af.cluster_centers_indices_

labels = af.labels_  # 样本标签

n_clusters_ = len(cluster_centers_indices) # 类簇数

print('估计的类簇数: %d' % n_clusters_)

print('Homogeneity: %0.3f' % metrics.homogeneity_score(labels_true, labels))

print('Completeness: %0.3f' %metrics.completeness_score(labels_true, labels))

print('V-measure: %0.3f' %metrics.v_measure_score(labels_true, labels))

print('Adjusted Rand Index:%0.3f' %metrics.adjusted_rand_score(labels_true, labels))

print('Adjusted Mutual Information:%0.3f'%metrics.adjusted_mutual_info_score(labels_true, labels))

print('Silhouette Coefficient:%0.3f' %metrics.silhouette_score(X, labels, metric='sqeuclidean')) # sqeuclidean欧式距离平方

# ##########################################################

# Plot result

import matplotlib.pyplot as plt

from itertools import cycle

plt.close('all')

plt.figure(1)

plt.clf()

colors = cycle('bgrcmykbgrcmykbgrcmykbgrcmyk')

for k, col in zip(range(n_clusters_),colors):

    class_members = labels == k;

    print('k:',k)

    print('labels:',labels)

    print('cls_member--------',class_members)

    cluster_center = X[cluster_centers_indices[k]]

    print('cluster_center:', cluster_center)

    plt.plot(X[class_members, 0], X[class_members, 1], col + '.')

    plt.plot(cluster_center[0], cluster_center[1], 'o',

             markeredgecolor='k', markersize=28)

    # 划线

    for x in X[class_members]:

        plt.plot([cluster_center[0], x[0]], [cluster_center[1], x[1]], col)

plt.title('Estimated number of clusters:%d' %n_clusters_)

plt.show()
Affinity Propagation Demo1学习的更多相关文章
- Affinity Propagation Demo2学习【可视化股票市场结构】
这个例子利用几个无监督的技术从历史报价的变动中提取股票市场结构. 使用报价的日变化数据进行试验. Learning a graph structure 首先使用sparse inverse(相反) c ...
- AP(affinity propagation)研究
待补充…… AP算法,即Affinity propagation,是Brendan J. Frey* 和Delbert Dueck于2007年在science上提出的一种算法(文章链接,维基百科) 现 ...
- Affinity Propagation Algorithm
The principle of Affinity Propagation Algorithm is discribed at above. It is widly applied in many f ...
- Affinity Propagation
1. 调用方法: AffinityPropagation(damping=0.5, max_iter=200, convergence_iter=15, copy=True, preference=N ...
- AP聚类算法(Affinity propagation Clustering Algorithm )
AP聚类算法是基于数据点间的"信息传递"的一种聚类算法.与k-均值算法或k中心点算法不同,AP算法不需要在运行算法之前确定聚类的个数.AP算法寻找的"examplars& ...
- knn/kmeans/kmeans++/Mini Batch K-means/Affinity Propagation/Mean Shift/层次聚类/DBSCAN 区别
可以看出来除了KNN以外其他算法都是聚类算法 1.knn/kmeans/kmeans++区别 先给大家贴个简洁明了的图,好几个地方都看到过,我也不知道到底谁是原作者啦,如果侵权麻烦联系我咯~~~~ k ...
- [Python] 机器学习库资料汇总
声明:以下内容转载自平行宇宙. Python在科学计算领域,有两个重要的扩展模块:Numpy和Scipy.其中Numpy是一个用python实现的科学计算包.包括: 一个强大的N维数组对象Array: ...
- 【转帖】Python在大数据分析及机器学习中的兵器谱
Flask:Python系的轻量级Web框架. 1. 网页爬虫工具集 Scrapy 推荐大牛pluskid早年的一篇文章:<Scrapy 轻松定制网络爬虫> Beautiful Soup ...
- python数据挖掘领域工具包
原文:http://qxde01.blog.163.com/blog/static/67335744201368101922991/ Python在科学计算领域,有两个重要的扩展模块:Numpy和Sc ...
随机推荐
- 16.用pycharm导入自己写的模块时,import无法识别的解决办法
我们用pycharm打开自己写的代码,当多个文件之间有相互依赖的关系的时候,import无法识别自己写的文件,但是我们写的文件又确实在同一个文件夹中, 这种问题可以用下面的方法解决: 1)打开File ...
- MySQL数据库(三)
前提要述:参考书籍<MySQL必知必会> 2.1 MySQL简介 2.1.1 什么是MySQL MySQL是一种关系数据库管理系统.负责数据库中数据的存储,检索,管理和处理. 2.1.2 ...
- js以当前时间为基础,便捷获取时间(最近2天,最近1周,最近2周,最近1月,最近2月,最近半年,最近一年,本周,本月,本年)
在开发公司管理后台系统时,遇到了需要根据不同的时间段如"近一年.近半年.近三月.近一月.近一周"来获取并展示不同图表数据的需求,很是繁琐,项目开发周期又非常的短,自己想了一下,虽然 ...
- EF 使用lambda表达式 更新一对多数据时报错
1.需求 更新一对多表中的附表数据,表结构如下: 2.思路 个人觉得一个个去对比关联的附表数据是删除还是添加比较麻烦,就直接清空主表关联的附表,然后重新建立关联关系. 3.弊端 如果附表(前提是附表 ...
- C# 调用R语言
在.net项目中需要调用Matlab生成的DLL,但是在调用过程中报错,截图如下: 在网上搜索一下资料,看到该博客:https://cn.mathworks.com/matlabcentral/new ...
- 【5min+】 秋名山的竞速。 ValueTask 和 Task
系列介绍 简介 [五分钟的dotnet]是一个利用您的碎片化时间来学习和丰富.net知识的博文系列.它所包含了.net体系中可能会涉及到的方方面面,比如C#的小细节,AspnetCore,微服务中的. ...
- 1z0-062 题库解析3
The hr user executes the following query on the employees table but does not issue commit, rollback, ...
- SEATA 分布式事务入门DEMO
Simple Extensible Autonomous Transacation Architecture,seata是简单的.可扩展.自主性高的分布式架构 SEATA Server Configu ...
- cogs 1583. [POJ 3237] 树的维护 树链剖分套线段树
1583. [POJ 3237] 树的维护 ★★★★ 输入文件:maintaintree.in 输出文件:maintaintree.out 简单对比时间限制:5 s 内存限制:128 ...
- springcloud之断路器(Hystrix)
在微服务架构中,根据业务来拆分成一个个的服务,服务与服务之间可以相互调用(RPC),在Spring Cloud可以用RestTemplate+Ribbon和Feign来调用.为了保证其高可用,单个服务 ...