vue + echarts画圈圈
<div class="chart-bar-left" id= "chartbar-left" style="margin-top:1%;">
v-chart :options="optionPieleft" class="chart-pie-left"/>
</div>
<script> //添加引用
import ECharts from "vue-echarts";
import "echarts/lib/component/polar";
// 引入提示框和标题组件
import "echarts/lib/component/tooltip";
import "echarts/lib/component/title";
//引用legend组件
import "echarts/lib/component/legend";
//引入饼图
import "echarts/lib/chart/pie"; var placeHolderStyle = {
ormal: {
color: 'rgba(44,59,70,1)', // 未完成的圆环的颜色
label: {
show: false
},
labelLine: {
show: false
}
},
emphasis: {
color: 'rgba(44,59,70,1)' // 未完成的圆环的颜色
}
}; var linear_color_left = {
type: 'linear',
x: 0,
y: 0,
x2: 0,
y2: 1,
colorStops: [{
offset: 0,
color: '#0986e8'
}, {
offset: 1,
color: '#4cd8f4'
}]
}; export default {
components: {
"v-chart": ECharts
},
name: 'Dashboard',
data(){
return{
optionPie : {
backgroundColor: '#FFFFFF',
title: {
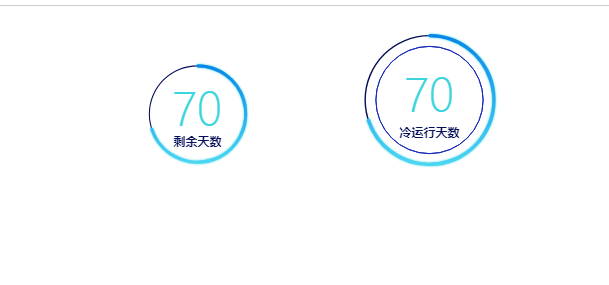
text: "冷运行天数",
textStyle: {
color: '#050f58',
fontSize: 12, },
left: 'center',
top:'98'
},
series: [{
//最里圈圆环
type: 'pie',
radius: ['75%', '75%'],
silent: true,
itemStyle: {
normal: {
labelLine: {
show: false
}
}
},
data: [{
value: 1,
itemStyle: {
normal: {
color: '#050f58',
borderColor: '#162abb',
//borderWidth: 1,
//shadowBlur: 5,
shadowColor: 'rgba(21,41,185,.75)'
}
}
}]
},{
type: 'pie',
radius: ['89%', '91%'],
silent: false,
label: {
normal: {
show: false,
}
},
data: [{
value: 1,
itemStyle: {
normal: {
color: '#050f58',
barBorderRadius: 30,
// shadowBlur: 50,
shadowColor: 'rgba(21,41,185,.75)'
}
}
}]
}, {
name: '占比',
type: 'pie',
radius: ['89%', '91%'],
hoverAnimation: false,
data: [{
value: 70, //已完成
show: false,
label: {
normal: {
formatter: '{d}', position: 'center',
show: true,
textStyle: {
fontSize: '45',
fontWeight: '200',
color: '#3dd4de',
margin:'00',
}
}
}, itemStyle: {
normal: {
color: linear_color_left,
shadowColor: '#3dd4de',
shadowBlur: 2,
borderWidth: 2,
borderColor:linear_color_left
}
}
}, {
value: 30,//剩余
show: false,
itemStyle: {
normal: {
barBorderRadius: 50,
color: 'rgba(10,9,86,0)', // 未完成的圆环的颜色
label: {
show: false
},
labelLine: {
show: false
}
},
}
}] }]
},
}
}
}
</script>
画完张这样
vue + echarts画圈圈的更多相关文章
- Vue中使用ECharts画散点图加均值线与阴影区域
[本文出自天外归云的博客园] 需求 1. Vue中使用ECharts画散点图 2. 在图中加入加均值线 3. 在图中标注出阴影区域 实现 实现这个需求,要明确两点: 1. 知道如何在vue中使用ech ...
- vue+vuex+axios+echarts画一个动态更新的中国地图
一. 生成项目及安装插件 # 安装vue-cli npm install vue-cli -g # 初始化项目 vue init webpack china-map # 切到目录下 cd china- ...
- 使用echarts画一个类似组织结构图的图表
昨天,写了一篇关于圆环进度条的博客(请移步:Vue/React圆环进度条),已经烦不胜烦,今天又遇到了需要展示类似公司的组织结构图的功能需求,要冒了!!! 这种需求,自己用div+css也是可以实现的 ...
- java动态画圈圈。运用多线程,绘图
总结:只是意外的收获吧.之前一篇是老师教的,一个点,从底层开始升起,到鼠标按下的地方开始画圈圈, 现在改变了一下,因为点上升的一个循环和画圈的循环是分开的 现在让点点自己跑,并且边跑边画圈.而且在fo ...
- Vue Echarts 饼图设置默认选中一个
Vue Echarts 饼图设置默认选中一个 myChart.setOption(data) // data伟echarts所需要传入的参数,就是配置参数最多的那个玩意 myChart.dispatc ...
- vue echarts 给双饼图添加点击事件
在用 echarts 画旭双饼图( https://www.echartsjs.com/examples/zh/editor.html?c=pie-nest )的时候,经常会伴随着点击事件 如果想要在 ...
- 在vue中使用Echarts画曲线图(异步加载数据)
现实的工作中, 数据不可能写死的,所有的数据都应该通过发送请求进行获取. 所以本项目的需求是请求服务器获得二维数组,并生成曲线图.曲线图的横纵坐标均从获得的数据中取得. Echarts官方文档: ht ...
- vue中使用echarts画饼状图
echarts的中文文档地址:https://echarts.baidu.com/tutorial.html#5%20%E5%88%86%E9%92%9F%E4%B8%8A%E6%89%8B%20EC ...
- vue用echarts 画3d地球 且画线
页面效果如下: 项目结构如下: 引入的包 "dependencies": { "core-js": "^3.3.2", "regi ...
随机推荐
- mysql迁移之巨大数据量快速迁移方案
mysql迁移之巨大数据量快速迁移方案-增量备份及恢复 --chenjianwen 一.前言: 当mysql库的大小达到几十个G或者上百G,迁移起来是一件非常费事的事情,业务中断,导出导入耗费大量的时 ...
- [Python] numpy.Matrix
import numpy as np np.matrix('1, 2; 3, 4') #1, 2 #3, 4 np.matrix([[1,2],[3,4]]) #1, 2 #3, 4
- django-DIL模板自定义过滤器,自定义标签,自定义包含标签
自定义过滤器 DTL模板语言生来只是为了方便的展示信息,所以与编程语言相比显得有点薄弱,有时候不能满足我们的需求.因此django提供了一个接口,让开发者能自定义标签和过滤器. 首先,你需要添加一个t ...
- django2.0实现数据详情页展示的流程
思路整理 1 先在urls.py中,定义路由获取的格式 url(r'^detail/(\d+)/$', views.blog_detail), 2 然后在views.py,定义数据获取的方法 def ...
- 设置myeclipse文件的打开格式
- 【327】Python 中 PIL 实现图像缩放
参考:Python 中使用PIL中的resize 进行缩放 参考:Python用Pillow(PIL)进行简单的图像操作(模糊.边缘增强.锐利.平滑等) 参考:廖雪峰 - Pillow 实现代码如下: ...
- 使用java代码编辑oracle数据库
package com.hanqi; import java.io.IOException; import java.sql.Connection; import java.sql.DriverMan ...
- java多线程启动的方法runnable和callable
- 我们为什么要在 PHPStorm 中标记目录
问题来源 (1)要开发的项目位于PHPStorm打开的项目的二级目录下,使用PHPStorm来开发Laravel项目 提供的教程在代码自动定位和智能提醒方面,存在无效的情况: (2)使用gulp作为项 ...
- Zookeeper 目录
Zookeeper 目录 Zookeeper 致力于提供一个高性能.高可用,且具有严格的顺序访问控制能力(主要是写操作的严格顺序性)的分布式协调服务.以下是我整理的笔记. 一.分布式理论基础 1.1 ...