A guide to analyzing Python performance
来源:http://www.huyng.com/posts/python-performance-analysis/
While it’s not always the case that every Python program you write will require a rigorous performance analysis, it is reassuring to know that there are a wide variety of tools in Python’s ecosystem that one can turn to when the time arises.
Analyzing a program’s performance boils down to answering 4 basic questions:
- How fast is it running?
- Where are the speed bottlenecks?
- How much memory is it using?
- Where is memory leaking?
Below, we’ll dive into the details of answering these questions using some awesome tools.
Coarse grain timing with time
Let’s begin by using a quick and dirty method of timing our code: the good old unix utility time.
$ time python yourprogram.py

real    0m1.028s

user    0m0.001s

sys     0m0.003s
The meaning between the three output measurements are detailed in thisstackoverflow article, but in short
- real - refers to the actual elasped time
- user - refers to the amount of cpu time spent outside of kernel
- sys - refers to the amount of cpu time spent inside kernel specific functions
You can get a sense of how many cpu cycles your program used up regardless of other programs running on the system by adding together the sys and user times.
If the sum of sys and user times is much less than real time, then you can guess that
most your program’s performance issues are most likely related to IO waits.
Fine grain timing with a timing context manager
Our next technique involves direct instrumentation of the code to get access to finer grain timing information. Here’s a small snippet I’ve found invaluable for making ad-hoc timing measurements:
timer.py
import time

class Timer(object):

    def __init__(self, verbose=False):

        self.verbose = verbose

    def __enter__(self):

        self.start = time.time()

        return self

    def __exit__(self, *args):

        self.end = time.time()

        self.secs = self.end - self.start

        self.msecs = self.secs * 1000  # millisecs

        if self.verbose:

            print 'elapsed time: %f ms' % self.msecs
In order to use it, wrap blocks of code that you want to time with Python’s withkeyword and this Timer context
manager. It will take care of starting the timer when your code block begins execution and stopping the timer when your code block ends.
Here’s an example use of the snippet:
from timer import Timer

from redis import Redis

rdb = Redis()

with Timer() as t:

    rdb.lpush("foo", "bar")

print "=> elasped lpush: %s s" % t.secs

with Timer() as t:

    rdb.lpop("foo")

print "=> elasped lpop: %s s" % t.secs
I’ll often log the outputs of these timers to a file in order to see how my program’s performance evolves over time.
Line-by-line timing and execution frequency with a profiler
Robert Kern has a nice project called line_profiler which I often use to see how fast and how often each line of code is running in my scripts.
To use it, you’ll need to install the python package via pip:
$ pip install line_profiler
Once installed you’ll have access to a new module called “line_profiler” as well as an executable script “kernprof.py”.
To use this tool, first modify your source code by decorating the function you want to measure with the @profile decorator. Don’t worry, you don’t have to import anyting
in order to use this decorator. The kernprof.py script automatically injects it into your script’s runtime during execution.
primes.py
@profile

def primes(n):

    if n==2:

        return [2]

    elif n<2:

        return []

    s=range(3,n+1,2)

    mroot = n ** 0.5

    half=(n+1)/2-1

    i=0

    m=3

    while m <= mroot:

        if s[i]:

            j=(m*m-3)/2

            s[j]=0

            while j<half:

                s[j]=0

                j+=m

        i=i+1

        m=2*i+3

    return [2]+[x for x in s if x]

primes(100)
Once you’ve gotten your code setup with the @profile decorator, usekernprof.py to
run your script.
$ kernprof.py -l -v fib.py
The -l option tells kernprof to inject the @profile decorator into your script’s
builtins, and -v tells kernprof to display timing information once you’re script finishes. Here’s one the output should look like for the above script:
Wrote profile results to primes.py.lprof

Timer unit: 1e-06 s

File: primes.py

Function: primes at line 2

Total time: 0.00019 s

Line #      Hits         Time  Per Hit   % Time  Line Contents

==============================================================

     2                                           @profile

     3                                           def primes(n):

     4         1            2      2.0      1.1      if n==2:

     5                                                   return [2]

     6         1            1      1.0      0.5      elif n<2:

     7                                                   return []

     8         1            4      4.0      2.1      s=range(3,n+1,2)

     9         1           10     10.0      5.3      mroot = n ** 0.5

    10         1            2      2.0      1.1      half=(n+1)/2-1

    11         1            1      1.0      0.5      i=0

    12         1            1      1.0      0.5      m=3

    13         5            7      1.4      3.7      while m <= mroot:

    14         4            4      1.0      2.1          if s[i]:

    15         3            4      1.3      2.1              j=(m*m-3)/2

    16         3            4      1.3      2.1              s[j]=0

    17        31           31      1.0     16.3              while j<half:

    18        28           28      1.0     14.7                  s[j]=0

    19        28           29      1.0     15.3                  j+=m

    20         4            4      1.0      2.1          i=i+1

    21         4            4      1.0      2.1          m=2*i+3

    22        50           54      1.1     28.4      return [2]+[x for x in s if x]
Look for lines with a high amount of hits or a high time interval. These are the areas where optimizations can yield the greatest improvements.
How much memory does it use?
Now that we have a good grasp on timing our code, let’s move on to figuring out how much memory our programs are using. Fortunately for us, Fabian Pedregosa has implemented a nice memory
profiler modeled after Robert Kern’s line_profiler.
First install it via pip:
$ pip install -U memory_profiler

$ pip install psutil
(Installing the psutil package here is recommended because it greatly improves the performance of the memory_profiler).
Like line_profiler, memory_profiler requires that you decorate your function of interest with an @profile decorator like so:
@profile

def primes(n):

    ...

    ...
To see how much memory your function uses run the following:
$ python -m memory_profiler primes.py
You should see output that looks like this once your program exits:
Filename: primes.py

Line #    Mem usage  Increment   Line Contents

==============================================

     2                           @profile

     3    7.9219 MB  0.0000 MB   def primes(n):

     4    7.9219 MB  0.0000 MB       if n==2:

     5                                   return [2]

     6    7.9219 MB  0.0000 MB       elif n<2:

     7                                   return []

     8    7.9219 MB  0.0000 MB       s=range(3,n+1,2)

     9    7.9258 MB  0.0039 MB       mroot = n ** 0.5

    10    7.9258 MB  0.0000 MB       half=(n+1)/2-1

    11    7.9258 MB  0.0000 MB       i=0

    12    7.9258 MB  0.0000 MB       m=3

    13    7.9297 MB  0.0039 MB       while m <= mroot:

    14    7.9297 MB  0.0000 MB           if s[i]:

    15    7.9297 MB  0.0000 MB               j=(m*m-3)/2

    16    7.9258 MB -0.0039 MB               s[j]=0

    17    7.9297 MB  0.0039 MB               while j<half:

    18    7.9297 MB  0.0000 MB                   s[j]=0

    19    7.9297 MB  0.0000 MB                   j+=m

    20    7.9297 MB  0.0000 MB           i=i+1

    21    7.9297 MB  0.0000 MB           m=2*i+3

    22    7.9297 MB  0.0000 MB       return [2]+[x for x in s if x]
IPython shortcuts for line_profiler and memory_profiler
A little known feature of line_profiler and memory_profiler is that both programs
have shortcut commands accessible from within IPython. All you have to do is type the following within an IPython session:
%load_ext memory_profiler

%load_ext line_profiler
Upon doing so you’ll have access to the magic commands %lprun and %mprunwhich behave
similarly to their command-line counterparts. The major difference here is that you won’t need to decorate your to-be-profiled functions with the@profile decorator. Just
go ahead and run the profiling directly within your IPython session like so:
In [1]: from primes import primes

In [2]: %mprun -f primes primes(1000)

In [3]: %lprun -f primes primes(1000)
This can save you a lot of time and effort since none of your source code needs to be modified in order to use these profiling commands.
Where’s the memory leak?
The cPython interpreter uses reference counting as it’s main method of keeping track of memory. This means that every object contains a counter, which is incremented when a reference to the object is stored somewhere, and decremented when a reference to it
is deleted. When the counter reaches zero, the cPython interpreter knows that the object is no longer in use so it deletes the object and deallocates the occupied memory.
A memory leak can often occur in your program if references to objects are held even though the object is no longer in use.
The quickest way to find these “memory leaks” is to use an awesome tool calledobjgraph written by Marius Gedminas. This tool allows you to see the number of objects in memory and also locate
all the different places in your code that hold references to these objects.
To get started, first install objgraph:
pip install objgraph
Once you have this tool installed, insert into your code a statement to invoke the debugger:
import pdb; pdb.set_trace()
Which objects are the most common?
At run time, you can inspect the top 20 most prevalent objects in your program by running:
(pdb) import objgraph

(pdb) objgraph.show_most_common_types()

MyBigFatObject             20000

tuple                      16938

function                   4310

dict                       2790

wrapper_descriptor         1181

builtin_function_or_method 934

weakref                    764

list                       634

method_descriptor          507

getset_descriptor          451

type                       439
Which objects have been added or deleted?
We can also see which objects have been added or deleted between two points in time:
(pdb) import objgraph

(pdb) objgraph.show_growth()

.

.

.

(pdb) objgraph.show_growth()   # this only shows objects that has been added or deleted since last show_growth() call

traceback                4        +2

KeyboardInterrupt        1        +1

frame                   24        +1

list                   667        +1

tuple                16969        +1
What is referencing this leaky object?
Continuing down this route, we can also see where references to any given object is being held. Let’s take as an example the simple program below:
x = [1]

y = [x, [x], {"a":x}]

import pdb; pdb.set_trace()
To see what is holding a reference to the variable x, run theobjgraph.show_backref() function:
(pdb) import objgraph

(pdb) objgraph.show_backref([x], filename="/tmp/backrefs.png")
The output of that command should be a PNG image stored at/tmp/backrefs.png and it should look something like this:
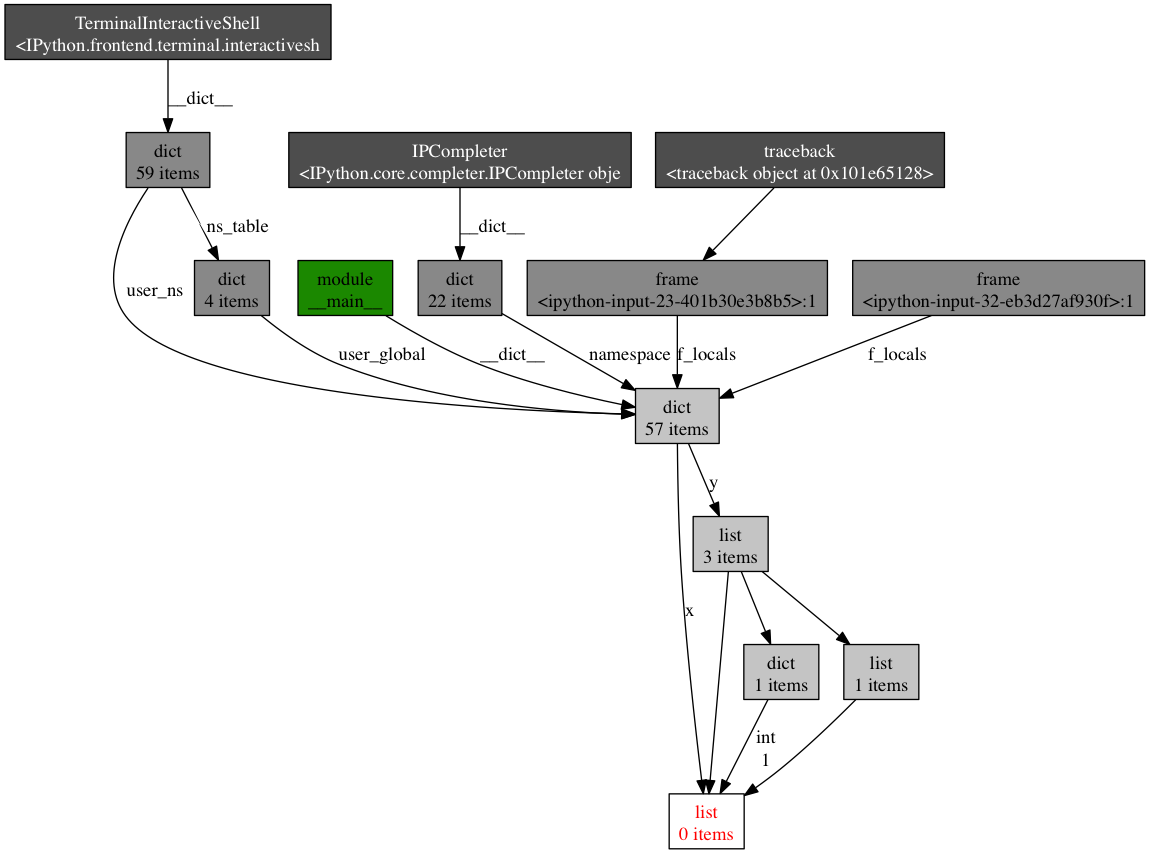
The box at the bottom with red lettering is our object of interest. We can see that it’s referenced by the symbol x once and by the list y three
times. If x is the object causing a memory leak, we can use this method to see why it’s not automatically being deallocated by tracking down all of its references.
So to review, objgraph allows us to:
- show the top N objects occupying our python program’s memory
- show what objects have been deleted or added over a period of time
- show all references to a given object in our script
Effort vs precision
In this post, I’ve shown you how to use several tools to analyze a python program’s performance. Armed with these tools and techniques you should have all the information required to track down most memory leaks as well as identify speed bottlenecks in a Python
program.
As with many other topics, running a performance analysis means balancing the tradeoffs between effort and precision. When in doubt, implement the simplest solution that will suit your current needs.
Refrences
will send out interesting links on twitter so follow me if you like this kind stuff.
Related Posts
A guide to analyzing Python performance的更多相关文章
- Android 性能优化(25)*性能工具之「Systrace」Analyzing UI Performance with Systrace:用Systrace得到ui性能报告
Analyzing UI Performance with Systrace In this document Overview 简介 Generating a Trace 生成Systrace文件 ...
- Analyzing UI Performance with Systrace 使用systrace工具分析ui性能
While developing your application, you should check that user interactions are buttery smooth, runni ...
- Analyzing Storage Performance using the Windows Performance Analysis ToolKit (WPT)
https://blogs.technet.microsoft.com/robertsmith/2012/02/07/analyzing-storage-performance-using-the-w ...
- 转帖:Python应用性能分析指南
原文:A guide to analyzing Python performance While it’s not always the case that every Python program ...
- [Python]程序性能分析
有些脚本发现比预期要慢的多,就需要找到瓶颈,然后做相应的优化,参考A guide to analyzing Python performance,也可以说是翻译. 指标 运行时间 时间瓶颈 内存使用 ...
- Python学习资料下载地址(转)
[转]Python学习资料和教程pdf 开发工具: Python语言集成开发环境 Wingware WingIDE Professional v3.2.12 Python语言集成开发环境 Wingwa ...
- python面试大全
问题一:以下的代码的输出将是什么? 说出你的答案并解释. class Parent(object): x = 1 class Child1(Parent): pass class Child2(Par ...
- [转]Python学习资料和教程pdf
开发工具: Python语言集成开发环境 Wingware WingIDE Professional v3.2.12 Python语言集成开发环境 Wingware WingIDE Professio ...
- python公司面试题集锦 python面试题大全
问题一:以下的代码的输出将是什么? 说出你的答案并解释. class Parent(object): x = 1 class Child1(Parent): pass class Child2(Par ...
随机推荐
- LeetCode(28)Implement strStr()
题目 Implement strStr(). Returns the index of the first occurrence of needle in haystack, or -1 if nee ...
- 集合—ArrayList
ArrayList也叫作数组列表 public static void main(String[] args) { List list1 = new ArrayList<String>() ...
- 转: ios学习入门进阶
著作权归作者所有.商业转载请联系作者获得授权,非商业转载请注明出处.作者:利炳根链接:https://www.zhihu.com/question/19627420/answer/45962351来源 ...
- .Net——实现IConfigurationSectionHandler接口定义处理程序处理自己定义节点
除了使用.net里面提供的内置处理程序来处理我们的自己定义节点外,我们还能够通过多种方法,来自己定义处理类处理我们的自己定义节点,本文主要介绍通过实现IConfigurationSectionHand ...
- VMware中Nat方式设置静态IP
一.共享无线连接或本地连接,给VMnet8. 在网络配置中.选着无线连接,右键属性.共享. 这里默认给虚拟网卡VMnet8.分配了IP:192.168.137.1. 二,在VMware中配置VMnet ...
- 【DB2】国标行业分类存储,通过SQL查询出层级关系
新建表 DROP TABLE Industry; CREATE TABLE Industry( IndustryCode VARCHAR(40),IndustryName VARCHAR(100),P ...
- mac使用git管理Github
工欲善其事,必先利其器. 在OS X Yosemite 10.10.3安装最新版本号Xcode.在terminal下能够发现git已经被安装. ~ mesut$ git --version git v ...
- curl Error : maximum redirects followed , 这种问题的一种原因 .
在stack overflow 上查找到有些网站上需要返回一些cookie的,所以当我们curl当相应的网站时,必须要将返回的cookie保存起来. $cookie = tempnam (" ...
- 自己动手一步一步安装hadoop(含编译hadoop的native本地包)
近期项目须要用到hadoop.边学习边应用,第一步无疑是安装hadoop.我安装的是hadoop-2.4.1.以下是具体步骤,做备忘以后查看 一.下载依赖软件 1.java hadoop官网说明仅仅支 ...
- mybatis学习笔记(14)-查询缓存之中的一个级缓存
mybatis学习笔记(14)-查询缓存之中的一个级缓存 标签: mybatis mybatis学习笔记14-查询缓存之中的一个级缓存 查询缓存 一级缓存 一级缓存工作原理 一级缓存測试 一级缓存应用 ...