DAX:New and returning customers
The New and Returning Customers pattern dynamically calculates the number of customers with certain behaviors based on their purchase history. This calculation can be computing-intensive and, thus, a critical part of the pattern is an efficient implementation.
Basic Pattern Example
Suppose you have a Sales table containing one row for each row detail in an order, as shown in Figure 1.

Figure 1 The Sales table must contain at least date and customer columns.
The OrderDateKey and CustomerKey columns reference the Date and Customer tables, respectively. The pattern assumes that there is one row per customer. If the Customer table contains more than one row for the same customer (such as in a Slowly Changing Dimension, where there is one row for each version of the same customer), then the application key that uniquely identifies the customer should be copied (denormalized) in the Sales table.
You create the New Customers measure to count how many customers have never bought a product before, considering the past sales of only the current selection of products.
[New Customers] :=
COUNTROWS (
FILTER (
ADDCOLUMNS (
VALUES ( Sales[CustomerKey] ),
"PreviousSales", CALCULATE (
COUNTROWS ( Sales ),
FILTER (
ALL ( 'Date' ),
'Date'[FullDate] < MIN ( 'Date'[FullDate] )
)
)
),
[PreviousSales] = 0
)
)
In Figure 2 you can see the result of the New Customers measure: because the slicer is filtering only the Bikes category, the pivot table displays how many customers bought a bike for the first time in each month.

Figure 2 The pivot table shows new and returning customers considering only sales of bikes.
The Customers measure is simply a distinct count.
[Customers] := DISTINCTCOUNT ( Sales[CustomerKey] )
The Returning Customers measure counts how many customers made at least one purchase in the past and made another purchase in the current period.
[Returning Customers] :=
COUNTROWS (
CALCULATETABLE (
VALUES ( Sales[CustomerKey] ),
VALUES ( Sales[CustomerKey] ),
FILTER (
ALL ( 'Date' ),
'Date'[FullDate] < MIN ( 'Date'[FullDate] )
)
)
)
You can also calculate the number of new customers by using the difference between the Customers and Returning Customers measures. This can be a good approach for simple formulas, but the technique used in this example is useful for implementing complex calculations, such as Lost Customers and Recovered Customers, as described in the complete pattern.
Use Cases
The New and Returning Customers pattern is useful in scenarios where you analyze customers' behavior and loyalty based on recurring purchasing behaviors. The following is a list of some interesting use cases.
Customer Retention
A company that uses customer retention strategies should analyze the results of its efforts by evaluating the behavior of its existing customer base. The New and Returning Customers pattern includes measures that enable such analysis, such as calculating the number of lost and returning customers. You can also analyze the results of actions targeted to lost customers by using the Recovered Customers measure.
Customer Attrition
If a company does not have a subscription model, identifying a lost customer requires the definition of a period of time within which the customer should make a purchase to be considered an active customer. Identifying lost customers is a key to analyzing customer attrition, customer churn, customer turnover, and customer defection.
Churning
To evaluate the churn rate of a customer base, you can use the New and Returning Customers pattern to obtain the number of new, lost, returning, and recovered customers.
Customer Loyalty
You can analyze customer loyalty by using several measures of the New and Returning Customers pattern, such as Returning Customers and Lost Customers. Usually you evaluate these measures against the total number of customers, comparing the resulting ratio over time.
Complete Pattern
The complete pattern includes many different measures. Examples of implementation of all the measures are shown after the definitions and the data model below.
Definition of Measures
The measures used in the pattern are defined as follows:
- New Customers: customers who have never purchased any of the selected products.
- Returning Customers: customers who bought at least one of the selected products in the past (no matter when).
- Lost Customers: customers who bought any of the selected products in the past but did not buy in the last period (defined as a number of days/months/years).
- Recovered Customers: customers who were considered lost before the defined period (like Lost Customers) but made a purchase in the period.
For each measure, there is also an "absolute" version that ignores the current product selection for past purchases:
- Absolute New Customers: customers who have never purchased before, regardless of the product selection.
- Absolute Returning Customers: customers who bought any product at any time in the past.
- Absolute Lost Customers: like Lost Customers, but considering any purchase made in the past, regardless of the current selection of products.
- Absolute Recovered Customers: customers who were considered lost before the defined period, regardless of the current selection of products (like Absolute Lost Customers), but made a purchase in the period.
Data Model
You need a data model similar to the one shown in Figure 3, with a Sales table that has a column containing a unique value for each customer (CustomerKey). If one customer has many keys (such as in a Slowly Changing Dimension Type 2, where every entity keeps the history of a changing attribute, storing one row for every version), you should denormalize the application key in the Sales table. The reason to do that is performance; you can avoid this denormalization by using a DAX calculation in the measure, but it would slow down query response time.

Figure 3 The data model includes a unique customer identifier in the Sales table.
The pivot table in Figure 4 shows the relative measures of this pattern in the columns and the different periods in the rows.

Figure 4 The columns show measures of the New and Returning Customers pattern.
The pivot table in Figure 5 shows the corresponding absolute measures of this pattern.
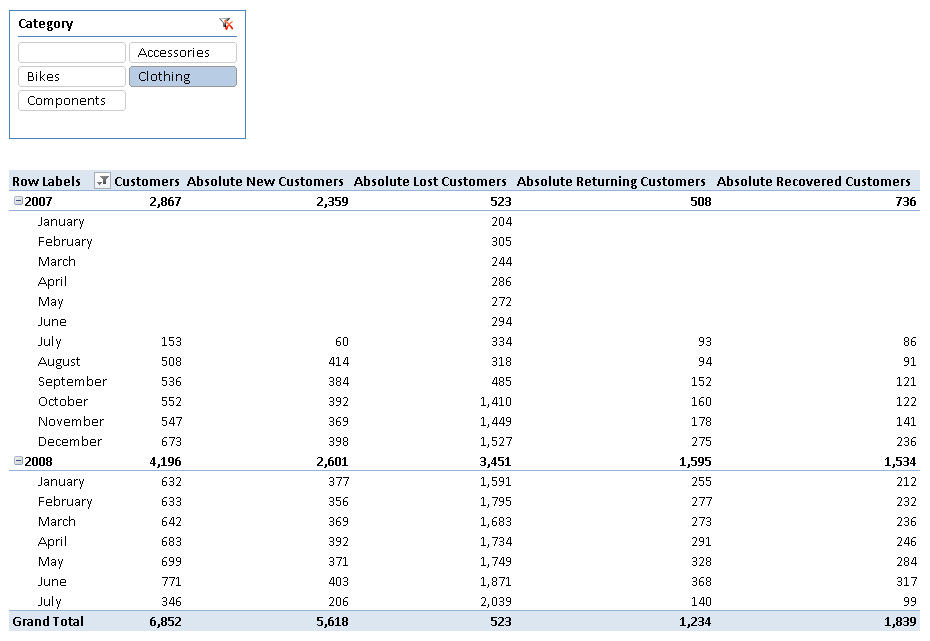
Figure 5 The columns show absolute measures of the New and Returning Customers pattern.
Templates of Measures
In the templates below, you will find the following markers:
- <fact_table> is the table that contains the sales transactions.
- <product_table> is the table that contains the products.
- <customer_key_column> is a column in the fact table that contains a unique identifier for the customer (it is also called business key or application key).
- <date_column> is a column in the date table or (if you do not have a date table in the data model) the fact table that identifies the date of the sales transaction.
- <date_table> is the date table – if you do not have a date table in the data model, replace it with the column in the fact table that identifies the date of the sales transaction (<date_column>).
- <fact_date_column> is a column in the fact table that identifies the date of the sales transaction; its data type has to be datetime. If an external date table uses a different data type to establish the relationship with the fact table, the corresponding date has to be denormalized in the fact table to simplify this calculation.
- <days_lost_customer> is the number of days after the last purchase to consider a customer lost.
There are two groups of templates:
- Relative measures: consider past transactions of selected products only.
- Absolute measures: consider past transactions of all the products, regardless of the current selection.
Relative Measures for New / Lost / Recovered / Returning Customers
Relative template measures define the state of a customer (new / lost / recovered / returning) considering only the products in the current selection and ignoring any transaction by the same customer with other products.
You can calculate the number of new customers as a difference between the customers in the current period and the returning customers.
[New Customers] :=
DISTINCTCOUNT ( <customer_key_column> ) - [Returning Customers]
An alternative way to implement the same measure of new customers is by counting how many customers had no sales before the period selected.
[New Customers] :=
COUNTROWS (
FILTER (
ADDCOLUMNS (
VALUES ( <customer_key_column> ),
"PreviousSales",
CALCULATE (
COUNTROWS ( <fact_table> ),
FILTER (
ALL ( <date_table> ),
<date_column> < MIN ( <date_column> )
)
)
),
ISBLANK ( [PreviousSales] )
)
)
The former version of New Customers (subtraction between distinct count of customers and returning customers) is usually faster. However, it is a good idea to test the performance of both approaches depending on the distribution of data in the data model and the type of queries used, and then to choose the implementation that is faster on a case-by-case basis.
You can evaluate the number of returning customers by using a technique that manipulates the filter context. The following measure combines two filters (the dates before the period selected, and the customers in the period selected) to count returning customers.
[Returning Customers] :=
COUNTROWS (
CALCULATETABLE (
VALUES ( <customer_key_column> ),
VALUES ( <customer_key_column> ),
FILTER (
ALL ( <date_table> ),
<date_column> < MIN ( <date_column> )
)
)
)
Note Remember that the first argument of the CALCULATE or CALCULATETABLE function is the expression that will be evaluated in a filter context modified by the filter arguments. Passing VALUES ( ) as a filter argument will keep the customers of the selected period in the filter context, once the filter over a different set of dates is applied. A possible bottleneck of the Returning Customers measure is that it applies a filter by date: if you are evaluating returning customers by month or year in a pivot table, the formula engine scans a materialized table including date and customer key. You might improve performance and reduce memory pressure by applying a filter over a month or year column instead of operating at the date level, possibly by denormalizing such a column in the fact table.
You can determine the number of lost customers by using the following calculation. The internal CustomerLostDate column sums the number of days since the last purchase of each customer, which defines when a customer is lost (the marker). You filter only those customers who have a CustomerLostDate within the selected period, and no purchases in the selected period before the CustomerLostDate of that customer.
[LostDaysLimit] := <days_lost_customer> + 1
[Lost Customers] :=
COUNTROWS (
FILTER (
ADDCOLUMNS (
FILTER (
CALCULATETABLE (
ADDCOLUMNS (
VALUES ( <customer_key_column> ),
"CustomerLostDate",
CALCULATE ( MAX ( <fact_date_column> ) ) + [LostDaysLimit]
),
FILTER (
ALL ( <date_table> ),
AND (
<date_column> < MIN ( <date_column> ),
<date_column>
>= MIN ( <date_column> ) - [LostDaysLimit]
)
)
),
AND (
AND (
[CustomerLostDate] >= MIN ( <date_column> ),
[CustomerLostDate] <= MAX ( <date_column> )
),
[CustomerLostDate]
<= CALCULATE ( MAX ( <fact_date_column> ), ALL ( <fact_table> ) )
)
),
"FirstBuyInPeriod", CALCULATE ( MIN ( <fact_date_column> ) )
),
OR (
ISBLANK ( [FirstBuyInPeriod] ),
[FirstBuyInPeriod] > [CustomerLostDate]
)
)
)
You can obtain the number of recovered customers with a calculation that compares, for each customer in the current selection, the date of the last purchase before the period selected against the first date of purchases in the current period.
Note The formula engine performs an important part of the calculation, so the DAX expression performs the most selective test in inner FILTER functions in order to minimize the occurrences of the least selective comparisons, improving performance when the number of recovered customers is high.
[Recovered Customers] :=
COUNTROWS (
FILTER (
ADDCOLUMNS (
FILTER (
FILTER (
ADDCOLUMNS (
VALUES ( <customer_key_column> ),
"CustomerLostDate", CALCULATE (
MAX ( <fact_date_column> ),
FILTER (
ALL ( <date_table> ),
<date_column> < MIN ( <fact_date_column> )
)
)
),
NOT ( ISBLANK ( [CustomerLostDate] ) )
),
( [CustomerLostDate] + [LostDaysLimit] ) < MAX ( <fact_date_column> )
),
"FirstBuyInPeriod", CALCULATE ( MIN ( <fact_date_column> ) )
),
[FirstBuyInPeriod] > ( [CustomerLostDate] + [LostDaysLimit] )
)
)
Absolute Measures for New / Lost / Recovered / Returning Customers
Absolute template measures define the state of a customer (new / lost / recovered / returning) considering all the purchases ever made by the same customer.
You can calculate the number of absolute new customers by counting how many customers had no transactions for any product before the period selected. In this case, you cannot use the difference between the customers in the current period and the returning customers.
[Absolute New Customers] :=
COUNTROWS (
FILTER (
ADDCOLUMNS (
VALUES ( <customer_key_column> ),
"PreviousSales",
CALCULATE (
COUNTROWS ( <fact_table> ),
ALL ( <product_table> ),
FILTER (
ALL ( <date_table> ),
<date_column> < MIN ( <date_column> )
)
)
),
ISBLANK ( [PreviousSales] )
)
)
Important Note that the only difference between measures of new customers and absolute new customers is an additional filter argument, which is highlighted in the formula. If there are other attributes that you want to ignore for past transactions made by the same customer, you just include other ALL conditions on that table(s) in the filter arguments of the CALCULATE statement, removing filters on table/columns you want to ignore.
You can evaluate the number of absolute returning customers by adding ALL conditions in filter arguments of the Absolute Returning Customers measure, specifying the table/columns you do not want to filter in past transactions.
[Absolute Returning Customers] :=
COUNTROWS (
CALCULATETABLE (
VALUES ( <customer_key_column> ),
VALUES ( <customer_key_column> ),
ALL ( <product_table> ),
FILTER (
ALL ( <date_table> ),
<date_column> < MIN ( <date_column> )
)
)
)
To calculate the number of absolute lost customers, you add ALL conditions (for tables/attributes you want to ignore in past transactions) in two CALCULATETABLE and CALCULATE filter arguments of the original Lost Customers expression. Look at the explanation of the Lost Customers measure for more details about its behavior.
[LostDaysLimit] := <days_lost_customer> + 1
[Absolute Lost Customers] :=
COUNTROWS (
FILTER (
ADDCOLUMNS (
FILTER (
CALCULATETABLE (
ADDCOLUMNS (
VALUES ( <customer_key_column> ),
"CustomerLostDate",
CALCULATE ( MAX ( <fact_date_column> ) ) + [LostDaysLimit]
),
ALL ( <product_table> ),
FILTER (
ALL ( <date_table> ),
AND (
<date_column> < MIN ( <date_column> ),
<date_column>
>= MIN ( <date_column> ) - [LostDaysLimit]
)
)
),
AND (
AND (
[CustomerLostDate] >= MIN ( <date_column> ),
[CustomerLostDate] <= MAX ( <date_column> )
),
[CustomerLostDate]
<= CALCULATE ( MAX ( <fact_date_column> ), ALL ( <fact_table> ) )
)
),
"FirstBuyInPeriod", CALCULATE (
MIN ( <fact_date_column> ),
ALL ( <product_table> )
)
),
OR (
ISBLANK ( [FirstBuyInPeriod] ),
[FirstBuyInPeriod] > [CustomerLostDate]
)
)
)
Finally, you can count the number of absolute recovered customers (using the Absolute Recovered Customers measure) by adding ALL conditions (for tables/attributes to ignore in past transactions) in the filter argument of the only CALCULATE function included in the original Recovered Customers measure.
[Absolute Recovered Customers] :=
COUNTROWS (
FILTER (
ADDCOLUMNS (
FILTER (
FILTER (
ADDCOLUMNS (
VALUES ( <customer_key_column> ),
"CustomerLostDate", CALCULATE (
MAX ( <fact_date_column> ),
ALL ( <product_table> ),
FILTER (
ALL ( <fact_date_column> ),
<fact_date_column> < MIN ( <fact_date_column> )
)
)
),
NOT ( ISBLANK ( [CustomerLostDate] ) )
),
( [CustomerLostDate] + [LostDaysLimit] ) < MAX ( <fact_date_column> )
),
"FirstBuyInPeriod", CALCULATE ( MIN ( <fact_date_column> ) )
),
[FirstBuyInPeriod] > ( [CustomerLostDate] + [LostDaysLimit] )
)
)
Measures Implemented in Adventure Works
You can implement the measures of the New and Returning Customers pattern for the sample model based on Adventure Works after you create a column of Date data type (OrderDate) in the Sales table by using the following definition.
Sales[OrderDate] = RELATED ( 'Date'[FullDate] )
You can implement the measures of this pattern as follows.
[New Customers] :=
DISTINCTCOUNT ( Sales[CustomerKey] ) - [Returning Customers]
[Returning Customers] :=
COUNTROWS (
CALCULATETABLE (
VALUES ( Sales[CustomerKey] ),
VALUES ( Sales[CustomerKey] ),
FILTER (
ALL ( 'Date' ),
'Date'[FullDate] < MIN ( 'Date'[FullDate] )
)
)
)
[Lost Customers] :=
IF (
NOT (
MIN ( 'Date'[FullDate] ) > CALCULATE ( MAX ( Sales[OrderDate] ), ALL ( Sales ) )
),
COUNTROWS (
FILTER (
ADDCOLUMNS (
FILTER (
CALCULATETABLE (
ADDCOLUMNS (
VALUES ( Sales[CustomerKey] ),
"CustomerLostDate",
CALCULATE ( MAX ( Sales[OrderDate] ) ) + [LostDaysLimit]
),
FILTER (
ALL ( 'Date' ),
AND (
'Date'[FullDate] < MIN ( 'Date'[FullDate] ),
'Date'[FullDate]
>= MIN ( 'Date'[FullDate] ) - [LostDaysLimit]
)
)
),
AND (
AND (
[CustomerLostDate] >= MIN ( 'Date'[FullDate] ),
[CustomerLostDate] <= MAX ( 'Date'[FullDate] )
),
[CustomerLostDate]
<= CALCULATE ( MAX ( Sales[OrderDate] ), ALL ( Sales ) )
)
),
"FirstBuyInPeriod", CALCULATE ( MIN ( Sales[OrderDate] ) )
),
OR (
ISBLANK ( [FirstBuyInPeriod] ),
[FirstBuyInPeriod] > [CustomerLostDate]
)
)
)
)
[Recovered Customers] :=
COUNTROWS (
FILTER (
ADDCOLUMNS (
FILTER (
FILTER (
ADDCOLUMNS (
VALUES ( Sales[CustomerKey] ),
"CustomerLostDate", CALCULATE (
MAX ( Sales[OrderDate] ),
FILTER (
ALL ( 'Date' ),
'Date'[FullDate] < MIN ( Sales[OrderDate] )
)
)
),
NOT ( ISBLANK ( [CustomerLostDate] ) )
),
( [CustomerLostDate] + [LostDaysLimit] ) < MAX ( Sales[OrderDate] )
),
"FirstBuyInPeriod", CALCULATE ( MIN ( Sales[OrderDate] ) )
),
[FirstBuyInPeriod] > ( [CustomerLostDate] + [LostDaysLimit] )
)
)
[Absolute New Customers] :=
COUNTROWS (
FILTER (
ADDCOLUMNS (
VALUES ( Sales[CustomerKey] ),
"PreviousSales",
CALCULATE (
COUNTROWS ( Sales ),
ALL ( Product ),
FILTER (
ALL ( 'Date' ),
'Date'[FullDate] < MIN ( 'Date'[FullDate] )
)
)
),
ISBLANK ( [PreviousSales] )
)
)
[Absolute Returning Customers] :=
COUNTROWS (
CALCULATETABLE (
VALUES ( Sales[CustomerKey] ),
VALUES ( Sales[CustomerKey] ),
ALL ( Product ),
FILTER (
ALL ( 'Date' ),
'Date'[FullDate] < MIN ( 'Date'[FullDate] )
)
)
)
[Absolute Lost Customers] :=
IF (
NOT ( MIN ( 'Date'[FullDate] )
> CALCULATE ( MAX ( Sales[OrderDate] ), ALL ( Sales ) ) ),
COUNTROWS (
FILTER (
ADDCOLUMNS (
FILTER (
CALCULATETABLE (
ADDCOLUMNS (
VALUES ( Sales[CustomerKey] ),
"CustomerLostDate",
CALCULATE ( MAX ( Sales[OrderDate] ) ) + [LostDaysLimit]
),
ALL ( Product ),
FILTER (
ALL ( 'Date' ),
AND (
'Date'[FullDate] < MIN ( 'Date'[FullDate] ),
'Date'[FullDate]
>= MIN ( 'Date'[FullDate] ) - [LostDaysLimit]
)
)
),
AND (
AND (
[CustomerLostDate] >= MIN ( 'Date'[FullDate] ),
[CustomerLostDate] <= MAX ( 'Date'[FullDate] )
),
[CustomerLostDate]
<= CALCULATE ( MAX ( Sales[OrderDate] ), ALL ( Sales ) )
)
),
"FirstBuyInPeriod", CALCULATE ( MIN ( Sales[OrderDate] ), ALL ( Product ) )
),
OR (
ISBLANK ( [FirstBuyInPeriod] ),
[FirstBuyInPeriod] > [CustomerLostDate]
)
)
)
)
[Absolute Recovered Customers]:=
COUNTROWS (
FILTER (
ADDCOLUMNS (
FILTER (
FILTER (
ADDCOLUMNS (
VALUES ( Sales[CustomerKey] ),
"CustomerLostDate", CALCULATE (
MAX ( Sales[OrderDate] ),
ALL ( Product ),
FILTER (
ALL ( 'Date' ),
'Date'[FullDate] < MIN ( Sales[OrderDate] )
)
)
),
NOT ( ISBLANK ( [CustomerLostDate] ) )
),
( [CustomerLostDate] + [LostDaysLimit] ) < MAX ( Sales[OrderDate] )
),
"FirstBuyInPeriod", CALCULATE ( MIN ( Sales[OrderDate] ) )
),
[FirstBuyInPeriod] > ( [CustomerLostDate] + [LostDaysLimit] )
)
)
The only purpose of the initial IF statement in the measures for lost customers is to avoid evaluation for dates higher than the last date available in Sales, because the Date table contains more years than available data and a complete evaluation of lost customers for future dates would be useless and expensive.
More Pattern Examples
In this section, you will see a few examples of the New and Returning Customers pattern.
Customer Loyalty with Different Intervals Between Sales
Using a slicer, you can control the LostDaysLimit measure, which controls the evaluation of lost and recovered customers. This enables quick changes of the evaluation, trying different intervals between two sales to consider a customer as loyal. Figure 6 shows an example of the results obtained by defining a table (Days) containing a single column (Days Customer Lost) that is used to display the values in the slicer. The minimum value selected is the maximum distance between two sales before the customer is considered lost.
[DaysCustomerLost] := MIN ( Days[Days Customer Lost] )
[LostDaysLimit] := [DaysCustomerLost] + 1

Figure 6 The Days Customer Lost slicer defines the number of days without sales before a customer is considered lost.
Sales Amounts of New, Returning, and Recovered Customers
You might want to filter a measure by considering only the new, returning, or recovered customers. For example, a pivot table could display the Sales Amount of different types of customers, as shown in Figure 7.

Figure 7 The columns in the pivot table shows the sales amount considering only the customers of the type described in the corresponding measure name (new, returning, recovered, and loyal).
You define the measure using a slight variation of the original pattern. Instead of counting the rows returned by a table expression that filters the customers, you use the list of customers as a filter argument in a CALCULATE expression that evaluates the measure you want.
[Sales New Customers] :=
CALCULATE (
SUM ( Sales[SalesAmount] ),
FILTER (
ADDCOLUMNS (
VALUES ( Sales[CustomerKey] ),
"PreviousSales",
CALCULATE (
COUNTROWS ( Sales ),
FILTER (
ALL ( 'Date' ),
'Date'[FullDate] < MIN ( 'Date'[FullDate] )
)
)
),
ISBLANK ( [PreviousSales] )
)
)
[Sales Returning Customers] :=
CALCULATE (
SUM ( Sales[SalesAmount] ),
CALCULATETABLE (
VALUES ( Sales[CustomerKey] ),
VALUES ( Sales[CustomerKey] ),
FILTER (
ALL ( 'Date' ),
'Date'[FullDate] < MIN ( 'Date'[FullDate] )
)
)
)
[Sales Recovered Customers] :=
CALCULATE (
SUM ( Sales[SalesAmount] ),
FILTER (
ADDCOLUMNS (
FILTER (
FILTER (
ADDCOLUMNS (
VALUES ( Sales[CustomerKey] ),
"CustomerLostDate", CALCULATE (
MAX ( Sales[OrderDate] ),
FILTER (
ALL ( 'Date' ),
'Date'[FullDate] < MIN ( Sales[OrderDate] )
)
)
),
NOT ( ISBLANK ( [CustomerLostDate] ) )
),
( [CustomerLostDate] + [LostDaysLimit] ) < MAX ( Sales[OrderDate] )
),
"FirstBuyInPeriod", CALCULATE ( MIN ( Sales[OrderDate] ) )
),
[FirstBuyInPeriod] > ( [CustomerLostDate] + [LostDaysLimit] )
)
)
[Sales Loyal Customers] :=
CALCULATE (
SUM ( Sales[SalesAmount] ),
FILTER (
ADDCOLUMNS (
FILTER (
FILTER (
ADDCOLUMNS (
VALUES ( Sales[CustomerKey] ),
"CustomerLostDate", CALCULATE (
MAX ( Sales[OrderDate] ),
FILTER (
ALL ( 'Date' ),
'Date'[FullDate] < MIN ( Sales[OrderDate] )
)
)
),
NOT ( ISBLANK ( [CustomerLostDate] ) )
),
( [CustomerLostDate] + [LostDaysLimit] ) >= MIN ( Sales[OrderDate] )
),
"FirstBuyInPeriod", CALCULATE ( MIN ( Sales[OrderDate] ) )
),
[FirstBuyInPeriod] <= ( [CustomerLostDate] + [LostDaysLimit] )
)
)
DAX:New and returning customers的更多相关文章
- ORACLE RETURNING 用法总结
ORACLE RETURNING 用法总结 场景 在存储过程.PL/SQL块里需要返回INSERT.DELETE.UPDATE.MERGE等DML语句执行后的信息时使用,合理使用returning能够 ...
- [LeetCode] Customers Who Never Order 从未下单订购的顾客
Suppose that a website contains two tables, the Customers table and the Orders table. Write a SQL qu ...
- T-SQL:毕业生出门需知系列(六)
第6课 用通配符进行过滤 6.1 LIKE 操作符 前面介绍的所有操作符都是针对已知值进行过滤.但是,这种过滤方法并不是任何时候都好用. 例如:怎样搜索产品名中包含文本 bean bag 的所有产品? ...
- SQL Server 存储(1/8):理解数据页结构
我们都很清楚SQL Server用8KB 的页来存储数据,并且在SQL Server里磁盘 I/O 操作在页级执行.也就是说,SQL Server 读取或写入所有数据页.页有不同的类型,像数据页,GA ...
- LINQ之路 8: 解释查询(Interpreted Queries)
LINQ提供了两个平行的架构:针对本地对象集合的本地查询(local queries),以及针对远程数据源的解释查询(Interpreted queries). 在讨论LINQ to SQL等具体技术 ...
- 用事实说话,成熟的ORM性能不是瓶颈,灵活性不是问题:EF5.0、PDF.NET5.0、Dapper原理分析与测试手记
[本文篇幅较长,可以通过目录查看您感兴趣的内容,或者下载格式良好的PDF版本文件查看] 目录 一.ORM的"三国志" 2 1,PDF.NET诞生历程 2 2,Linq2 ...
- SQL Server 存储(2/8):理解数据记录结构
在SQL Server :理解数据页结构我们提到每条记录都有7 bytes的系统行开销,那这个7 bytes行开销到底是一个什么样的结构,我们一起来看下. 数据记录存储我们具体的数据,换句话说,它存在 ...
- WP8.1 Study12:文件压缩与Known Folder(包含SD卡操作)
一.文件压缩 当应用程序保存和加载数据,它可以使用压缩. 1.使用 Windows.Storage.Compression.Compressor 压缩,获得一个Compressor stream. v ...
- ADO.NET 快速入门(五):从 DataSet 更新数据库
该主题说明了如何使用 DataSet 在数据库中更新数据.你依然可以直接使用 SqlCommand 在数据库中插入.更新.和删除数据,记住这一点也很重要.理解“从数据库填充DataSet”涵盖的概念有 ...
随机推荐
- Android 如何进入充电模式
/************************************************************************* * Android 如何进入充电模式 * 说明: ...
- 【重要】Selenium2+python自动化44-元素定位参数化(find_element)
转:https://www.cnblogs.com/yoyoketang/p/6551274.html 前言 元素定位有八种方法,这个能看到这一篇的小伙伴都知道了,那么有没有一种方法,可以把八种定位合 ...
- 收藏产品判断、html 在 UIwebView里面显示
收藏产品功能 要求:用户点击收藏,如果已经收藏,用户点击就取消收藏 写法一: 点击事件{ if (!isSelect) { [sender setImage:[UIImage imageNamed: ...
- k8s-存储卷1-十二
因为pod是有生命周期的,pod一重启,里面的数据就没有了.所以我们需要数据持久化存储. 在k8s中,存储卷不属于容器,而是属于pod.也就是说同一个pod中的容器可以共享一个存储卷. 存储卷可以是宿 ...
- POJ2105【进制转化】
直接瞎写就可以水过.我记得STL有很多好的函数,哎.水过去补多校的题. //#include <bits/stdc++.h> #include<cstdio> #include ...
- Managed C++ wtypes.h DATE 转化为 .net的 DateTime
http://stackoverflow.com/questions/570224/how-do-i-convert-from-mfcs-coledatetime-to-c-sharp-datetim ...
- Codeforces731E Funny Game
dp[i][0]表示从i出发,轮到先手走的最优值. dp[i][1]表示从i出发,轮到后手走的最优值. dp[i][0]=max(dp[j][1]+sum[j]) dp[i][1]=min(dp[j] ...
- 洛谷P2515 [HAOI2010]软件安装(tarjan缩点+树形dp)
传送门 我们可以把每一个$d$看做它的父亲,这样这个东西就构成了一个树形结构 问题是他有可能形成环,所以我们还需要一遍tarjan缩点 缩完点后从0向所有入度为零的点连边 然后再跑一下树形dp就行了 ...
- IT兄弟连 JavaWeb教程 Servlet 状态管理 会话跟踪
HTTP协议是无状态的,我们的客户端与服务器的每一次请求与响应,我们服务器都没有记忆能力将客户端与服务器的多次交互数据进行存储与管理共有两种技术实现: ● 基于客户端实现:Cookie,将状态保存在 ...
- NSA互联网公开情报收集指南:迷宫中的秘密·下
猫宁!!! 参考链接: https://www.nsa.gov/news-features/declassified-documents/assets/files/Untangling-the-Web ...