Utility3:Understand Dashboard Report
To see data in the SQL Server Utility dashboard, select the top node in the Utility Explorer tree - labeled "Utility<UCP_Name>\(ComputerName\UCP)." The dashboard includes summary and detail data from all managed instances of SQL Server and all data-tier applications in the SQL Server Utility. To refresh data in the dashboard, right-click the top node in the Utility Explorer tree, and select Refresh.
Dashboard Report 如下图
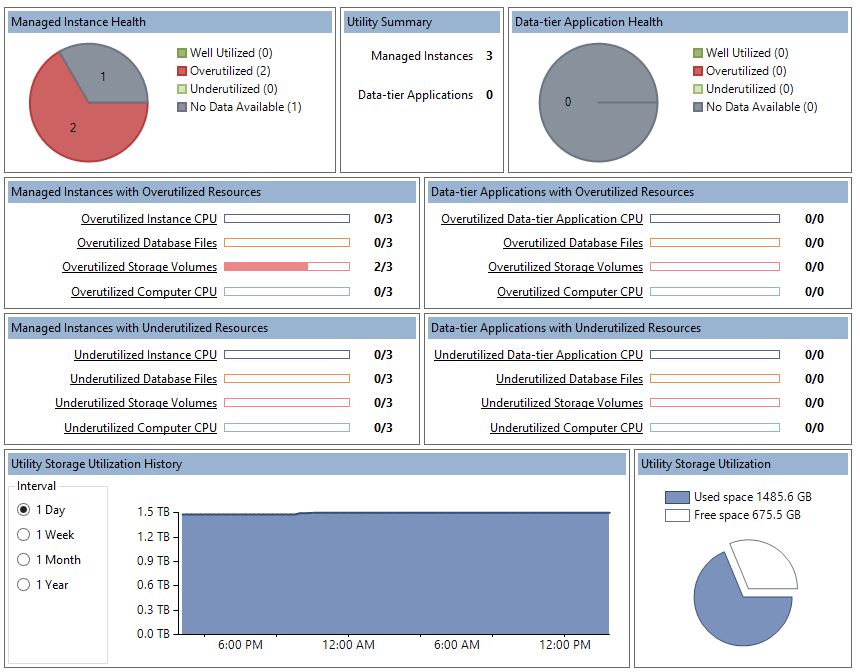
1,health status
- Well-utilized - Number of managed instances of SQL Server which are not violating resource utilization policies.
- Underutilized - Number of managed resources which are violating resource underutilization policies.
- Overutilized - Number of managed resources which are violating resource overutilization policies.
- No Data Available - Data is not available for managed instances of SQL Server either because the instance of SQL Server has just been enrolled and the first data collection operation has not completed, or because there is a problem with the managed instance of SQL Server collecting and uploading data to the UCP.
2,Utility Storage Utilization
Utility Storage 是UCP的所有数据有效的Managed instancde(health status不是No Data Available的Managed instancde)的Storage 加和之后的utilization.
Utility Storage Utilization History
Utilization history is shown in a time graph at the bottom of the SQL Server Utility dashboard. Note that time data show the UCP local date and time using the datetime data type. When using the Utility object model, note that SSMS uses the datetimeoffset data type.
Use the radio buttons to the left of the display area to change the reporting period for the graph.
Options for the reporting interval are:
- 1 Day, displayed in 15-minute intervals.
- 1 Week, displayed in 1-day intervals.
- 1 Month, displayed in 1-week intervals.
- 1 Year, displayed in 1-month intervals.
After you make a change to the reporting interval, the data refreshes automatically.
Utility Storage Utilization
In the bottom right of the dashboard, the storage utilization pie chart displays the ratio of used space to free space on volumes residing on computers that contain managed instances of SQL Server. Data for this display are refreshed every 15 minutes.
3,understand concept
- Instance CPU 是指分配给SQL Server instance的CPU的利用
- Computer 是指SQL Server Instance 所在Server的CPU 的利用
- Database fies是database的Data files 和Log file 对Disk Space的利用
- Storage Volume 是指SQL Server Instance 所在Server的Disk Space的利用
参考文档;
Utility Dashboard (SQL Server Utility)
Utility3:Understand Dashboard Report的更多相关文章
- jmeter Dashboard Report
说明:详情参考:https://jmeter.apache.org/usermanual/generating-dashboard.html JMeter3.0以后引入了Dashboard Repor ...
- 【JMeter】生成报告-Dashboard Report
Dashboard Report 用于生成HTML页面格式图形化报告 1.在JMmeter性能测试结束时,自动生成本次测试的HTML图形化报告 2.使用一个已有的结果文件(如CSV)来生成该次的HTM ...
- kubernetes学习笔记之十一:kubernetes dashboard认证及分级授权
第一章.部署dashboard 作为Kubernetes的Web用户界面,用户可以通过Dashboard在Kubernetes集群中部署容器化的应用,对应用进行问题处理和管理,并对集群本身进行管理.通 ...
- SpringCloud学习笔记(5):Hystrix Dashboard可视化监控数据
简介 上篇文章中讲了使用Hystrix实现容错,除此之外,Hystrix还提供了近乎实时的监控.本文将介绍如何进行服务监控以及使用Hystrix Dashboard来让监控数据图形化. 项目介绍 sc ...
- JMeter:Dashboard Report自动生成测试报告的巧用和避坑
官网地址查阅:http://jmeter.apache.org/usermanual/generating-dashboard.html 最近在压测过程中使用 Generating Report Da ...
- springcloud-知识点总结(三):Hystrix & Dashboard & turbine & Zuul & SpringCloud Config
1.Hystrix断路器简介 Hystrix断路器简介 hystrix对应的中文名字是“豪猪”,豪猪周身长满了刺,能保护自己不受天敌的伤害,代表了一种防御机制,这与hystrix本身的功能不谋而合,因 ...
- 剥开比原看代码09:通过dashboard创建密钥时,前端的数据是如何传到后端的?
作者:freewind 比原项目仓库: Github地址:https://github.com/Bytom/bytom Gitee地址:https://gitee.com/BytomBlockchai ...
- Spring Cloud Alibaba基础教程:Sentinel Dashboard中修改规则同步到Nacos
上一篇我们介绍了如何通过改造Sentinel Dashboard来实现修改规则之后自动同步到Apollo.下面通过这篇,详细介绍当使用Nacos作为配置中心之后,如何实现Sentinel Dashbo ...
- Spring Cloud Alibaba基础教程:Sentinel Dashboard同步Apollo存储规则
在之前的两篇教程中我们分别介绍了如何将Sentinel的限流规则存储到Nacos和Apollo中.同时,在文末的思考中,我都指出了这两套整合方案都存在一个不足之处:不论采用什么配置中心,限流规则都只能 ...
随机推荐
- mac linux 删除一个文件下边所有文件和文件夹
sudo rm -r -f 目录
- 如何让TortoiseSVN导出新增或修改过的文件
利用Windows系统下的TortoiseSVN客户端,可以导出指定版本之间修改过的文件,并保留完整的文件夹结构.下面我就来说说操作的步骤: 1.在网站项目的根目录下右键选择 “TortoiseSVN ...
- intellij 调试spark scala 程序 报错
spark用的是cdh spark-2.0.1 package main.scala import org.apache.spark.rdd.RDD import org.apache.spark.{ ...
- MongoDB实现分页(两种方法)
1.插入实验数据 偷懒用下samus,100条. ; i < ; i++) { Document doc = new Document(); doc["ID"] = i; d ...
- 单链表、循环链表的JS实现
数据结构系列前言: 数据结构作为程序员的基本知识,需要我们每个人牢牢掌握.近期我也展开了对数据结构的二次学习,来弥补当年挖的坑...... 当时上课的时候也就是跟着听课,没有亲自实现任何一种数据结 ...
- 我对 Java 标识符的分类命名方法
我对 Java 的各种标识符有一套固定的分类方法,以下分享一下我的命名方法以及进行一些说明. # 前缀: 方法 方法:f_doSomeThing().分类词是 f,采自 [f]unction 方法,也 ...
- Storm 中什么是-acker,acker工作流程介绍
概述 我们知道storm一个很重要的特性是它能够保证你发出的每条消息都会被完整处理, 完整处理的意思是指: 一个tuple被完全处理的意思是: 这个tuple以及由这个tuple所导致的所有的tupl ...
- 后台PageVo中字段赋值与前台datagrid字段获取
后台PageVo中字段的geter与setter函数需根据pageVo的字段自动生成,前台字段与后台字段名保持一致. 数据返回到前台时,datagrid会根据字段名隐射到相应的getter与sette ...
- 三、jquery操作DOM
DOM(Document Object Model, 文档对象模型)为文档提供了一种结构化的表示方法,通过该方法可以改变文档的内容和展示形式.在实际运用中,DOM更像是桥梁,通过它可以实现跨平台.跨语 ...
- RazorEngine 3.3 在Mono 3.2上正常运行
RazorEngine 是一个简化的模板引擎基于微软新的Razor 解析引擎, Razor是在 ASP.NET MVC3 和 Web Pages中引入的.RazorEngine 提供了一个外包装和额外 ...