Security基础(四):OpenSSL及证书服务常用系统监控命令、搭建nagios监控服务器、配置文件及插件使用、监控远程主机的公有数据、监控远程主机的私有数据
一、OpenSSL及证书服务常用系统监控命令
目标:
本案例要求练习常用的系统监控命令完成以下任务:
- 使用vmstat命令监控内存及磁盘I/O信息
- 使用iostat命令监控CPU处理器及磁盘的I/O信息
- 使用sar命令监控系统最近的CPU/内存等活动
步骤:
步骤一:使用vmstat命令监控内存及磁盘I/O信息
1)报告内存、交换分区、CPU等活动信息,每2秒更新一次数据
[root@svr7 ~]# vmstat 2
procs -----------memory---------- ---swap-- -----io---- -system-- ------cpu-----
r b swpd free buff cache si so bi bo in cs us sy id wa st
2 0 0 1447960 1204 331260 0 0 422 9 59 153 1 1 98 0 0
0 0 0 1447944 1204 331260 0 0 0 0 9 12 0 0 100 0 0
0 0 0 1447944 1204 331260 0 0 0 0 9 12 0
.. ..
2)报告一次磁盘的I/O信息
[root@svr7 ~]# vmstat -d
disk- ------------reads------------ ------------writes----------- -----IO------
total merged sectors ms total merged sectors ms cur sec
vda 7863 12 576137 2560 1427 25 12085 6142 0 3
sr0 11 0 88 3 0 0 0 0 0 0
dm-0 6529 0 562281 2503 356 0 7989 6480 0 3
dm-1 141 0 2536 7 0 0 0 0 0 0
3)报告一次指定分区的I/O信息
[root@svr7 ~]# vmstat -p /dev/vda1
vda1 reads read sectors writes requested writes
1010 8792 1025 4096
步骤二:使用iostat命令监控CPU处理器及磁盘的I/O信息
1)报告一次CPU和磁盘I/O信息
[root@svr7 ~]# iostat
Linux 3.10.0-327.el7.x86_64 (svr7.tedu.cn) 2017年05月03日 _x86_64_ (1 CPU)
avg-cpu: %user %nice %system %iowait %steal %idle
0.77 0.00 0.71 0.05 0.00 98.47
Device: tps kB_read/s kB_wrtn/s kB_read kB_wrtn
vda 9.85 304.60 6.45 288160 6103
scd0 0.01 0.05 0.00 44 0
dm-0 7.30 297.28 4.29 281232 4055
dm-1 0.15 1.34 0.00 1268 0
2)报告CPU和磁盘I/O信息,每2秒钟采样一次
[root@svr7 ~]# iostat 2
Linux 3.10.0-327.el7.x86_64 (svr7.tedu.cn) 2017年05月03日 _x86_64_ (1 CPU)
avg-cpu: %user %nice %system %iowait %steal %idle
0.66 0.00 0.61 0.05 0.00 98.68
Device: tps kB_read/s kB_wrtn/s kB_read kB_wrtn
vda 8.42 259.61 5.62 288168 6235
scd0 0.01 0.04 0.00 44 0
dm-0 6.25 253.37 3.77 281240 4187
dm-1 0.13 1.14 0.00 1268 0
avg-cpu: %user %nice %system %iowait %steal %idle
0.00 0.00 0.00 0.00 0.00 100.00
Device: tps kB_read/s kB_wrtn/s kB_read kB_wrtn
vda 0.00 0.00 0.00 0 0
scd0 0.00 0.00 0.00 0 0
dm-0 0.00 0.00 0.00 0 0
dm-1 0.00 0.00 0.00 0 0
.. ..
步骤三:使用sar命令监控系统最近的CPU/内存等活动
1)查看一次最近的系统活动完整(-A)报告
[root@svr7 ~]# sar -A
Linux 3.10.0-327.el7.x86_64 (svr7.tedu.cn) 2017年05月03日 _x86_64_ (1 CPU)
11时20分01秒
CPU %usr %nice %sys %iowait %steal %irq %soft %guest %gnice %idle
11时30分01秒 all 0.17 0.00 0.11 0.01 0.00 0.00 0.00 0.00 0.00 99.71
11时30分01秒 0 0.17 0.00 0.11 0.01 0.00 0.00 0.00 0.00 0.00 99.71
平均时间: all 0.17 0.00 0.11 0.01 0.00 0.00 0.00 0.00 0.00 99.71
平均时间: 0 0.17 0.00 0.11 0.01 0.00 0.00 0.00 0.00 0.00 99.71
11时20分01秒 proc/s cswch/s
11时30分01秒 0.39 23.27
平均时间: 0.39 23.27
11时20分01秒 pswpin/s pswpout/s
11时30分01秒 0.00 0.00
平均时间: 0.00 0.00
11时20分01秒 pgpgin/s pgpgout/s fault/s majflt/s pgfree/s pgscank/s pgscand/s pgsteal/s %vmeff
11时30分01秒 6.30 0.35 165.40 0.03 133.94 0.00 0.00 0.00 0.00
平均时间: 6.30 0.35 165.40 0.03 133.94 0.00 0.00 0.00 0.00
11时20分01秒 tps rtps wtps bread/s bwrtn/s
11时30分01秒 0.38 0.27 0.11 12.59 0.70
平均时间: 0.38 0.27 0.11 12.59 0.70
11时20分01秒 frmpg/s bufpg/s campg/s
11时30分01秒 -4.90 0.00 1.37
平均时间: -4.90 0.00 1.37
11时20分01秒 kbmemfree kbmemused %memused kbbuffers kbcached kbcommit %commit kbactive kbinact kbdirty
11时30分01秒 1444844 604264 29.49 1204 277020 1547884 37.33 249044 241260 0
平均时间: 1444844 604264 29.49 1204 277020 1547884 37.33 249044 241260 0
11时20分01秒 kbswpfree kbswpused %swpused kbswpcad %swpcad
11时30分01秒 2097148 0 0.00 0 0.00
平均时间: 2097148 0 0.00 0 0.00
.. ..
2)报告CPU活动信息,以5秒为间隔再采用3次
[root@svr7 ~]# sar -u 5 3
Linux 3.10.0-327.el7.x86_64 (svr7.tedu.cn) 2017年05月03日 _x86_64_ (1 CPU)
11时44分20秒 CPU %user %nice %system %iowait %steal %idle
11时44分25秒 all 0.00 0.00 0.00 0.00 0.00 100.00
11时44分30秒 all 0.00 0.00 0.00 0.00 0.00 100.00
11时44分35秒 all 0.00 0.00 0.00 0.00 0.00 100.00
平均时间: all 0.00 0.00 0.00 0.00 0.00 100.00
3)报告最近的磁盘I/O信息
[root@svr7 ~]# sar -b
Linux 3.10.0-327.el7.x86_64 (svr7.tedu.cn) 2017年05月03日 _x86_64_ (1 CPU)
.. ..
11时20分01秒 tps rtps wtps bread/s bwrtn/s
11时30分01秒 0.38 0.27 0.11 12.59 0.70
11时40分01秒 0.25 0.13 0.12 15.62 0.93
平均时间: 0.31 0.20 0.11 14.11 0.81
二、搭建nagios监控服务器
目标:
本案例要求搭建一台nagios监控服务器,确认Web界面可用:
- 安装nagios、nagios-plugins软件包
- 配置及访问web界面,将管理用户/密码均设为 nagiosadmin
步骤:
步骤一:安装前的准备工作
1)安装网站平台环境、编译工具
[root@svr7 ~]# yum -y install httpd php gd
[root@svr7 ~]# yum -y install gcc glibc glibc-common
2)创建运行账号
[root@svr7 ~]# groupadd nagcmd
[root@svr7 ~]# useradd -G nagcmd nagios
[root@svr7 ~]# gpasswd -a apache nagcmd
步骤二:编译安装nagios及nagios-plugins
1)安装nagios
[root@svr7 ~]# tar xf ~/nagios-4.3.1.tar.gz -C /usr/src/
[root@svr7 ~]# cd /usr/src/nagios-4.3.1/
[root@svr7 nagios-4.3.1]# ./configure --with-command-group=nagcmd
[root@svr7 nagios-4.3.1]# make all //编译
[root@svr7 nagios-4.3.1]# make install //安装程序
[root@svr7 nagios-4.3.1]# make install-init //安装控制脚本
[root@svr7 nagios-4.3.1]# make install-config //安装配置
[root@svr7 nagios-4.3.1]# make install-commandmode //调权限
[root@svr7 nagios-4.3.1]# make install-webconf //部署网站配置
[root@svr7 nagios-4.3.1]# chkconfig --add nagios //加载服务配置
2)安装nagios-plugins
[root@svr7 ~]# tar xf ~/nagios-plugins-2.1.4.tar.gz -C /usr/src/
[root@svr7 ~]# cd /usr/src/nagios-plugins-2.1.4/
[root@svr7 nagios-plugins-2.1.4]# ./configure --with-nagios-user=nagios --with-nagios-group=nagcmd
[root@svr7 nagios-plugins-2.1.4]# make
[root@svr7 nagios-plugins-2.1.4]# make install
步骤三:启用及访问Nagios平台
1)为Nagios平台添加Web管理用户
[root@svr7 ~]# htpasswd -c /usr/local/nagios/etc/htpasswd.users nagiosadmin //建Web管理用户
2)启用nagios、httpd服务
[root@svr7 ~]# systemctl restart nagios //启用nagios
[root@svr7 ~]# systemctl restart httpd //启用Web
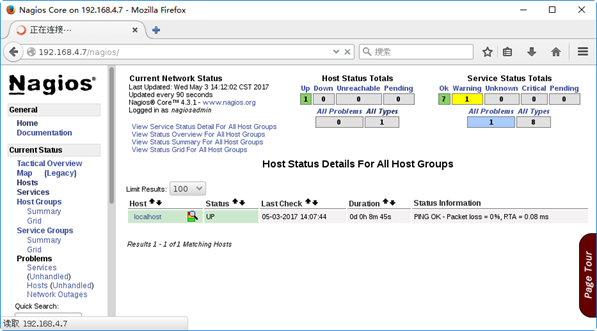
3)访问nagios网页界面
firefox http://服务器地址/nagios/,如下图所示。
三、配置文件及插件使用
目标:
本案例要求熟悉nagios的常用插件程序,完成以下任务:
- 使用插件 check_http 检测本机的Web端口
- 使用插件 check_tcp 检测本机的FTP服务端口
- 使用插件 check_disk 检测本机根分区使用率:可用空间低于80%报 WARNING,可用空间低于60%报 CRITICAL
步骤:
步骤一:使用插件 check_http 检测本机的Web端口
1)关闭本机的httpd服务,执行check_http检查
[root@svr7 ~]# /usr/local/nagios/libexec/check_http -H localhost -p 80connect to address localhost and port 80: 拒绝连接
HTTP CRITICAL - Unable to open TCP socket
2)启动本机的httpd服务,并建立默认首页index.html
[root@svr7 ~]# vim /var/www/html/index.html
Default site.
[root@svr7 ~]# systemctl restart httpd
3)再次执行check_http检查
[root@svr7 ~]# /usr/local/nagios/libexec/check_http -H localhost -p 80
HTTP OK: HTTP/1.1 200 OK - 302 bytes in 0.006 second response time |time=0.006236s;;;0.000000 size=302B;;;0
步骤二:使用插件check_tcp检测本机的FTP服务端口
1)未启动FTP服务时,执行check_ftp检查
[root@svr7 ~]# /usr/local/nagios/libexec/check_ftp -H localhost -p 21
connect to address localhost and port 21: 拒绝连接
2)安装及启动vsftpd服务以后,再次执行check_ftp检查
[root@svr7 ~]# yum -y install vsftpd
[root@svr7 ~]# systemctl restart vsftpd
[root@svr7 ~]# /usr/local/nagios/libexec/check_ftp -H localhost -p 21
FTP OK - 0.002 second response time on localhost port 21 [220 (vsFTPd 3.0.2)]|time=0.002164s;;;0.000000;10.000000
步骤三:使用插件check_disk检测本机/boot分区使用率
1)查看/boot目录所在分区的使用率
[root@svr7 ~]# df -hT /boot
文件系统 类型 容量 已用 可用 已用% 挂载点
/dev/vda1 xfs 497M 140M 358M 29% /boot
2)使用check_disk检查
可用空间低于80%报 WARNING,可用空间低于60%报 CRITICAL
[root@svr7 ~]# /usr/local/nagios/libexec/check_disk -w 80% -c 60% -p /boot
DISK WARNING - free space: /boot 357 MB (71% inode=99%);| /boot=139MB;99;198;0;496
3)查看实际使用率情况,调低阈值再次check_disk测试
[root@svr7 ~]# /usr/local/nagios/libexec/check_disk -w 60% -c 40% -p /boot
DISK OK - free space: /boot 357 MB (71% inode=99%);| /boot=139MB;297;198;0;496
四、监控远程主机的公有数据
目标:
本案例要求在Nagios平台上添加对远程主机pc207的监控,主要包括下列服务:
- ping连通状态
- Web服务
- FTP服务
- SSH服务
步骤:
步骤一:准备被监控主机pc207
1)正确配置IP地址,确保与主机svr7可相互ping通
[root@pc207 ~]# ping 192.168.4.7
PING 192.168.4.7 (192.168.4.7) 56(84) bytes of data.
64 bytes from 192.168.4.7: icmp_seq=1 ttl=64 time=0.621 ms
64 bytes from 192.168.4.7: icmp_seq=2 ttl=64 time=0.427 ms
.. ..
2)确保已启用httpd、vsftpd、sshd服务,并关闭防火墙服务firewalld
[root@pc207 ~]# yum -y install httpd vsftpd
.. ..
[root@pc207 ~]# systemctl restart httpd vsftpd sshd
[root@pc207 ~]# systemctl disable firewalld --now
步骤二:配置监控服务器svr7
1)新建监控配置pc207.cfg,定义监控目标(主机、服务)
[root@svr7 ~]# vim /usr/local/nagios/etc/objects/pc207.cfg
define host {
use linux-server
host_name pc207
address 172.25.0.10
}
define service {
use local-service
host_name pc207
service_description PING
check_command check_ping!100.0,20%!500.0,60%
}
define service {
use local-service
host_name pc207
service_description Web Server
check_command check_http
}
define service {
use local-service
host_name pc207
service_description FTP Server
check_command check_ftp
}
define service {
use local-service
host_name pc207
service_description SSH Server
check_command check_ssh
}
2)调整nagios.cfg,启用pc207.cfg监控配置
[root@svr7 ~]# vim /usr/local/nagios/etc/nagios.cfg
.. ..
cfg_file=/usr/local/nagios/etc/objects/pc207.cfg
3)重启nagios服务
[root@svr7 ~]# systemctl restart nagios
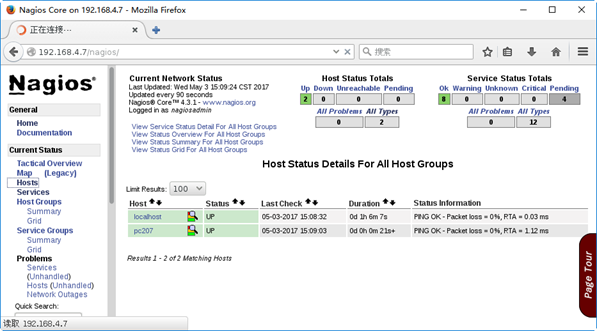
步骤三:刷新Nagios管理界面,确认新增主机pc207的监控结果
1)确认Hosts下新增的主机,如下图所示
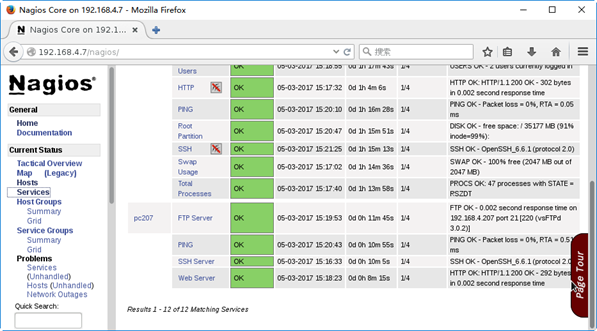
2)确认Services下新增的服务信息,如下图所示
五、监控远程主机的私有数据
目标:
本案例要求在Nagios服务器上添加对远程主机pc207上私有数据的监控,完成以下监控项目:
- 运行的进程数
- 登录的用户数
- CPU负载
- 根分区使用量
方案:
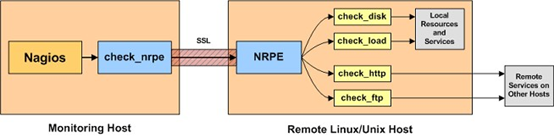
Linux主机的内存信息、磁盘I/O信息等私有数据默认不对外提供,若希望从Nagios监控平台获取远程主机的私有数据,需要在被监控主机上配置启用nrpe服务。
主要工作结构:Nagios监控端(check_nrpe插件) ==> 被监控端(nrpe服务),如下图所示。
步骤:
步骤一:准备被监控主机pc207
1)安装nagios-plugins插件
[root@pc207 ~]# yum -y install gcc glibc glibc-common
[root@pc207 ~]# groupadd nagcmd
[root@pc207 ~]# useradd -G nagcmd nagios
[root@pc207 ~]# tar xf ~/nagios-plugins-2.1.4.tar.gz -C /usr/src/
[root@pc207 ~]# cd /usr/src/nagios-plugins-2.1.4/
[root@pc207 nagios-plugins-2.1.4]# ./configure --with-nagios-user=nagios --with-nagios-group=nagcmd
[root@pc207 nagios-plugins-2.1.4]# make
[root@pc207 nagios-plugins-2.1.4]# make install
2)安装nrpe
[root@pc207 ~]# yum -y install openssl-devel //安装SSL头文件
[root@pc207 ~]# tar xf nrpe-3.1.0.tar.gz -C /usr/src/
[root@pc207 ~]# cd /usr/src/nrpe-3.1.0/
[root@pc207 nrpe-3.1.0]# ./configure
[root@pc207 nrpe-3.1.0]# make all //编译所有
[root@pc207 nrpe-3.1.0]# make install //安装nrpe及插件
[root@pc207 nrpe-3.1.0]# make install-init //安装服务
[root@pc207 nrpe-3.1.0]# make install-config //安装配置文件
3)定义nrpe监控命令
[root@pc207 ~]# vim /usr/local/nagios/etc/nrpe.cfg
.. ..
allowed_hosts=172.25.0.0/24,127.0.0.1,::1 //允许哪些主机
command[check_users]=/usr/local/nagios/libexec/check_users -w 5 -c 10
command[check_load]=/usr/local/nagios/libexec/check_load -w 15,10,5 -c 30,25,20
command[check_rootdir]=/usr/local/nagios/libexec/check_disk -w 20% -c 10% -p /
command[check_zombie_procs]=/usr/local/nagios/libexec/check_procs -w 150 -c 200 -s Z
command[check_total_procs]=/usr/local/nagios/libexec/check_procs -w 150 -c 200
4)启用nrpe服务并测试
[root@pc207 ~]# systemctl restart nrpe
[root@pc207 ~]# systemctl enable nrpe
.. ..
[root@pc207 ~]# /usr/local/nagios/libexec/check_nrpe -H localhost
NRPE v3.1.0-rc1 //测试连本机nrpe服务
步骤二:配置Nagios监控服务器
1)为Nagios安装check_nrpe插件
[root@svr7 ~]# yum -y install openssl-devel
[root@svr7 ~]# tar xf nrpe-3.1.0.tar.gz -C /usr/src/
[root@svr7 ~]# cd /usr/src/nrpe-3.1.0/
[root@svr7 nrpe-3.1.0]# ./configure
[root@svr7 nrpe-3.1.0]# make all //编译所有
[root@svr7 nrpe-3.1.0]# make install-plugin //安装check_nrpe插件
2)测试连远程的nrpe服务,并添加远程nrpe监控指令
[root@svr7 ~]# /usr/local/nagios/libexec/check_nrpe -H 172.25.0.10
NRPE v3.1.0-rc1 //测试连远程 的nrpe服务
[root@svr7 ~]# vim /usr/local/nagios/etc/objects/commands.cfg
.. ..
define command{
command_name check_nrpe
command_line $USER1$/check_nrpe -H $HOSTADDRESS$ -c $ARG1$
//-c 要求对方执行的命令
}
3)修改监控目标配置pc207.cfg,添加对远程主机pc207私有数据的获取
[root@svr7 ~]# vim /usr/local/nagios/etc/objects/pc207.cfg
.. ..
define service {
use local-service
host_name pc207
service_description NRPE-Total Procs
check_command check_nrpe!check_total_procs
}
define service {
use local-service
host_name pc207
service_description NRPE-Users
check_command check_nrpe!check_users
}
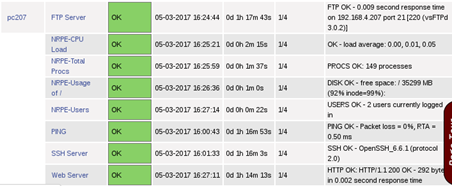
步骤三:刷新Nagios管理界面,确认主机pc207的私有数据监控结果
确认pc207主机及服务监控结果,如下图所示。
Security基础(四):OpenSSL及证书服务常用系统监控命令、搭建nagios监控服务器、配置文件及插件使用、监控远程主机的公有数据、监控远程主机的私有数据的更多相关文章
- Security基础(三):OpenSSL及证书服务、邮件TLS/SSL加密通信
一.OpenSSL及证书服务 目标: 本案例要求熟悉OpenSSL工具的基本使用,完成以下任务操作: 使用OpenSSL加密/解密文件 搭建企业自有的CA服务器,为颁发数字证书提供基础环境 方案: 使 ...
- Linux分享笔记:查看帮助命令 & 常用系统工作命令
在执行命令时,为了防止出现权限不足的问题,在登陆Linux系统时,要点击普通用户名下的 “Not listed?” 用root管理员身份登陆. [1] 执行查看帮助命令 man 这条命令用来查看帮助文 ...
- 第一阶段:Java基础 1.JAVA开发介绍---1.常用的DOS命令
一,DOS使用常识 DOS的概况:DOS(Disk Operating System)是一个使用得十分广泛的磁盘操作系统.DOS的概况 常见的DOS有两种:IBM公司的PC-DOS和微软公司的MS-D ...
- 【Linux命令】常用系统工作命令11个(echo、date、reboot、poweroff、wget、ps、top、pidof、kill、killall、pkill)
目录 echo命令 date命令 reboot命令 poweroff命令 wget命令 ps命令 top命令 pidof命令 kill命令 killall命令 pkill命令 一.echo命令 ech ...
- Java基础学习总结(52)——Liunx系统Centos上搭建Java开发环境
一.安装jdk 1.查看Linux自带的JDK是否已安装 [plain] view plain copy print? java –version 如果出现openjdk,最好还是先卸载掉openjd ...
- 2. Linux常用系统工作命令
1.echo:在终端输出字符串或变量提取后的值.echo [字符串 | $变量] 举例:[root@Centos~]# echo $SHELL /bin/bash 2.date:显示及设置系统的时间或 ...
- Linux 常用系统工作命令
1.echo 用于输出字符串或者变量的值 2.date 显示及设置系统的时间和日期,格式为 “date [选项][+指定格式]”,输入以“+”号开头的参数,及可按照指定格式输出 date命令参数及作用 ...
- linux常用系统工作命令
1.echo命令 echo命令用于在终端输出字符串或变量提取后的值,格式为“echo [字符串 | $变量]”. 2.date命令 date命令用于显示及设置系统的时间或日期,格式为“date [选项 ...
- Linux学习之常用系统工作命令(一)
由于centos和RHEL互通,两个版本可以相互学习,所以截图有两个界面 Linux系统与win系列是两个几乎完全不同的操作系统,但是就应用范围来说,是win系统更胜一筹,然而,这反而也成为win系 ...
随机推荐
- Mac定制终端:iTerm2 + zsh + powerline
原始界面: 配置后的界面: 安装iTerm2 可以直接去官网下载:https://www.iterm2.com/ 下载后直接安装即可 安装主题 所有主题:https://iterm2color ...
- Vue混入:全局混入
一 项目结构 二 main.js import Vue from "vue"; import App from "./App.vue"; Vue.config. ...
- MySQL 查询语句--------------进阶6:连接查询
#进阶6:连接查询 /* 含义:多个表格连接,当查询的字段来自于多个表时候,就会用到连接查询 我觉得这里类似于excel中的vlookup函数 笛卡尔乘积现象:表1有m行,表2有n行,结果有m*n行 ...
- 排序算法二:归并排序(Merge sort)
归并排序(Merge sort)用到了分治思想,即分-治-合三步,算法平均时间复杂度是O(nlgn). (一)算法实现 private void merge_sort(int[] array, int ...
- (转载)Solr4.x在Tomcat下的部署
Step1 下载安装包: 下载最新版本安装包 点击此处下载Tomcat 点击此处下载Solr Step2 解压: 解压Tomcat和Solr Step3 拷贝War包: 拷贝\solr-4.x\ ...
- webpack4.0.1的坑
webpack4在2月底正式发布后,原来的很多做法不能使用,下面把使用webpack4.0.1过程中,出现的问题,一一记录,也欢迎大家补充,谢谢!团结就是力量,众人拾柴火焰高,加油! 关于webpac ...
- jvm性能监控(4)–JVM的监控工具Jconsole
下面主要说一下怎么JConsole远程连接springboot 项目 java \-Djava.rmi.server.hostname=192.131.149.42 \-Dcom.sun.manag ...
- [Codeforces600E] Lomsat gelral(树上启发式合并)
[Codeforces600E] Lomsat gelral(树上启发式合并) 题面 给出一棵N个点的树,求其所有子树内出现次数最多的颜色编号和.如果多种颜色出现次数相同,那么编号都要算进答案 N≤1 ...
- Codeforces 1093D(染色+组合数学)
题面 传送门 题目大意:给出一个无向图,每个节点可以填1,2,3三个数中的一个 问有多少种填数方案,使两个相邻节点的数之和为奇数 分析 如果图中有奇环,一定无解 我们对图黑白染色,由于图可能不联通,记 ...
- 如何做PPT
如何做出更漂亮的PPT? 1.文字对齐,PPT字体最好使用微软雅黑,文档最好使用宋体 2.总分总的叙述形式 3.颜色最好使用冷色系,蓝色.灰色.灰蓝色等等 4.每段话中的重点内容标出特殊颜色 5.可使 ...