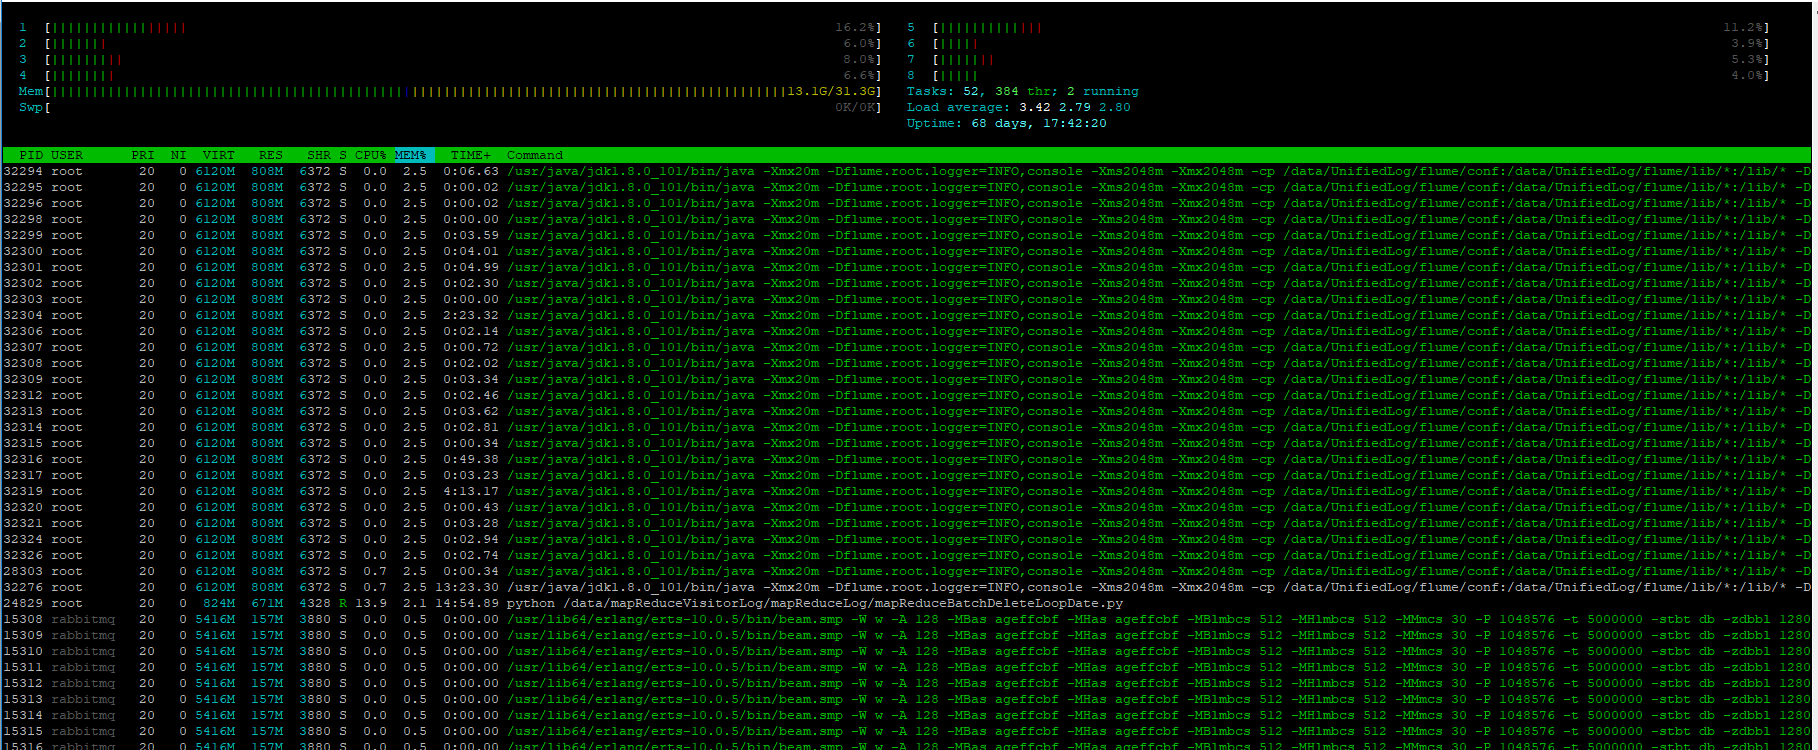
htop 分析 进程对资源的消耗
[root@d ~]# htop -h
htop 2.2.0 - (C) 2004-2018 Hisham Muhammad
Released under the GNU GPL.
-C --no-color Use a monochrome color scheme
-d --delay=DELAY Set the delay between updates, in tenths of seconds
-h --help Print this help screen
-s --sort-key=COLUMN Sort by COLUMN (try --sort-key=help for a list)
-t --tree Show the tree view by default
-u --user=USERNAME Show only processes of a given user
-p --pid=PID,[,PID,PID...] Show only the given PIDs
-v --version Print version info
Long options may be passed with a single dash.
Press F1 inside htop for online help.
See 'man htop' for more information.
HTOP(1) Utils HTOP(1)
NAME htop - interactive process viewer
SYNOPSIS htop [-dChustv]
DESCRIPTION Htop is a free (GPL) ncurses-based process viewer for Linux.
It is similar to top, but allows you to scroll vertically and horizontally, so you can see all the processes running on the system, along with their full command lines, as well as viewing them as a process tree, selecting multiple processes and acting on them all at once.
Tasks related to processes (killing, renicing) can be done without entering their PIDs.
COMMAND-LINE OPTIONS Mandatory arguments to long options are mandatory for short options too.
-d --delay=DELAY Delay between updates, in tenths of seconds
-C --no-color --no-colour Start htop in monochrome mode
-h --help Display a help message and exit
-p --pid=PID,PID... Show only the given PIDs
-s --sort-key COLUMN Sort by this column (use --sort-key help for a column list)
-u --user=USERNAME Show only the processes of a given user
-v --version Output version information and exit
-t --tree Show processes in tree view
INTERACTIVE COMMANDS The following commands are supported while in htop:
Up, Alt-k Select (highlight) the previous process in the process list. Scroll the list if necessary.
Down, Alt-j Select (highlight) the next process in the process list. Scroll the list if necessary.
Left, Alt-h Scroll the process list left.
Right, Alt-l Scroll the process list right.
PgUp, PgDn Scroll the process list up or down one window.
Home Scroll to the top of the process list and select the first process.
End Scroll to the bottom of the process list and select the last process.
Ctrl-A, ^ Scroll left to the beginning of the process entry (i.e. beginning of line).
Ctrl-E, $ Scroll right to the end of the process entry (i.e. end of line).
Space Tag or untag a process. Commands that can operate on multiple processes, like "kill", will then apply over the list of tagged processes, instead of the currently highlighted one.
U Untag all processes (remove all tags added with the Space key).
s Trace process system calls: if strace(1) is installed, pressing this key will attach it to the currently selected process, presenting a live update of system calls issued by the process.
l Display open files for a process: if lsof(1) is installed, pressing this key will display the list of file descriptors opened by the process.
F1, h, ? Go to the help screen
F2, S Go to the setup screen, where you can configure the meters displayed at the top of the screen, set various display options, choose among color schemes, and select which columns are displayed, in which order.
F3, / Incrementally search the command lines of all the displayed processes. The currently selected (highlighted) command will update as you type. While in search mode, pressing F3 will cycle through matching occurrences.
F4, \ Incremental process filtering: type in part of a process command line and only processes whose names match will be shown. To cancel filtering, enter the Filter option again and press Esc.
F5, t Tree view: organize processes by parenthood, and layout the relations between them as a tree. Toggling the key will switch between tree and your previously selected sort view. Selecting a sort view will exit tree view.
F6 On sorted view, select a field for sorting, also accessible through < and >. The current sort field is indicated by a highlight in the header. On tree view, expand or collapse the current subtree. A "+" indicator in the tree node indicates that it is collapsed.
F7, ] Increase the selected process's priority (subtract from 'nice' value). This can only be done by the superuser.
F8, [ Decrease the selected process's priority (add to 'nice' value)
F9, k "Kill" process: sends a signal which is selected in a menu, to one or a group of processes. If processes were tagged, sends the signal to all tagged processes. If none is tagged, sends to the currently selected process.
F10, q Quit
I Invert the sort order: if sort order is increasing, switch to decreasing, and vice-versa.
+, - When in tree view mode, expand or collapse subtree. When a subtree is collapsed a "+" sign shows to the left of the process name.
a (on multiprocessor machines) Set CPU affinity: mark which CPUs a process is allowed to use.
u Show only processes owned by a specified user.
M Sort by memory usage (top compatibility key).
P Sort by processor usage (top compatibility key).
T Sort by time (top compatibility key).
F "Follow" process: if the sort order causes the currently selected process to move in the list, make the selection bar follow it. This is useful for monitoring a process: this way, you can keep a process always visible on screen. When a movement key is used, "follow" loses effect.
K Hide kernel threads: prevent the threads belonging the kernel to be displayed in the process list. (This is a toggle key.)
H Hide user threads: on systems that represent them differently than ordinary processes (such as recent NPTL-based systems), this can hide threads from userspace processes in the process list. (This is a toggle key.)
p Show full paths to running programs, where applicable. (This is a toggle key.)
Ctrl-L Refresh: redraw screen and recalculate values.
Numbers PID search: type in process ID and the selection highlight will be moved to it.
COLUMNS The following columns can display data about each process. A value of '-' in all the rows indicates that a column is unsupported on your system, or currently unimplemented in htop. The names below are the ones used in the "Available Columns" section of the setup screen. If a different name is shown in htop's main screen, it is shown below in parenthesis.
Command The full command line of the process (i.e. program name and arguments).
PID The process ID.
STATE (S) The state of the process: S for sleeping (idle) R for running D for disk sleep (uninterruptible) Z for zombie (waiting for parent to read its exit status) T for traced or suspended (e.g by SIGTSTP) W for paging
PPID The parent process ID.
PGRP The process's group ID.
SESSION (SID) The process's session ID.
TTY_NR (TTY) The controlling terminal of the process.
TPGID The process ID of the foreground process group of the controlling terminal.
MINFLT The number of page faults happening in the main memory.
CMINFLT The number of minor faults for the process's waited-for children (see MINFLT above).
MAJFLT The number of page faults happening out of the main memory.
CMAJFLT The number of major faults for the process's waited-for children (see MAJFLT above).
UTIME (UTIME+) The user CPU time, which is the amount of time the process has spent executing on the CPU in user mode (i.e. everything but system calls), measured in clock ticks.
STIME (STIME+) The system CPU time, which is the amount of time the kernel has spent executing system calls on behalf of the process, measured in clock ticks.
CUTIME (CUTIME+) The children's user CPU time, which is the amount of time the process's waited-for children have spent executing in user mode (see UTIME above).
CSTIME (CSTIME+) The children's system CPU time, which is the amount of time the kernel has spent executing system calls on behalf of all the process's waited-for children (see STIME above).
PRIORITY (PRI) The kernel's internal priority for the process, usually just its nice value plus twenty. Different for real-time processes.
NICE (NI) The nice value of a process, from 19 (low priority) to -20 (high priority). A high value means the process is being nice, letting others have a higher relative priority. The usual OS permission restrictions for adjust‐ ing priority apply.
STARTTIME (START) The time the process was started.
PROCESSOR (CPU) The ID of the CPU the process last executed on.
M_SIZE (VIRT) The size of the virtual memory of the process.
M_RESIDENT (RES) The resident set size (text + data + stack) of the process (i.e. the size of the process's used physical memory).
M_SHARE (SHR) The size of the process's shared pages.
M_TRS (CODE) The text resident set size of the process (i.e. the size of the process's executable instructions).
M_DRS (DATA) The data resident set size (data + stack) of the process (i.e. the size of anything except the process's executable instructions).
M_LRS (LIB) The library size of the process.
M_DT (DIRTY) The size of the dirty pages of the process.
ST_UID (UID) The user ID of the process owner.
PERCENT_CPU (CPU%) The percentage of the CPU time that the process is currently using.
PERCENT_MEM (MEM%) The percentage of memory the process is currently using (based on the process's resident memory size, see M_RESIDENT above).
USER The username of the process owner, or the user ID if the name can't be determined.
TIME (TIME+) The time, measured in clock ticks that the process has spent in user and system time (see UTIME, STIME above).
NLWP The number of threads in the process.
TGID The thread group ID.
CTID OpenVZ container ID, a.k.a virtual environment ID.
VPID OpenVZ process ID.
VXID VServer process ID.
RCHAR (RD_CHAR) The number of bytes the process has read.
WCHAR (WR_CHAR) The number of bytes the process has written.
SYSCR (RD_SYSC) The number of read(2) syscalls for the process.
SYSCW (WR_SYSC) The number of write(2) syscalls for the process.
RBYTES (IO_RBYTES) Bytes of read(2) I/O for the process.
WBYTES (IO_WBYTES) Bytes of write(2) I/O for the process.
CNCLWB (IO_CANCEL) Bytes of cancelled write(2) I/O.
IO_READ_RATE (DISK READ) The I/O rate of read(2) in bytes per second, for the process.
IO_WRITE_RATE (DISK WRITE) The I/O rate of write(2) in bytes per second, for the process.
IO_RATE (DISK R/W) The I/O rate, IO_READ_RATE + IO_WRITE_RATE (see above).
CGROUP Which cgroup the process is in.
OOM OOM killer score.
IO_PRIORITY (IO) The I/O scheduling class followed by the priority if the class supports it: R for Realtime B for Best-effort id for Idle
PERCENT_CPU_DELAY (CPUD%) The percentage of time spent waiting for a CPU (while runnable). Requires CAP_NET_ADMIN.
PERCENT_IO_DELAY (IOD%) The percentage of time spent waiting for the completion of synchronous block I/O. Requires CAP_NET_ADMIN.
PERCENT_SWAP_DELAY (SWAPD%) The percentage of time spent swapping in pages. Requires CAP_NET_ADMIN.
All other flags Currently unsupported (always displays '-').
CONFIG FILE By default htop reads its configuration from the XDG-compliant path ~/.config/htop/htoprc -- the configuration file is overwritten by htop's in-program Setup configuration, so it should not be hand-edited. If no user config‐ uration exists htop tries to read the system-wide configuration from /etc/htoprc and as a last resort, falls back to its hard coded defaults.
You may override the location of the configuration file using the $HTOPRC environment variable (so you can have multiple configurations for different machines that share the same home directory, for example).
MEMORY SIZES Memory sizes in htop are displayed as they are in tools from the GNU Coreutils (when ran with the --human-readable option). This means that sizes are printed in powers of 1024. (e.g., 1023M = 1072693248 Bytes)
The decision to use this convention was made in order to conserve screen space and make memory size representations consistent throughout htop.
SEE ALSO proc(5), top(1), free(1), ps(1), uptime(1), limits.conf(5)
AUTHORS htop is developed by Hisham Muhammad <hisham@gobolinux.org>.
This man page was written by Bartosz Fenski <fenio@o2.pl> for the Debian GNU/Linux distribution (but it may be used by others). It was updated by Hisham Muhammad, and later by Vincent Launchbury, who wrote the 'Columns' sec‐ tion.
htop 2.2.0 2015 HTOP(1)[root@d ~]#
Linux下取代top的进程管理工具 htop - 风雪之殇 - 博客园 https://www.cnblogs.com/phpandmysql/p/7944305.html
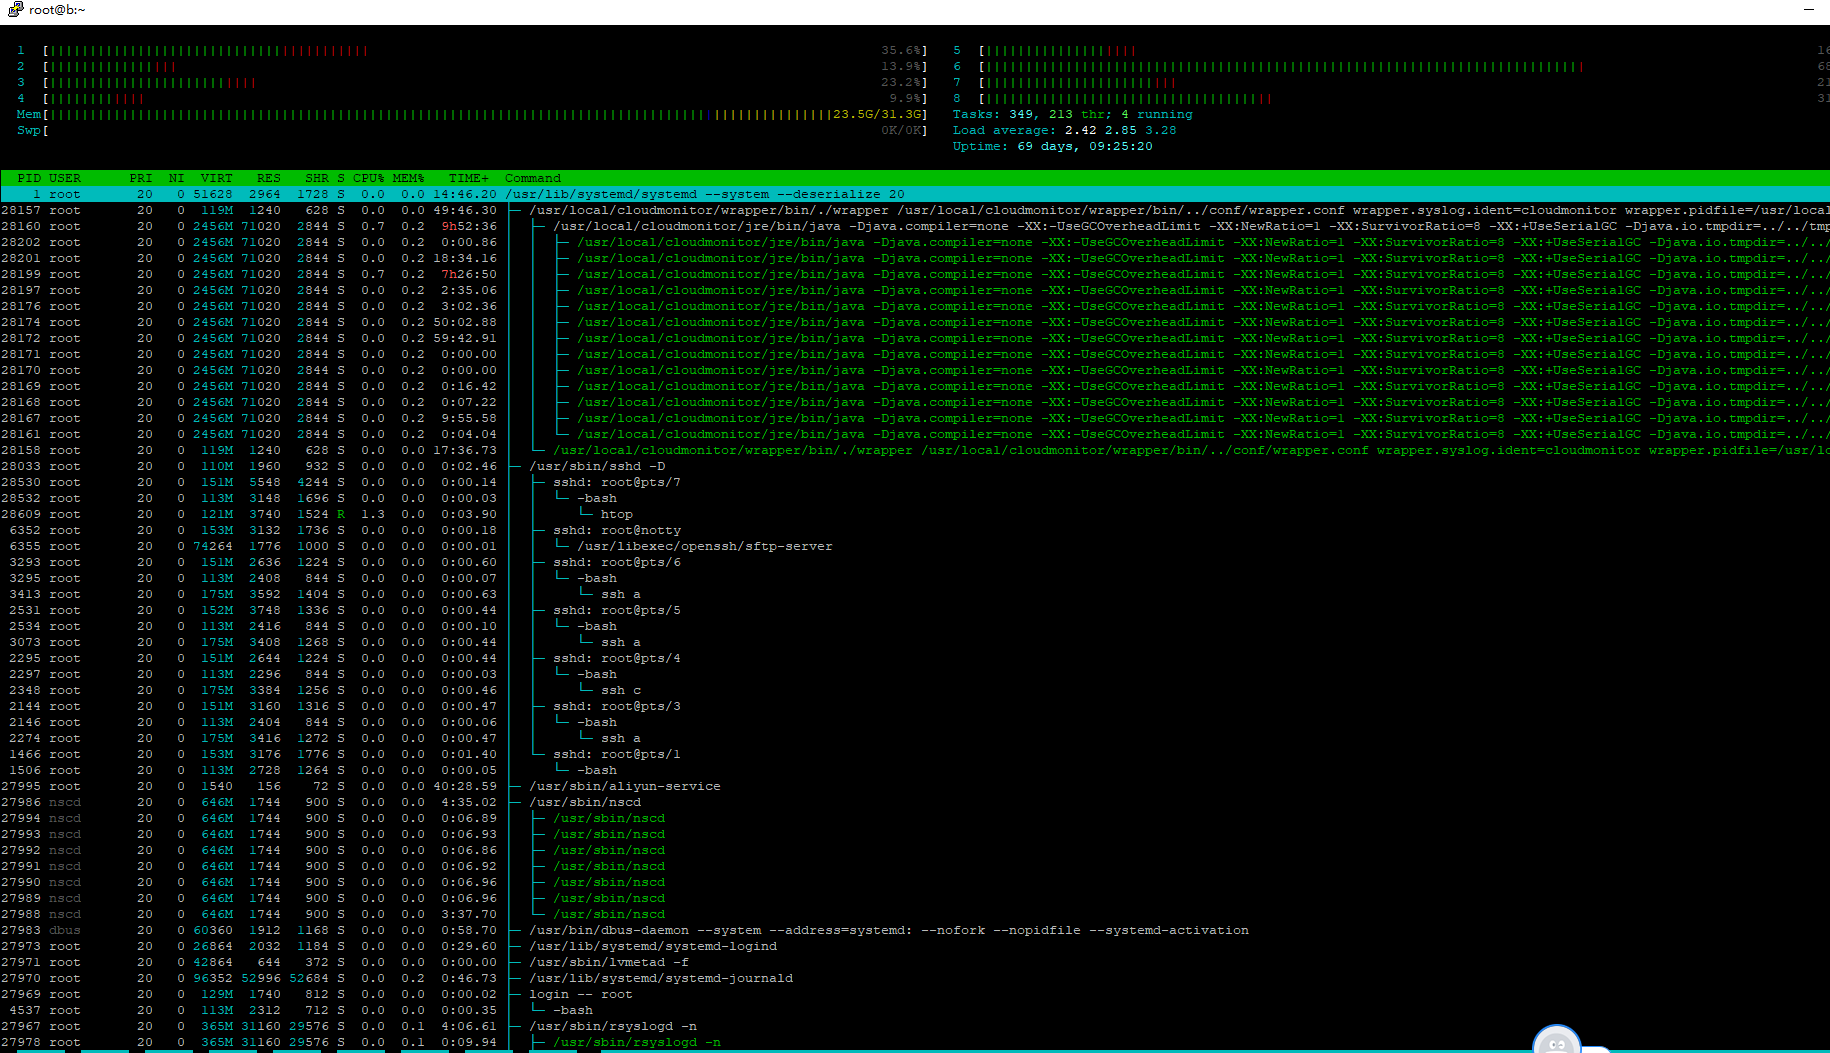
4.5. 显示树形结构
输入"t"或按下F5,显示树形结构,意思跟pstree 差不多,能看到所有程序树状执行的结构,这对于系统管理来说相当方便,理清程序是如何产生的,当然树状结构的浏览也可以依照其他数据来排序。

htop 分析 进程对资源的消耗的更多相关文章
- 鸿蒙内核源码分析(进程概念篇) | 进程在管理哪些资源 | 百篇博客分析OpenHarmony源码 | v24.01
百篇博客系列篇.本篇为: v24.xx 鸿蒙内核源码分析(进程概念篇) | 进程在管理哪些资源 | 51.c.h .o 进程管理相关篇为: v02.xx 鸿蒙内核源码分析(进程管理篇) | 谁在管理内 ...
- 鸿蒙内核源码分析(进程管理篇) | 谁在管理内核资源 | 百篇博客分析OpenHarmonyOS | v2.07
百篇博客系列篇.本篇为: v02.xx 鸿蒙内核源码分析(进程管理篇) | 谁在管理内核资源 | 51.c.h .o 进程管理相关篇为: v02.xx 鸿蒙内核源码分析(进程管理篇) | 谁在管理内核 ...
- Windows中查看进程的资源消耗(cpu, Disk,Memory,NetWork)
1.通过Windows Task Manager 的 Performance Tab 可以看到总体的性能消耗情况. 2.如果想看系统中每个进程的资源消耗,可以点击 下面的 Open Resource ...
- [linux]top命令详解-实时显示系统中各个进程的资源占用状况
简介 top命令是Linux下常用的性能分析工具,能够实时显示系统中各个进程的资源占用状况,类似于Windows的任务管理器. top显示系统当前的进程和其他状况,是一个动态显示过程,即可以通过用户按 ...
- 鸿蒙内核源码分析(进程回收篇) | 老父亲如何向老祖宗临终托孤 ? | 百篇博客分析OpenHarmony源码 | v47.01
百篇博客系列篇.本篇为: v47.xx 鸿蒙内核源码分析(进程回收篇) | 临终前如何向老祖宗托孤 | 51.c.h .o 进程管理相关篇为: v02.xx 鸿蒙内核源码分析(进程管理篇) | 谁在管 ...
- 鸿蒙内核源码分析(进程通讯篇) | 九种进程间通讯方式速揽 | 百篇博客分析OpenHarmony源码 | v28.03
百篇博客系列篇.本篇为: v28.xx 鸿蒙内核源码分析(进程通讯篇) | 九种进程间通讯方式速揽 | 51.c.h .o 进程通讯相关篇为: v26.xx 鸿蒙内核源码分析(自旋锁篇) | 自旋锁当 ...
- linux中使用top获取进程的资源占用信息
在linux中使用top获取进程的资源占用信息: Cpu(s): 1.0%us, 0.0%sy, 0.0%ni, 98.3%id, 0.7%wa, 0.0%hi, 0.0%si, 0.0 ...
- Linux 中查看进程及资源使用情况
top 自带的 top 命令类似于平时我们使用的任务管理器,能够列出当前系统中的进程及资源的使用情况. $ man top top - display Linux tasks 使用起来很简单,不加任何 ...
- [5]windows内核情景分析---进程线程
本篇主要讲述进程的启动过程.线程的调度与切换.进程挂靠 进程的启动过程: BOOL CreateProcess ( LPCTSTR lpApplicationName, ...
随机推荐
- php header函数下载文件实现代码
在php中header函数的使用很大,header不但可以向客户端发送原始的 HTTP 报头信息,同时还可以直接实现文件下载操作 header函数最常用的不是用于下载而是用于发送http类的 跳转 它 ...
- CentOS下rpm指令和yum指令详解
centos的软件安装大致可以分为两种类型: [centos]rpm文件安装,使用rpm指令 类似[ubuntu]deb文件安装,使用dpkg指令 [centos]yum安装 类似[ubuntu]ap ...
- Linux基础知识之history的详细说明
背景:history是Linux中常会用到内容,在工作中一些用户会突然发现其安装不了某个软件,于是寻求运维人员的帮助,而不给你说明他到底做了哪些坑爹的操作.此时你第一件要做的就是要查看其history ...
- 第八章 示例代码(MyBatis)
Sample Code JPetStore 6 is a full web application built on top of MyBatis 3, Spring 3 and Stripes. I ...
- 什么是mysql的元数据呢?
需求描述: 什么是mysql的元数据?metadata? 概念解释: 简单来说:任何描述数据库的数据就是数据库的元数据库(与数据库中存在的内容相对) 比如,用于描述一个冰箱是如何构成,怎么使用的就是冰 ...
- 超全面的JavaWeb笔记day10<Response&Request&路径&编码>
1.Response 2.Request 3.路径 4.编码 请求响应流程图 response 1.response概述 response是Servlet.service方法的一个参数,类型为java ...
- POJ 2392 Space Elevator(多重背包变形)
Q: 额外添加了最大高度限制, 需要根据 alt 对数据进行预处理么? A: 是的, 需要根据 alt 对数组排序 Description The cows are going to space! T ...
- 【RF库Collections测试】Get Dictionary Items
Name:Get Dictionary ItemsSource:Collections <test library>Arguments:[ dictionary ]Returns item ...
- poj_3580 伸展树
自己伸展树做的第一个题 poj 3580 supermemo. 题目大意 对一个数组进行维护,包含如下几个操作: ADD x, y, d 在 A[x]--A[y] 中的每个数都增加d REVERSE ...
- java高级---->Thread之BlockingQueue的使用
今天我们通过实例来学习一下BlockingQueue的用法.梦想,可以天花乱坠,理想,是我们一步一个脚印踩出来的坎坷道路. BlockingQueue的实例 官方文档上的对于BlockingQueue ...