2-3 Numpy+Matplotlib可视化(一)
(1)pyplot基础绘图
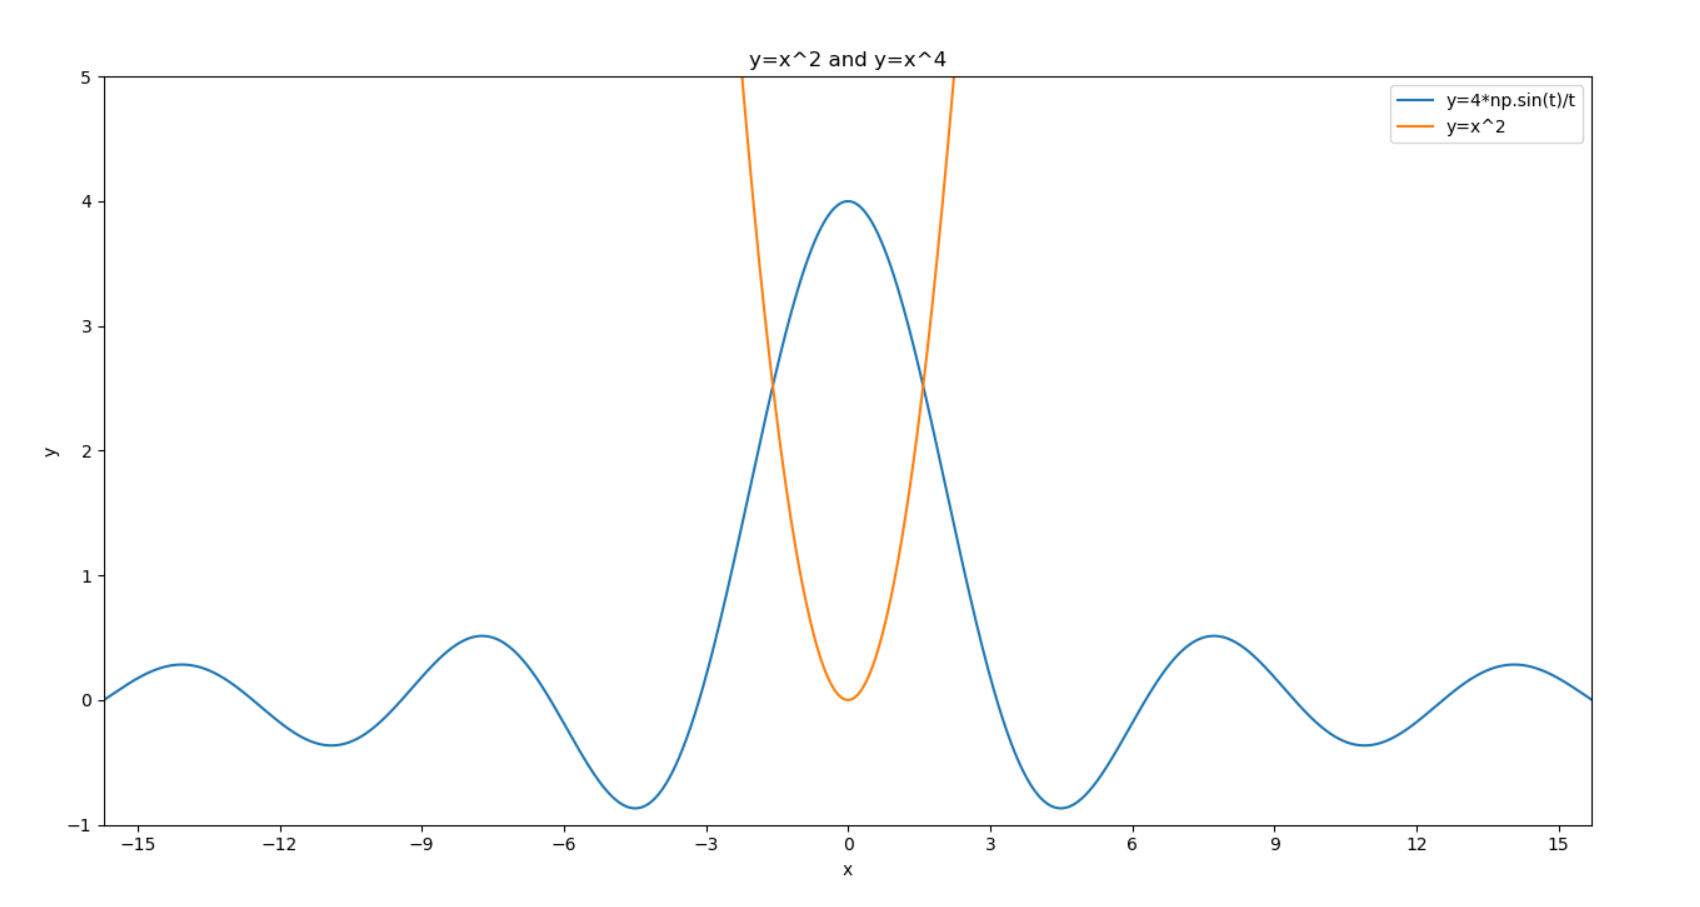
 # -*-coding:utf-8-*-

 # !/usr/bin/env python

 # Author:@vilicute

 import numpy as np

 import matplotlib.pyplot as plt

 t = np.arange(-5*np.pi, 5*np.pi, 0.01)

 plt.title('y=x^2 and y=x^4')  # 添加标题

 plt.xlabel('x')  # x轴名称

 plt.ylabel('y')  # y轴名称

 plt.xlim((-5*np.pi, 5*np.pi))  # x轴范围

 plt.ylim((-1, 5))  # y轴范围

 plt.xticks([-15, -12, -9, -6, -3, 0, 3, 6, 9, 12, 15])  # x轴刻度

 plt.yticks([-1, 0, 1, 2 , 3, 4, 5])  # y轴刻度

 plt.plot(t, 4*np.sin(t)/t)

 plt.plot(t, t**2)

 plt.legend(['y=4*np.sin(t)/t', 'y=x^2'])  # 标注说明

 plt.show()
(2)多图绘制
 # -*-coding:utf-8-*-

 # !/usr/bin/env python

 # Author:@vilicute

 import numpy as np

 import matplotlib.pyplot as plt

 t = np.arange(0, 2*np.pi, 0.01)

 pl = plt.figure(figsize=(8, 6), dpi=80)  # 确定画布大小

 ax1 = pl.add_subplot(2, 1, 1)  # 创建一个2行1列子图,第一个图

 plt.title('y=x^2 and y=x^4')  # 添加标题

 plt.xlabel('x')  # x轴名称

 plt.ylabel('y')  # y轴名称

 plt.xlim((0, 1))  # x轴范围

 plt.ylim((0, 1))  # y轴范围

 plt.xticks([0, 0.2, 0.4, 0.6, 0.8, 1.0])  # x轴刻度

 plt.yticks([0, 0.2, 0.4, 0.6, 0.8, 1.0])  # y轴刻度

 plt.plot(t, t**2)

 plt.plot(t, t**4)

 plt.legend(['y=x^2', 'y=x^4'])  # 标注说明

 ax2 = pl.add_subplot(2, 1, 2)  # 第二个图

 plt.title('sin(x) and cos(x)')

 plt.xlabel('x')

 plt.ylabel('y')

 plt.xlim((0, np.pi*2))

 plt.ylim((-1, 1))

 plt.xticks([0, np.pi/2, np.pi, 3*np.pi/2, np.pi*2])

 plt.yticks([-1, -0.5, 0, 0.5, 1.0])

 plt.plot(t, np.sin(t))

 plt.plot(t, np.cos(t))

 plt.legend(['sin(x)', 'cos(x)'])

 plt.show()

2-3 Numpy+Matplotlib可视化(一)的更多相关文章
- LogisticRegression in MLLib (PySpark + numpy+matplotlib可视化)
参考'LogisticRegression in MLLib' (http://www.cnblogs.com/luweiseu/p/7809521.html) 通过pySpark MLlib训练lo ...
- 2-4 Numpy+Matplotlib可视化(二)
自定义绘图 # -*-coding:utf-8-*- # !/usr/bin/env python # Author:@vilicute import numpy as np import matpl ...
- 【学习总结】GirlsInAI ML-diary day-21-初识 Numpy, Matplotlib, Seanborn [柱状图、折线图、箱图]
[学习总结]GirlsInAI ML-diary 总 原博github链接-day21 初识 Numpy, Matplotlib, Seanborn [柱状图.折线图.箱图] 一.Titanic练习赛 ...
- 国外大神制作的一个很棒的matplotlib 可视化教程
国外大神制作的一个很棒的matplotlib 可视化教程 参考:https://www.machinelearningplus.com/plots/top-50-matplotlib-visualiz ...
- 在mac安装numpy matplotlib scipy
p.p1 { margin: 0.0px 0.0px 0.0px 0.0px; font: 11.0px Menlo; color: #000000; background-color: #fffff ...
- Ubuntu-Python2.7安装 scipy,numpy,matplotlib 和pip
一. scipy,numpy,matplotlib sudo apt-get install python-scipy sudo apt-get install python-numpy sudo a ...
- NumPy Matplotlib库
NumPy - Matplotlib Matplotlib 是 Python 的绘图库. 它可与 NumPy 一起使用,提供了一种有效的 MatLab 开源替代方案. 它也可以和图形工具包一起使用,如 ...
- 21、numpy—Matplotlib
NumPy Matplotlib Matplotlib 是 Python 的绘图库. 它可与 NumPy 一起使用,提供了一种有效的 MatLab 开源替代方案. 它也可以和图形工具包一起使用,如 P ...
- SciKit-Learn 使用matplotlib可视化数据
章节 SciKit-Learn 加载数据集 SciKit-Learn 数据集基本信息 SciKit-Learn 使用matplotlib可视化数据 SciKit-Learn 可视化数据:主成分分析(P ...
随机推荐
- 阿里巴巴毕玄解密AIOps:一文读懂阿里巴巴运维体系的前世今生
[编者按]林昊(毕玄),阿里巴巴研发效能事业部负责人.2007年加入阿里,10年间打造了阿里目前使用最为广泛的核心中间件之一的服务框架:建设了阿里的HBase团队,发展到今天HBase已经是阿里最重要 ...
- NoSQL与关系数据库的比较
- linux为内核新增系统调用
1.编写hello.c文件,实现系统调用执行函数,如: asmlinkage long sys_helloworld(void){ printk( "helloworld!"); ...
- 学习Python:StringIO与cStringIO
StringIO的行为与file对象非常像,但它不是磁盘上文件,而是一个内存里的“文件”,我们可以将操作磁盘文件那样来操作StringIO.一个简单的例子,让你对StringIO有一个感性的认识: f ...
- 后缀自动机SAM
某神犇:"初三还不会后缀自动机,那就退役吧!" 听到这句话后,我的内心是崩溃的. 我还年轻,我还不想退役--于是,我在后来,努力地学习后缀自动机. 终于,赶在初三开学前,我终于学会 ...
- 一条sql获取每个类别最新的一条记录
1.初始化数据 create table Products ( id ,), name ), categroy int, addtime datetime , ) insert into Produc ...
- Ionic 发送Http post PHP 获取不到数据
1.app.js 配置请求设置 $httpProvider.defaults.headers.post={ 'Content-Type':'application/x-www-form-urlenco ...
- HTML5 drag拖动事件
参考链接:https://segmentfault.com/a/1190000013606983 例子: <!DOCTYPE HTML> <html> <head> ...
- PAT甲级——A1063 Set Similarity
Given two sets of integers, the similarity of the sets is defined to be /, where Nc is the number ...
- Activiti实战02_环境搭建
1:下载Activiti 访问:https://www.activiti.org/download-bpm 可以下载Activiti相关文档和历史版本压缩包,在 https://www.activit ...