
Monit : 开源监控工具介绍
· Monit 简介
Monit是一个轻量级(500KB)跨平台的用来监控Unix/linux系统的开源工具。部署简单,并且不依赖任何第三方程序、插件或者库。
Monit可以监控服务器进程、文件、文件系统、网络状态(HTTP/SMTP等协议)、远程主机、服务器资源变化等等。 并且可以设定资源变化后需要做的动作,比如服务失败后自动重启,邮件告警等等。
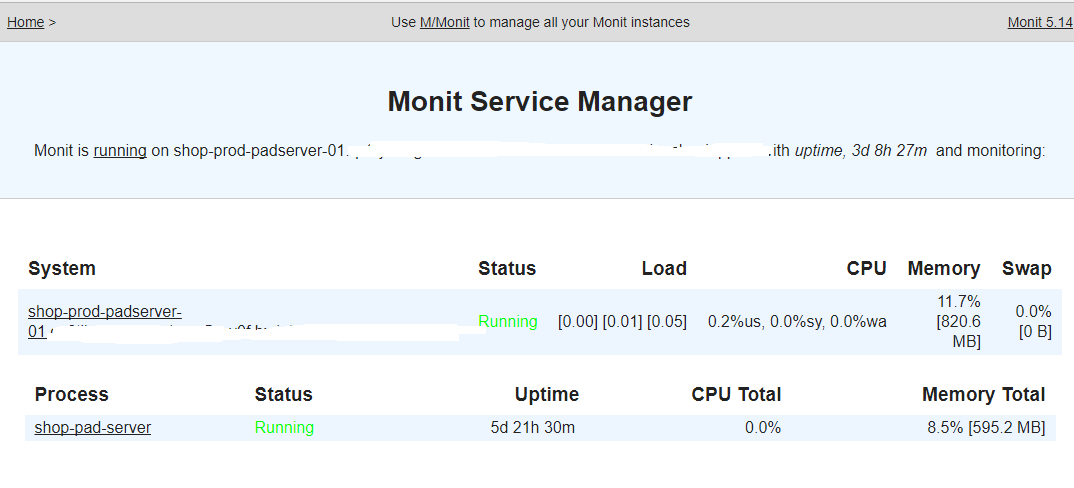
Monit内置了WEB UI,可以一目了然地了解监控项的情况。Monit是监控本机服务的工具,M/Monit是其配套产品用以对Monit统一管理,但是M/Monit并不是开源的,需要购买。
本文我们介绍在CentOS7.3上部署Monit用来监控进程状态,并实现服务失败后自动重启以及邮件告警通知的功能。监控其他资源的方法在默认配置文件中都有举例这里不一一介绍。
Monit官网:https://mmonit.com/monit
Monit手册:https://mmonit.com/monit/documentation/monit.html
· Monit 安装
# rpm -ivh http://dl.fedoraproject.org/pub/epel/6/i386/epel-release-6-8.noarch.rpm

# yum install -y monit
·Monit 常用命令
monit -t # 配置文件检测

monit # 启动monit daemon

monit -c /var/monit/monitrc # 启动monit daemon时指定配置文件

monit reload # 重新加载配置文件

monit status # 查看所有监控项务状态

monit status nginx # 查看nginx服务状态

monit stop all # 停止所有服务,这里需要注意的是,如果开启了自动重启功能,停止某个被监控的服务必须用monit stop xxx,若用系统命令停止服务,Monit会自动再把服务起来。

monit stop nginx # 停止nginx服务

monit start all # 启动所有服务

monit start nginx # 启动nginx服务

monit -V # 查看版本
·Monit 配置文件
/etc/monit.conf 主配置文件
/etc/monit.d/ 各项服务单独配置文件路径,在主配置文件中将其include进来。
/etc/monit.conf 举例说明:
配置文件关键字:'if', 'and', 'with(in)', 'has', 'us(ing|e)', 'on(ly)', 'then', 'for', 'of'
###############################################################################

## Monit control file

###############################################################################

##

## Comments begin with a '#' and extend through the end of the line. Keywords

## are case insensitive. All path's MUST BE FULLY QUALIFIED, starting with '/'.

##

## Below you will find examples of some frequently used statements. For

## information about the control file and a complete list of statements and

## options, please have a look in the Monit manual.

##

##

###############################################################################

## Global section

###############################################################################

##

## Start Monit in the background (run as a daemon):

#
# 设置检测周期30s

set daemon                # check services at  seconds intervals

#   with start delay     # optional: delay the first check by -minutes (by

#                           # default Monit check immediately after Monit start)

#

#

## Set syslog logging. If you want to log to a standalone log file instead,

## specify the full path to the log file

#
#设置log路径,这里默认记录到syslog

set logfile syslog

#

#

## Set the location of the Monit lock file which stores the process id of the

## running Monit instance. By default this file is stored in $HOME/.monit.pid

#

# set pidfile /var/run/monit.pid

#

## Set the location of the Monit id file which stores the unique id for the

## Monit instance. The id is generated and stored on first Monit start. By

## default the file is placed in $HOME/.monit.id.

#

# set idfile /var/.monit.id

#

## Set the location of the Monit state file which saves monitoring states

## on each cycle. By default the file is placed in $HOME/.monit.state. If

## the state file is stored on a persistent filesystem, Monit will recover

## the monitoring state across reboots. If it is on temporary filesystem, the

## state will be lost on reboot which may be convenient in some situations.

#

# set statefile /var/.monit.state

#

## Set the list of mail servers for alert delivery. Multiple servers may be

## specified using a comma separator. If the first mail server fails, Monit

# will use the second mail server in the list and so on. By default Monit uses

# port  - it is possible to override this with the PORT option.

#

# set mailserver mail.bar.baz,               # primary mailserver

#                backup.bar.baz port ,  # backup mailserver on port

#                localhost                   # fallback relay

#
# 设置邮件服务器用来发送邮件告警通知

  set mailserver mail.abcd.so

#

## By default Monit will drop alert events if no mail servers are available.

## If you want to keep the alerts for later delivery retry, you can use the

## EVENTQUEUE statement. The base directory where undelivered alerts will be

## stored is specified by the BASEDIR option. You can limit the queue size

## by using the SLOTS option (if omitted, the queue is limited by space

## available in the back end filesystem).

#

# set eventqueue

#     basedir /var/monit  # set the base directory where events will be stored

#     slots            # optionally limit the queue size

#

#

## Send status and events to M/Monit (for more informations about M/Monit

## see http://mmonit.com/). By default Monit registers credentials with

## M/Monit so M/Monit can smoothly communicate back to Monit and you don't

## have to register Monit credentials manually in M/Monit. It is possible to

## disable credential registration using the commented out option below.

## Though, if safety is a concern we recommend instead using https when

## communicating with M/Monit and send credentials encrypted.

#

# set mmonit http://monit:monit@192.168.1.10:8080/collector

#     # and register without credentials     # Don't register credentials

#

#

## Monit by default uses the following format for alerts if the the mail-format

## statement is missing::

## --<--
# 设置邮件告警通知格式

 set mail-format {

      from: monit@$HOST

   subject: monit alert --  $EVENT $SERVICE

   message: $EVENT Service $SERVICE

                 Date:        $DATE

                 Action:      $ACTION

                 Host:        $HOST

                 Description: $DESCRIPTION

            Your faithful employee,

            Monit

 }

## --<--

##

## You can override this message format or parts of it, such as subject

## or sender using the MAIL-FORMAT statement. Macros such as $DATE, etc.

## are expanded at runtime. For example, to override the sender, use:

#

# set mail-format { from: monit@foo.bar }

#

#

## You can set alert recipients whom will receive alerts if/when a

## service defined in this file has errors. Alerts may be restricted on

## events by using a filter as in the second example below.

#
# 设置邮件告警通知人,Monit默认会通知monit进程本身的变化情况,如果不想收到monit进程自身的通知,加上but not on {instance}配置

 set alert  weian@abcd.so but not on { instance }                    # receive all alerts

#

## Do not alert when Monit starts, stops or performs a user initiated action.

## This filter is recommended to avoid getting alerts for trivial cases.

#

# set alert weian@abcd.so

#

#

## Monit has an embedded HTTP interface which can be used to view status of

## services monitored and manage services from a web interface. The HTTP

## interface is also required if you want to issue Monit commands from the

## command line, such as 'monit status' or 'monit restart service' The reason

## for this is that the Monit client uses the HTTP interface to send these

## commands to a running Monit daemon. See the Monit Wiki if you want to

## enable SSL for the HTTP interface.

#
# 设置UI界面访问信息

set httpd port  and

    use address 10.2.2.28  # only accept connection from localhost

#   allow localhost        # allow localhost to connect to the server and

    allow admin:monit      # require user 'admin' with password 'monit'

###############################################################################

## Services

###############################################################################

##

## Check general system resources such as load average, cpu and memory

## usage. Each test specifies a resource, conditions and the action to be

## performed should a test fail.

#

#  check system $HOST

#    if loadavg (1min) >  then alert

#    if loadavg (5min) >  then alert

#    if cpu usage > % for  cycles then alert

#    if memory usage > % then alert

#    if swap usage > % then alert

#

#

## Check if a file exists, checksum, permissions, uid and gid. In addition

## to alert recipients in the global section, customized alert can be sent to

## additional recipients by specifying a local alert handler. The service may

## be grouped using the GROUP option. More than one group can be specified by

## repeating the 'group name' statement.

#

#  check file apache_bin with path /usr/local/apache/bin/httpd

#    if failed checksum and

#       expect the sum 8f7f419955cefa0b33a2ba316cba3659 then unmonitor

#    if failed permission  then unmonitor

#    if failed uid root then unmonitor

#    if failed gid root then unmonitor

#    alert security@foo.bar on {

#           checksum, permission, uid, gid, unmonitor

#        } with the mail-format { subject: Alarm! }

#    group server

#

#

## Check that a process is running, in this case Apache, and that it respond

## to HTTP and HTTPS requests. Check its resource usage such as cpu and memory,

## and number of children. If the process is not running, Monit will restart

## it by default. In case the service is restarted very often and the

## problem remains, it is possible to disable monitoring using the TIMEOUT

## statement. This service depends on another service (apache_bin) which

## is defined above.

#

#  check process apache with pidfile /usr/local/apache/logs/httpd.pid

#    start program = "/etc/init.d/httpd start" with timeout  seconds

#    stop program  = "/etc/init.d/httpd stop"

#    if cpu > % for  cycles then alert

#    if cpu > % for  cycles then restart

#    if totalmem > 200.0 MB for  cycles then restart

#    if children >  then restart

#    if loadavg(5min) greater than  for  cycles then stop

#    if failed host www.tildeslash.com port  protocol http

#       and request "/somefile.html"

#    then restart

#    if failed port  type tcpssl protocol http

#       with timeout  seconds

#    then restart

#    if  restarts within  cycles then unmonitor

#    depends on apache_bin

#    group server

#
# 监控进程可以通过上面监控pid文件的方式,当没有pid文件时,可以通过MATCHING正则表达式来匹配进程。
# 测试一个进程是否匹配来自命令行使用的模式monit procmatch "regex-pattern",这将列出匹配或不匹配的所有进程,regex模式。
# 我们这里监控了包含shop-pad-server字段的进程,并指明了启动以及停止的命令,这样在进程因故断掉后,Monit会自动重启进程。
# 同时若进程ID变动,会发送邮件通知到之前指定的收件人。
   check process shop-pad-server with MATCHING shop-pad-server

      start program = "/usr/bin/nohup /home/azureuser/pad-server/run.sh > /home/azureuser/pad-server/nohup.out 2>&1 &"

      stop program  = "/usr/bin/ps -ef | /usr/bin/grep shop-pad| /usr/bin/grep -v grep | /usr/bin/awk '{print $2}' | xargs kill"

      if changed pid then alert
#

## Check filesystem permissions, uid, gid, space and inode usage. Other services,

## such as databases, may depend on this resource and an automatically graceful

## stop may be cascaded to them before the filesystem will become full and data

## lost.

#

#  check filesystem datafs with path /dev/sdb1

#    start program  = "/bin/mount /data"

#    stop program  = "/bin/umount /data"

#    if failed permission  then unmonitor

#    if failed uid root then unmonitor

#    if failed gid disk then unmonitor

#    if space usage > % for  times within  cycles then alert

#    if space usage > % then stop

#    if inode usage >  then alert

#    if inode usage > % then stop

#    group server

#

#

## Check a file's timestamp. In this example, we test if a file is older

## than  minutes and assume something is wrong if its not updated. Also,

## if the file size exceed a given limit, execute a script

#

#  check file database with path /data/mydatabase.db

#    if failed permission  then alert

#    if failed uid data then alert

#    if failed gid data then alert

#    if timestamp >  minutes then alert

#    if size >  MB then exec "/my/cleanup/script" as uid dba and gid dba

#

#

## Check directory permission, uid and gid.  An event is triggered if the

## directory does not belong to the user with uid  and gid .  In addition,

## the permissions have to match the octal description of  (see chmod()).

#

#  check directory bin with path /bin

#    if failed permission  then unmonitor

#    if failed uid  then unmonitor

#    if failed gid  then unmonitor

#

#

## Check a remote host availability by issuing a ping test and check the

## content of a response from a web server. Up to three pings are sent and

## connection to a port and an application level network check is performed.

#

#  check host myserver with address 192.168.1.1

#    if failed ping then alert

#    if failed port  protocol mysql with timeout  seconds then alert

#    if failed port  protocol http

#       and request /some/path with content = "a string"

#    then alert

#

#

## Check a network link status (up/down), link capacity changes, saturation

## and bandwidth usage.

#

#  check network public with interface eth0

#    if failed link then alert

#    if changed link then alert

#    if saturation > % then alert

#    if download >  MB/s then alert

#    if total upload >  GB in last hour then alert

#

#

## Check custom program status output.

#

#  check program myscript with path /usr/local/bin/myscript.sh

#    if status !=  then alert

#

#

###############################################################################

## Includes

###############################################################################

##

## It is possible to include additional configuration parts from other files or

## directories.

#

#  include /etc/monit.d/*

#

# 导入其他单项服务的监控配置

# Include all files from /etc/monit.d/

include /etc/monit.d/*
· 通知周期设置
Monit默认情况下如果一个服务失败只发送一个通知:

  alert foo@bar

如果您希望在服务保持处于失败状态时每十个周期通知一次,您可以使用:

  alert foo@bar with reminder on  cycles

同样,如果您想在每个失败的周期获得通知,您可以使用:

  alert foo@bar with reminder on  cycle

要禁止某些用户和服务的警报,可以在服务检查的局部配置里添加语句:

  noalert mail-address
· 服务检测周期设置
可以使用every语句修改服务检查计划。

.轮询周期倍数

EVERY [number] CYCLES

.Cron-style

EVERY [cron]

# [cron]

# * * * * *

# 分 时 日 月 周

.与Cron-style相反(do-not-check)

NOT EVERY [cron]

示例:

示例1:每两个周期检查一次

check process nginx with pidfile /var/run/nginx.pid

every  cycles

示例2:在上午8点到下午7点之间检查每个工作日

check program checkOracleDatabase

with path /var/monit/programs/checkoracle.pl

every "* 8-19 * * 1-5"

示例3:在星期日0AM到3AM之间不要在备份窗口中运行检查,否则运行具有常规轮询周期频率的检查。

check process mysqld with pidfile /var/run/mysqld.pid

not every "* 0-3 * * 0"

注意不要使用特定的分钟,因为Monit可能不会在那分钟运行。
· WEB UI界面
参考:
http://www.cnblogs.com/52fhy/p/6412547.html
http://blog.csdn.net/senlin1202/article/details/54291176
https://mmonit.com/monit/documentation/monit.html
Monit : 开源监控工具介绍的更多相关文章
- 比Kafka Mangaer更优秀的开源监控工具-Kafka Eagle
比Kafka Mangaer更优秀的开源监控工具-Kafka Eagle 作者:尹正杰 版权声明:原创作品,谢绝转载!否则将追究法律责任. 在Kafka的监控系统中有很多优秀的开源监控系统.比如Kaf ...
- windows下nodejs express安装及入门网站,视频资料,开源项目介绍
windows下nodejs express安装及入门网站,视频资料,开源项目介绍,pm2,supervisor,npm,Pomelo,Grunt安装使用注意事项等总结 第一步:下载安装文件下载地址: ...
- JVM监控工具介绍
JVM监控工具介绍 VisualVM是一种集成了多个JDK命令行工具的可视化工具,它能为您提供强大的分析能力.所有这些都是免费的!它囊括的命令行工具包括jps,jstat,jmap,jinfo,jst ...
- 【转帖】四种BI 开源工具介绍-SpagoBI,openI,JasperSoft,Pentaho
四种BI 开源工具介绍-SpagoBI,openI,JasperSoft,Pentaho 1 BI系统的简述 从技术角度来说 BI 包含了 ETL.DW.OLAP.DM等多环节.简单的说就是把交易系统 ...
- 【Slickflow学习】.NET开源工作流介绍、下载(一)
第一次自己写博客文章,大家多多指教.写博客主要记录一下学习的过程,给初学者提供下参考,也留给自己做备忘. Slickflow .NET开源工作流-介绍 这里摘录Slickflow官网的介绍: Slic ...
- Linux系统性能监控工具介绍之-tsar
Linux系统性能监控工具介绍之-tsar Linux系统性能监控工具介绍之-tsar 2017-03-02 20:25 175人阅读 评论(0) 收藏 举报 分类: LINUX调优(9) 目 ...
- 揭开webRTC媒体服务器的神秘面纱——WebRTC媒体服务器&开源项目介绍
揭开webRTC媒体服务器的神秘面纱--WebRTC媒体服务器&开源项目介绍 WebRTC生态系统是非常庞大的.当我第一次尝试理解WebRTC时,网络资源之多让人难以置信.本文针对webRTC ...
- 6个P2P流媒体开源项目介绍
P2P流媒体开源项目介绍 1. PeerCast 2002年成立,最早的开源P2P流媒体项目.PeerCast把节点按树结构组织起来, 每个频道都是一个树, 直播源是根节点,父节点只给子节点提供数据 ...
- 各种开源协议介绍 BSD、Apache Licence、GPL V2 、GPL V3 、LGPL、MIT_转
转自:各种开源协议介绍 BSD.Apache Licence.GPL V2 .GPL V3 .LGPL.MIT 现今存在的开源协议很多,而经过Open Source Initiative组织通过批准的 ...
随机推荐
- spring mvc:属性无法自动注入
在使用spring mvc 3开发一个项目模块时,遇到这样一个奇怪的问题: 前端页面发送的请求中,所有参数都无法自动注入到指定的@ModelAttribute对象中,经过检查,参数名称与接受对象的属性 ...
- [ASP.NET MVC]笔记(四 UnobtruSive AJAX和客户端验证
UnobtruSive AJAX和客户端验证 ASP.NET MVC 已经默认开启非侵入试js和客户端验证,在web.config可以看到如下配置: <configuration> < ...
- AFN和SDWebImage请求网络图片的一点问题
问题1.AFN 处理有关图片相关的请求的问题 在使用AFN Post网络图片的时候发现NSLocalizedDescription=Request failed: unacceptable conte ...
- 基于NIOS-II的示波器:PART1 按键&显示屏驱动&界面
NIOS II 相关资料以及基础入门 <NiosII的奇幻漂流> <Nios II那些事儿> 本文所有的硬件基础以及工程参考来自魏坤示波仪,重新实现驱动并重构工程. 基于NIO ...
- 半个月学习的it内容
1 基本头部标签: 1 head: HEAD里面主要放一些有关网页设置的相关语句-->2编码格式: 设置网页的字符集编码格式:GB2312,简体中文的编码格式 GBK:扩展的国标码,比国标码多 ...
- 201521123076 《Java程序设计》 第十四周学习总结
1. 本周学习总结 1.1 以你喜欢的方式(思维导图或其他)归纳总结多数据库相关内容. 2. 书面作业 1. MySQL数据库基本操作 建立数据库,将自己的姓名.学号作为一条记录插入.(截图,需出现自 ...
- 201521123010 《Java程序设计》第10周学习总结
1. 本周学习总结 1.1 以你喜欢的方式(思维导图或其他)归纳总结异常与多线程相关内容. 2. 书面作业 本次PTA作业题集异常.多线程 ①finally 题目4-2 1.1 截图你的提交结果(出现 ...
- 201521123078 《Java程序设计》第11周学习总结
1. 本周学习总结 1.1 以你喜欢的方式(思维导图或其他)归纳总结多线程相关内容. 2. 书面作业 1.互斥访问与同步访问 1.1 除了使用synchronized修饰方法实现互斥同步访问,还有什么 ...
- 201521123001《Java程序设计》第11周学习总结
1. 本周学习总结 以你喜欢的方式(思维导图.OneNote或其他)归纳总结多网络相关内容. 2. 书面作业 1. 网络基础 1.1 比较ping www.baidu.com与ping cec.jmu ...
- 在linux环境下搭建java web测试环境(非常详细!!)
一.项目必备软件及基本思路 项目必备:虚拟机:VMware Workstation (已安装linux的 CentOS6.5版本) 项目:java web项目 (必须在本地部署编译后选择项目的webR ...