Short jhat tutorial: diagnosing OutOfMemoryError by example
转自: http://petermodzelewski.blogspot.com/2013/06/short-jhat-tutorial-diagnosing.html
jhat这个工具经过使用, 发现非常不好用, 分析稍微比较大一点的dumo文件就会非常慢, 而且占用内存太大, 所以建议用mat.这个教材写的还是不错的, 所以先转载一下
Last time we've learned what can be the reason of OutOfMemoryErrors and what tool-chain can we use to diagnose it. Today we will learn by example how to use the most important one: jhat.
I've prepared a sample project for this exercise, which can be cloned from github. The code is really simple and its problem is obvious, but this simplicity will make it easy to get to know jhat.
First, we need to run our program. We will use small heap size, for two reasons:
- Program will throw the exception faster
- jhat will start more quickly, as the heap dump will be smaller
|
1
2
3
4
5
6
7
|
$ git clone https://github.com/petermodzelewski/snippets.git$ cd snippets/OutOfMemoryErrorGenerator/$ mvn package$ java -Xmx128m -Xms128m -jar target/OutOfMemoryErrorGenerator-1.0.jarException in thread "main" java.lang.OutOfMemoryError: Java heap space at pl.keyer.oome.generator.Sleepyhead(Sleepyhead.java:6) at pl.keyer.oome.generator.App.main(App.java:11) |
We can notice, that the program is still running. We will need another console to run jhat. We are using the following commands:
|
1
2
3
4
5
6
7
8
9
10
11
12
13
14
|
$ jps -l752 target/OutOfMemoryErrorGenerator-1.0.jar4480 sun.tools.jps.Jps$ jmap -dump:file=dump.map 752$ jhat -port 7401 dump.mapReading from dump.map...Dump file created Sat Jun 01 23:25:55 CEST 2013Snapshot read, resolving...Resolving 561438 objects...Chasing references, expect 112 dots................................................................................................................Eliminating duplicate references................................................................................................................Snapshot resolved.Started HTTP server on port 7401Server is ready. |
Important notes about that process:
- All commands must be executed by the same user: the java process owner
- The "expect X dots" message is not a joke. While processing bigger heap dumps one can check the number of dots there in editor to see the progress, as it can take quite a while to process such a file.
- When processing bigger dumps one must watch heap size of jhat itself. This depends on the case, but to be safe (provided with enough resources) jhat should have 2-4 times more heap size, than process heap it will diagnose. If memory size for jhat is too small it will just crush after using it and the process will need to be repeated with bigger amount of memory. For example to provide jhat with 4 gigs the command will be:
1
$ jhat -port7401-J-mx4G dump.map - Diagnosed process may be terminated after dumping heap with jmap.
- Obviously jhat can be run on any machine where the dump will be present. On many occasions developers choose to zip the dump and move the debug process to machine more accessible for them and with enough ram.
After executing the commands we can visit http://localhost:7401/
When facing with jhat You will quickly realize that this tool is from times, where such tools were designed without consideration of prettiness or usability. This tutorial will show how to navigate it in most cases - all it's features are cool and necessary, but everyday programmer will use only subset of them to quickly diagnose where the OOME came from.
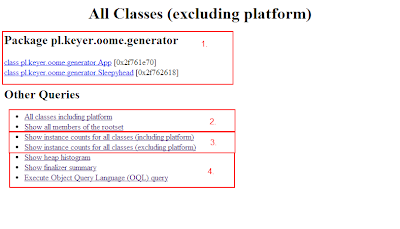
jhat main page can be divided into sections:
- List of all classes in your program (excluding platform - that is, all that is not from standard library). This list is normally really long and in most cases it is not necessary. Normally You will scroll down to "Other Queries" section right away.
- More options for listing classes
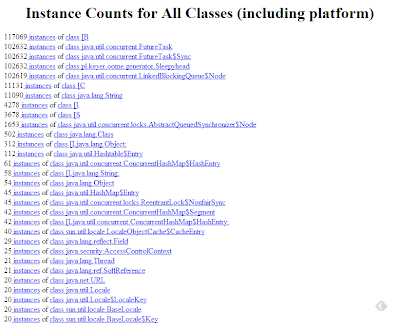
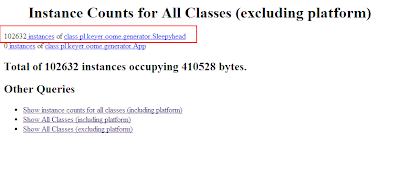
- Bread and butter of memory debugging, we will use them in a moment
- More tools for debugging, but not as helpfull as section 3.
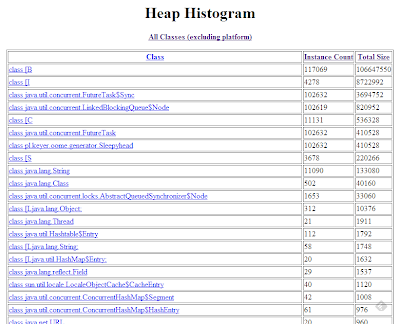
- Heap histogram is sometimes useful to compare quantity vs size of objects
- When you become jhat ninja, you sometimes could use OQLto diagnose the application. It is a SQL-like language for searching heap and calculating it's statistics.
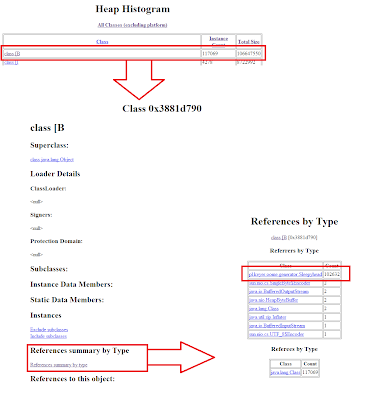
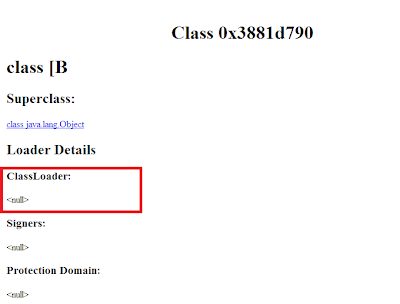
http://localhost:7401/class/0x3881d790
so the reference by type summery will have url as follow:
http://localhost:7401/refsByType/0x3881d790
Short jhat tutorial: diagnosing OutOfMemoryError by example的更多相关文章
- Java中的OutOfMemoryError的各种情况及解决和JVM内存结构
在JVM中内存一共有3种:Heap(堆内存),Non-Heap(非堆内存) [3]和Native(本地内存). [1] 堆内存是运行时分配所有类实例和数组的一块内存区域.非堆内存包含方法区和JVM内部 ...
- PBS命令和使用
PBS是公开源代码的作业管理系统,在此环境下运行,用户不需要指定程序在哪些节点上运行,程序所需的硬件资源由PBS管理和分配. PBS(Portable Batch System)是由NASA开发的灵活 ...
- Kristen Grauman
http://www.cs.utexas.edu/~grauman/ CV Publications Code Data Short ...
- 游戏引擎架构 (Jason Gregory 著)
第一部分 基础 第1章 导论 (已看) 第2章 专业工具 (已看) 第3章 游戏软件工程基础 (已看) 第4章 游戏所需的三维数学 (已看) 第二部分 低阶引擎系统 第5章 游戏支持系统 (已看) 第 ...
- Unity性能优化(2)-官方教程Diagnosing performance problems using the Profiler window翻译
本文是Unity官方教程,性能优化系列的第二篇<Diagnosing performance problems using the Profiler window>的简单翻译. 相关文章: ...
- JVM性能调优监控工具jps、jstack、jmap、jhat、jstat、hprof使用详解
摘要: JDK本身提供了很多方便的JVM性能调优监控工具,除了集成式的VisualVM和jConsole外,还有jps.jstack.jmap.jhat.jstat.hprof等小巧的工具,本博客希望 ...
- JVM性能调优监控工具jps、jstack、jmap、jhat、jstat使用详解(转VIII)
JVM本身就是一个java进程,一个java程序运行在一个jvm进程中.多个java程序同时运行就会有多个jvm进程.一个jvm进程有多个线程至少有一个gc线程和一个用户线程. JDK本身提供了很多方 ...
- 遭遇OutOfMemoryError
这几天,网店系统基础架构进行了一次大的升级,升级之后例行的进行了压力测试,以前几次大的项目发布压力测试都没有任何问题,没想到这次出事故啦,而且是内存泄露? 系统运行环境:硬件:Intel(R) Xeo ...
- UE4 Tutorial - Custom Mesh Component 用于绘制自定义网格的插件CustomMeshComponent
UE4 中用于绘制自定义网格的插件CustomMeshComponent. 转载: UE4 Tutorial - Custom Mesh Component Over the last few w ...
随机推荐
- ceph中用sgdisk工具进行分区--------固定uuid
ceph中两种类型分区的type code: type type code journal 45b0969e-9b03-4f30-b4c6-b4b80ceff106 osd 4fbd7e29-9d25 ...
- SVN 提交、更新、解决冲突等操作步骤
1. 纳入版本控制 ①新建文件abc.txt ②在文件上点右键 ③添加后文件图标发生变化 2. 提交 ①使用TortoiseSVN可以提交具体某一个文件,或某一个目录下的所有改变.方法就是在想要提交的 ...
- Python与快速排序
这个算法系列主要是自己学习算法过程中动手实践一下,写这个文章作为笔记和分享个人心得,如有错误请各位提出. 注:转载请说明出处 问题提出: 将以下数据升序排列:5, 2, 8, 6, 4, 9, 7, ...
- myBaits缓存
转自:https://blog.csdn.net/zhongzh86/article/details/50019511 9. Mybatis 缓存 正如大多数持久层框架一样,MyBatis 同样提供了 ...
- 5.Redis 发布订阅
转自:http://www.runoob.com/redis/redis-tutorial.html Redis 发布订阅(pub/sub)是一种消息通信模式:发送者(pub)发送消息,订阅者(sub ...
- UNITY 带spriterender的对象导出为prefab时主贴图丢失的BUG
从场景导出带有sprite的对象为prefab时贴图丢失的BUG.解决方案:对场景中每个sprite重新赋一下贴图,然后导出就好了,原因不明. 补充:这个有时候是因为贴图类型不是 2D AND UI ...
- jBPM4.4 eclipse插件安装
一.工具下载 jBPM 图形化流程设计器采用eclipse做为平台,我们可以先到jBPM官方网站下jBPM4.4,地址:http://sourceforge.net/projects/jbpm ...
- 编写DLL
想想还是把这个记录下吧,虽然不难,但由于平时写得不多,老是搞忘了. 1.我们来编写一个简单的DLL程序. 首先,我们来看下入口函数DllMain().DllMain()有3个参数: (1)hModul ...
- Opencv Harris角点检测
#include <iostream>#include <opencv2/opencv.hpp> using namespace std;using namespace cv; ...
- 面向对象的JavaScript-002
1. <script type="text/javascript"> // Define the Person constructor var Person = fun ...