多重检验_LSD方法不准确性
python机器学习-乳腺癌细胞挖掘(博主亲自录制视频)
https://study.163.com/course/introduction.htm?courseId=1005269003&utm_campaign=commission&utm_source=cp-400000000398149&utm_medium=share

机器学习,统计项目联系:QQ231469242
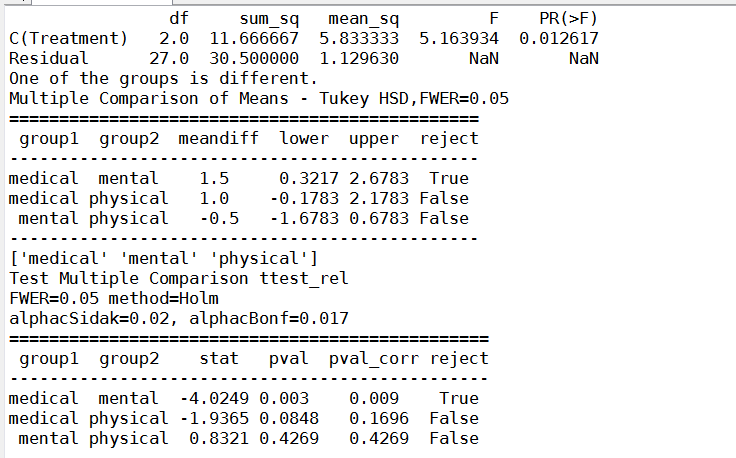
#mental
group1=[2,2,3,4,4,5,3,4,4,4]
#physical
group2=[4,4,3,5,4,1,1,2,3,3]
#medical
group3=[1,2,2,2,3,2,3,1,3,1]
多重检验结果和贾俊平的LSD结果不一样,经过T配对试验,多重检验和T配对试验一致,LSD对小样本可能不准确
# -*- coding: utf-8 -*-

# Import standard packages

import numpy as np

import matplotlib.pyplot as plt

from scipy import stats

import pandas as pd

import os

# additional packages

import sys

sys.path.append(os.path.join('..', '..', 'Utilities'))

try:

# Import formatting commands if directory "Utilities" is available

    from ISP_mystyle import showData

except ImportError:

# Ensure correct performance otherwise

    def showData(*options):

        plt.show()

        return

# Other required packages

from statsmodels.stats.multicomp import (pairwise_tukeyhsd,

                                         MultiComparison)

from statsmodels.formula.api import ols

from statsmodels.stats.anova import anova_lm

from statsmodels.stats.libqsturng import psturng

def setData():

    ''' Set up the data, as a structured array. '''

    # The first and last field are 32-bit intergers; the second field is an

    # 8-byte string. Note that here we can also give names to the individual

    # fields!

    data = np.rec.array([

    (  1,   'mental',  2 ),

    (  2,   'mental',  2 ),

    (  3,   'mental',  3 ),

    (  4,   'mental',  4 ),

    (  5,   'mental',  4 ),

    (  6,   'mental',  5 ),

    (  7,   'mental',  3 ),

    (  8,   'mental',  4 ),

    (  9,   'mental',  4 ),

    ( 10,   'mental',  4 ),

    ( 11, 'physical',  4 ),

    ( 12, 'physical',  4 ),

    ( 13, 'physical',  3 ),

    ( 14, 'physical',  5 ),

    ( 15, 'physical',  4 ),

    ( 16, 'physical',  1 ),

    ( 17, 'physical',  1 ),

    ( 18, 'physical',  2 ),

    ( 19, 'physical',  3 ),

    ( 20, 'physical',  3 ),

    ( 21,  'medical',  1 ),

    ( 22,  'medical',  2 ),

    ( 23,  'medical',  2 ),

    ( 24,  'medical',  2 ),

    ( 25,  'medical',  3 ),

    ( 26,  'medical',  2 ),

    ( 27,  'medical',  3 ),

    ( 28,  'medical',  1 ),

    ( 29,  'medical',  3 ),

    ( 30,  'medical',  1 )], dtype=[('idx', '<i4'),

                                    ('Treatment', '|S8'),

                                    ('StressReduction', '<i4')])

    return data

def doAnova(data):

    '''one-way ANOVA'''

    df = pd.DataFrame(data)

    model = ols('StressReduction ~ C(Treatment)',df).fit()

    anovaResults =  anova_lm(model)

    print(anovaResults)

    if anovaResults['PR(>F)'][0] < 0.05:

        print('One of the groups is different.')

def doTukey(data, multiComp):

    '''Do a pairwise comparison, and show the confidence intervals'''

    print((multiComp.tukeyhsd().summary()))

    # Calculate the p-values:

    res2 = pairwise_tukeyhsd(data['StressReduction'], data['Treatment'])

    df = pd.DataFrame(data)

    numData = len(df)

    numTreatments = len(df.Treatment.unique())

    dof = numData - numTreatments

    # Show the group names

    print((multiComp.groupsunique))

    # Generate a print -------------------

    # Get the data

    xvals = np.arange(3)

    res2 = pairwise_tukeyhsd(data['StressReduction'], data['Treatment'])

    errors = np.ravel(np.diff(res2.confint)/2)

    # Plot them

    plt.plot(xvals, res2.meandiffs, 'o')

    plt.errorbar(xvals, res2.meandiffs, yerr=errors, fmt='o')

    # Put on labels

    pair_labels = multiComp.groupsunique[np.column_stack(res2._multicomp.pairindices)]

    plt.xticks(xvals, pair_labels)

    # Format the plot

    xlim = -0.5, 2.5

    plt.hlines(0, *xlim)

    plt.xlim(*xlim)

    plt.title('Multiple Comparison of Means - Tukey HSD, FWER=0.05' +

              '\n Pairwise Mean Differences')

    # Save to outfile, and show the data

    outFile = 'multComp.png'

    showData(outFile)

def Holm_Bonferroni(multiComp):

    ''' Instead of the Tukey's test, we can do pairwise t-test '''

    # First, with the "Holm" correction

    rtp = multiComp.allpairtest(stats.ttest_rel, method='Holm')

    print((rtp[0]))

    # and then with the Bonferroni correction

    print((multiComp.allpairtest(stats.ttest_rel, method='b')[0]))

    # Any value, for testing the program for correct execution

    checkVal = rtp[1][0][0,0]

    return checkVal

def main():

    # Get the data

    data = setData()

    # Do a one-way ANOVA

    doAnova(data)

    #Then, do the multiple testing

    multiComp = MultiComparison(data['StressReduction'], data['Treatment'])

    doTukey(data, multiComp)    # Tukey's HSD test

    checkVal = Holm_Bonferroni(multiComp)  # Alternatives to Tukey's HSD test

    return checkVal     # this is only for regression testing of the program

if __name__ == '__main__':

    main()
多重检验结果和贾俊平的LSD结果不一样,经过T配对试验,多重检验和T配对试验一致,LSD对小样本可能不准确

# -*- coding: utf-8 -*-

import scipy,math

from scipy.stats import f

import numpy as np

import matplotlib.pyplot as plt

import scipy.stats as stats

# additional packages

from statsmodels.stats.diagnostic import lillifors

#多重比较

from statsmodels.sandbox.stats.multicomp import multipletests

#用于排列组合

import itertools

#独立T检验

from scipy.stats import ttest_ind

#配对T检验

from scipy.stats import ttest_rel

#mental

group1=[2,2,3,4,4,5,3,4,4,4]

#physical

group2=[4,4,3,5,4,1,1,2,3,3]

#medical

group3=[1,2,2,2,3,2,3,1,3,1]

list_groups=[group1,group2,group3]

list_total=group1+group2+group3

a=0.05

#one within group error,also know as random error

def SE(group):

    se=0

    mean1=np.mean(group)

    for i in group:

        error=i-mean1

        se+=error**2

    return se

'''

>>> SE(group1)

22.0

>>> SE(group2)

18.0

>>> SE(group3)

14.0

'''

#sum of squares within group error,also know as random error

def SSE(list_groups):

    sse=0

    for group in list_groups:

        se=SE(group)

        sse+=se

    return sse

#误差总平方和

def SST(list_total):

    sst=0

    mean1=np.mean(list_total)

    for i in list_total:

        error=i-mean1

        sst+=error**2

    return sst

#SSA,between-group sum of squares 组间平方和,公式1:ssa=sst-sse

def SSA(list_groups,list_total):

    sse=SSE(list_groups)

    sst=SST(list_total)

    ssa=sst-sse

    return ssa

#SSA,between-group sum of squares 组间平方和

def SSA1(list_groups,list_total):

    mean_total=np.mean(list_total)

    ssa=0

    for group in list_groups:

        group_mean=np.mean(group)

        distance=(mean_total-group_mean)**2

        ssa+=distance

    ssa=ssa*5

    return ssa

#处理效应均方

def MSA(list_groups,list_total):

    ssa=SSA(list_groups,list_total)

    msa=ssa/(len(list_groups)-1)*1.0

    return msa

# 误差均方

def MSE(list_groups,list_total):

    sse=SSE(list_groups)

    mse=sse/(len(list_total)-1*len(list_groups))*1.0

    return mse

#F score

def F(list_groups,list_total):

    msa=MSA(list_groups,list_total)

    mse=MSE(list_groups,list_total)

    ratio=msa/mse*1.0

    return ratio

'''

>>> F(list_groups,list_total)

22.592592592592595

'''

#LSD检验有问题,需要核对,不如配对T检验准确

#LSD(least significant difference)最小显著差异

def LSD(list_groups,list_total,sample1,sample2):

    mean1=np.mean(sample1)

    mean2=np.mean(sample2)

    distance=abs(mean1-mean2)

    print"distance:",distance

    #t检验的自由度

    df=len(list_total)-1*len(list_groups)

    mse=MSE(list_groups,list_total)

    print"MSE:",mse

    t_value=stats.t(df).isf(a/2)

    print"t value:",t_value

    lsd=t_value*math.sqrt(mse*(1.0/len(sample1)+1.0/len(sample2)))

    print "LSD:",lsd

    if distance<lsd:

        print"no significant difference between:",sample1,sample2

    else:

        print"there is significant difference between:",sample1,sample2

#正态分布测试

def check_normality(testData):

    #20<样本数<50用normal test算法检验正态分布性

    if 20<len(testData) <50:

       p_value= stats.normaltest(testData)[1]

       if p_value<0.05:

           print"use normaltest"

           print "data are not normal distributed"

           return  False

       else:

           print"use normaltest"

           print "data are normal distributed"

           return True

    #样本数小于50用Shapiro-Wilk算法检验正态分布性

    if len(testData) <50:

       p_value= stats.shapiro(testData)[1]

       if p_value<0.05:

           print "use shapiro:"

           print "data are not normal distributed"

           return  False

       else:

           print "use shapiro:"

           print "data are normal distributed"

           return True

    if 300>=len(testData) >=50:

       p_value= lillifors(testData)[1]

       if p_value<0.05:

           print "use lillifors:"

           print "data are not normal distributed"

           return  False

       else:

           print "use lillifors:"

           print "data are normal distributed"

           return True

    if len(testData) >300:

       p_value= stats.kstest(testData,'norm')[1]

       if p_value<0.05:

           print "use kstest:"

           print "data are not normal distributed"

           return  False

       else:

           print "use kstest:"

           print "data are normal distributed"

           return True

#对所有样本组进行正态性检验

def NormalTest(list_groups):

    for group in list_groups:

        #正态性检验

        status=check_normality(group1)

        if status==False :

            return False

#排列组合函数

def Combination(list_groups):

    combination= []

    for i in range(1,len(list_groups)+1):

        iter = itertools.combinations(list_groups,i)

        combination.append(list(iter))

    #需要排除第一个和最后一个

    return combination[1:-1][0]

'''

Out[57]:

[[([2, 3, 7, 2, 6], [10, 8, 7, 5, 10]),

  ([2, 3, 7, 2, 6], [10, 13, 14, 13, 15]),

  ([10, 8, 7, 5, 10], [10, 13, 14, 13, 15])]]

'''

#多重比较

def Multiple_test(list_groups):

    combination=Combination(list_groups)

    for pair in combination:

        LSD(list_groups,list_total,pair[0],pair[1])

#discriptive statistcs

print "discriptive statistcs----------------------------------------------"

print "group1 mean",np.mean(group1)

print "group2 mean",np.mean(group2)

print "group3 mean",np.mean(group3)

#对所有样本组进行正态性检验

print"M=Normality test:-----------------------------------"

NormalTest(list_groups)

#方差齐性检测

print"levene test:-----------------------------------"

leveneResult=scipy.stats.levene(group1,group2,group3)

leveneScore=leveneResult[0]

p_levene=leveneResult[1]

if p_levene<0.05:

   print"levene test is not fit,be attention!"

else:

   print"levene test is ok"

'''

H0成立,三组数据方差无显著差异

Out[9]: LeveneResult(statistic=0.24561403508771934, pvalue=0.7860617221429711)

'''

print "result--------------------------------------------------"

f_score=F(list_groups,list_total)

print"F score:",f_score

#sf 为生存函数survival function

#组数自由度

df1=len(list_groups)-1

#所有样本的自由度

df2=len(list_total)-1*len(list_groups)

probability=f.sf(f_score,df1,df2)

print"p value:",probability

'''

Out[28]: 8.5385924542746692e-05

'''

if probability<0.05:

    print"there is significance,H1 win"

else:

   print"there is no significance,H0 win"

#多重比较

print"multiple test----------------------------------------------"

print"Multiple test",Multiple_test

Multiple_test(list_groups)
贾俊平书里的例子,综合多重检验和LSD方法结果一致
#居民区
group1=[265,310,220,290,350,300,445,480,500,430,428,530]
#商业区
group2=[410,305,450,380,310,390,590,480,510,470,415,390]
#写字楼
group3=[180,290,330,220,170,256,290,283,260,246,275,320]

# -*- coding: utf-8 -*-

# Import standard packages

import numpy as np

import matplotlib.pyplot as plt

from scipy import stats

import pandas as pd

import os

# additional packages

import sys

sys.path.append(os.path.join('..', '..', 'Utilities'))

try:

# Import formatting commands if directory "Utilities" is available

    from ISP_mystyle import showData

except ImportError:

# Ensure correct performance otherwise

    def showData(*options):

        plt.show()

        return

# Other required packages

from statsmodels.stats.multicomp import (pairwise_tukeyhsd,

                                         MultiComparison)

from statsmodels.formula.api import ols

from statsmodels.stats.anova import anova_lm

from statsmodels.stats.libqsturng import psturng

def setData():

    ''' Set up the data, as a structured array. '''

    # The first and last field are 32-bit intergers; the second field is an

    # 8-byte string. Note that here we can also give names to the individual

    # fields!

    data = np.rec.array([

    (  1,   'resident', 265 ),

    (  2,   'resident', 310 ),

    (  3,   'resident', 220 ),

    (  4,   'resident', 290 ),

    (  5,   'resident', 350 ),

    (  6,   'resident', 300 ),

    (  7,   'resident', 445 ),

    (  8,   'resident', 480 ),

    (  9,   'resident', 500 ),

    ( 10,   'resident', 430),

    ( 11,   'resident', 428),

    ( 12,   'resident', 530 ),

    ( 13, 'commercial', 410 ),

    ( 14, 'commercial', 305 ),

    ( 15, 'commercial', 450 ),

    ( 16, 'commercial', 380 ),

    ( 17, 'commercial', 310 ),

    ( 18, 'commercial', 390 ),

    ( 19, 'commercial', 590 ),

    ( 20, 'commercial', 480 ),

    ( 21, 'commercial', 510 ),

    ( 22, 'commercial', 470 ),

    ( 23, 'commercial', 415 ),

    ( 24, 'commercial', 390 ),

    ( 25, 'officeBuilding', 180 ),

    ( 26, 'officeBuilding', 290 ),

    ( 27, 'officeBuilding', 330 ),

    ( 28, 'officeBuilding', 220 ),

    ( 29, 'officeBuilding', 170),

    ( 30, 'officeBuilding', 256),

    ( 31, 'officeBuilding', 290 ),

    ( 32, 'officeBuilding', 283 ),

    ( 33, 'officeBuilding', 260),

    ( 34, 'officeBuilding', 246),

    ( 35, 'officeBuilding', 275),

    ( 36, 'officeBuilding', 320),

     ], dtype=[('idx', '<i4'),

                                    ('Treatment', '|S8'),

                                    ('StressReduction', '<i4')])

    return data

def doAnova(data):

    '''one-way ANOVA'''

    df = pd.DataFrame(data)

    model = ols('StressReduction ~ C(Treatment)',df).fit()

    anovaResults =  anova_lm(model)

    print(anovaResults)

    if anovaResults['PR(>F)'][0] < 0.05:

        print('One of the groups is different.')

def doTukey(data, multiComp):

    '''Do a pairwise comparison, and show the confidence intervals'''

    print((multiComp.tukeyhsd().summary()))

    # Calculate the p-values:

    res2 = pairwise_tukeyhsd(data['StressReduction'], data['Treatment'])

    df = pd.DataFrame(data)

    numData = len(df)

    numTreatments = len(df.Treatment.unique())

    dof = numData - numTreatments

    # Show the group names

    print((multiComp.groupsunique))

    # Generate a print -------------------

    # Get the data

    xvals = np.arange(3)

    res2 = pairwise_tukeyhsd(data['StressReduction'], data['Treatment'])

    errors = np.ravel(np.diff(res2.confint)/2)

    # Plot them

    plt.plot(xvals, res2.meandiffs, 'o')

    plt.errorbar(xvals, res2.meandiffs, yerr=errors, fmt='o')

    # Put on labels

    pair_labels = multiComp.groupsunique[np.column_stack(res2._multicomp.pairindices)]

    plt.xticks(xvals, pair_labels)

    # Format the plot

    xlim = -0.5, 2.5

    plt.hlines(0, *xlim)

    plt.xlim(*xlim)

    plt.title('Multiple Comparison of Means - Tukey HSD, FWER=0.05' +

              '\n Pairwise Mean Differences')

    # Save to outfile, and show the data

    outFile = 'multComp.png'

    showData(outFile)

def Holm_Bonferroni(multiComp):

    ''' Instead of the Tukey's test, we can do pairwise t-test '''

    # First, with the "Holm" correction

    rtp = multiComp.allpairtest(stats.ttest_rel, method='Holm')

    print((rtp[0]))

    # and then with the Bonferroni correction

    print((multiComp.allpairtest(stats.ttest_rel, method='b')[0]))

    # Any value, for testing the program for correct execution

    checkVal = rtp[1][0][0,0]

    return checkVal

def main():

    # Get the data

    data = setData()

    # Do a one-way ANOVA

    doAnova(data)

    #Then, do the multiple testing

    multiComp = MultiComparison(data['StressReduction'], data['Treatment'])

    doTukey(data, multiComp)    # Tukey's HSD test

    checkVal = Holm_Bonferroni(multiComp)  # Alternatives to Tukey's HSD test

    return checkVal     # this is only for regression testing of the program

if __name__ == '__main__':

    main()
贾俊平书里的例子,综合多重检验和LSD方法结果一致
#居民区
group1=[265,310,220,290,350,300,445,480,500,430,428,530]
#商业区
group2=[410,305,450,380,310,390,590,480,510,470,415,390]
#写字楼
group3=[180,290,330,220,170,256,290,283,260,246,275,320]

# -*- coding: utf-8 -*-

import scipy,math

from scipy.stats import f

import numpy as np

import matplotlib.pyplot as plt

import scipy.stats as stats

# additional packages

from statsmodels.stats.diagnostic import lillifors

#多重比较

from statsmodels.sandbox.stats.multicomp import multipletests

#用于排列组合

import itertools

#独立T检验

from scipy.stats import ttest_ind

#配对T检验

from scipy.stats import ttest_rel

#居民区

group1=[265,310,220,290,350,300,445,480,500,430,428,530]

#商业区

group2=[410,305,450,380,310,390,590,480,510,470,415,390]

#写字楼

group3=[180,290,330,220,170,256,290,283,260,246,275,320]

list_groups=[group1,group2,group3]

list_total=group1+group2+group3

a=0.05

#one within group error,also know as random error

def SE(group):

    se=0

    mean1=np.mean(group)

    for i in group:

        error=i-mean1

        se+=error**2

    return se

'''

>>> SE(group1)

22.0

>>> SE(group2)

18.0

>>> SE(group3)

14.0

'''

#sum of squares within group error,also know as random error

def SSE(list_groups):

    sse=0

    for group in list_groups:

        se=SE(group)

        sse+=se

    return sse

#误差总平方和

def SST(list_total):

    sst=0

    mean1=np.mean(list_total)

    for i in list_total:

        error=i-mean1

        sst+=error**2

    return sst

#SSA,between-group sum of squares 组间平方和,公式1:ssa=sst-sse

def SSA(list_groups,list_total):

    sse=SSE(list_groups)

    sst=SST(list_total)

    ssa=sst-sse

    return ssa

#SSA,between-group sum of squares 组间平方和

def SSA1(list_groups,list_total):

    mean_total=np.mean(list_total)

    ssa=0

    for group in list_groups:

        group_mean=np.mean(group)

        distance=(mean_total-group_mean)**2

        ssa+=distance

    ssa=ssa*5

    return ssa

#处理效应均方

def MSA(list_groups,list_total):

    ssa=SSA(list_groups,list_total)

    msa=ssa/(len(list_groups)-1)*1.0

    return msa

# 误差均方

def MSE(list_groups,list_total):

    sse=SSE(list_groups)

    mse=sse/(len(list_total)-1*len(list_groups))*1.0

    return mse

#F score

def F(list_groups,list_total):

    msa=MSA(list_groups,list_total)

    mse=MSE(list_groups,list_total)

    ratio=msa/mse*1.0

    return ratio

'''

>>> F(list_groups,list_total)

22.592592592592595

'''

#LSD检验有问题,需要核对,不如配对T检验准确

#LSD(least significant difference)最小显著差异

def LSD(list_groups,list_total,sample1,sample2):

    mean1=np.mean(sample1)

    mean2=np.mean(sample2)

    distance=abs(mean1-mean2)

    print"distance:",distance

    #t检验的自由度

    df=len(list_total)-1*len(list_groups)

    mse=MSE(list_groups,list_total)

    print"MSE:",mse

    t_value=stats.t(df).isf(a/2)

    print"t value:",t_value

    lsd=t_value*math.sqrt(mse*(1.0/len(sample1)+1.0/len(sample2)))

    print "LSD:",lsd

    if distance<lsd:

        print"no significant difference between:",sample1,sample2

    else:

        print"there is significant difference between:",sample1,sample2

#正态分布测试

def check_normality(testData):

    #20<样本数<50用normal test算法检验正态分布性

    if 20<len(testData) <50:

       p_value= stats.normaltest(testData)[1]

       if p_value<0.05:

           print"use normaltest"

           print "data are not normal distributed"

           return  False

       else:

           print"use normaltest"

           print "data are normal distributed"

           return True

    #样本数小于50用Shapiro-Wilk算法检验正态分布性

    if len(testData) <50:

       p_value= stats.shapiro(testData)[1]

       if p_value<0.05:

           print "use shapiro:"

           print "data are not normal distributed"

           return  False

       else:

           print "use shapiro:"

           print "data are normal distributed"

           return True

    if 300>=len(testData) >=50:

       p_value= lillifors(testData)[1]

       if p_value<0.05:

           print "use lillifors:"

           print "data are not normal distributed"

           return  False

       else:

           print "use lillifors:"

           print "data are normal distributed"

           return True

    if len(testData) >300:

       p_value= stats.kstest(testData,'norm')[1]

       if p_value<0.05:

           print "use kstest:"

           print "data are not normal distributed"

           return  False

       else:

           print "use kstest:"

           print "data are normal distributed"

           return True

#对所有样本组进行正态性检验

def NormalTest(list_groups):

    for group in list_groups:

        #正态性检验

        status=check_normality(group1)

        if status==False :

            return False

#排列组合函数

def Combination(list_groups):

    combination= []

    for i in range(1,len(list_groups)+1):

        iter = itertools.combinations(list_groups,i)

        combination.append(list(iter))

    #需要排除第一个和最后一个

    return combination[1:-1][0]

'''

Out[57]:

[[([2, 3, 7, 2, 6], [10, 8, 7, 5, 10]),

  ([2, 3, 7, 2, 6], [10, 13, 14, 13, 15]),

  ([10, 8, 7, 5, 10], [10, 13, 14, 13, 15])]]

'''

#多重比较

def Multiple_test(list_groups):

    combination=Combination(list_groups)

    for pair in combination:

        LSD(list_groups,list_total,pair[0],pair[1])

#discriptive statistcs

print "discriptive statistcs----------------------------------------------"

print "group1 mean",np.mean(group1)

print "group2 mean",np.mean(group2)

print "group3 mean",np.mean(group3)

#对所有样本组进行正态性检验

print"M=Normality test:-----------------------------------"

NormalTest(list_groups)

#方差齐性检测

print"levene test:-----------------------------------"

leveneResult=scipy.stats.levene(group1,group2,group3)

leveneScore=leveneResult[0]

p_levene=leveneResult[1]

if p_levene<0.05:

   print"levene test is not fit,be attention!"

else:

   print"levene test is ok"

'''

H0成立,三组数据方差无显著差异

Out[9]: LeveneResult(statistic=0.24561403508771934, pvalue=0.7860617221429711)

'''

print "result--------------------------------------------------"

f_score=F(list_groups,list_total)

print"F score:",f_score

#sf 为生存函数survival function

#组数自由度

df1=len(list_groups)-1

#所有样本的自由度

df2=len(list_total)-1*len(list_groups)

probability=f.sf(f_score,df1,df2)

print"p value:",probability

'''

Out[28]: 8.5385924542746692e-05

'''

if probability<0.05:

    print"there is significance,H1 win"

else:

   print"there is no significance,H0 win"

#多重比较

print"multiple test----------------------------------------------"

print"Multiple test",Multiple_test

Multiple_test(list_groups)
python风控评分卡建模和风控常识(博客主亲自录制视频教程)

多重检验_LSD方法不准确性的更多相关文章
- 除了GPS外的4种获得用户地理位置数据的方法
纯粹的GPS解决方案以及它所生成的经纬度标签是地理位置数据的公认标准.但是至少还有4种方法可以获得地理位置数据: 1.手机信号塔数据:当移动设备的GPS芯片不能接收到GPS信号时,移动设备就需要与它所 ...
- T检验与F检验的区别_f检验和t检验的关系
1,T检验和F检验的由来 一般而言,为了确定从样本(sample)统计结果推论至总体时所犯错的概率,我们会利用统计学家所开发的一些统计方法,进行统计检定. 通过把所得到的统计检定值,与统计学家建立了一 ...
- 手势估计- Hand Pose Estimation
http://blog.csdn.net/myarrow/article/details/51933651 1. 目前进展 1.1 相关资料 1)HANDS CVPR 2016 2 ...
- 通俗理解T检验和F检验
来源: http://blog.sina.com.cn/s/blog_4ee13c2c01016div.html 1,T检验和F检验的由来 一般而言,为了确定从样本(sample)统计结果推论至总 ...
- ML—随机森林·1
Introduction to Random forest(Simplified) With increase in computational power, we can now choose al ...
- 通俗理解T检验与F检验的区别【转】
转自:http://blog.sina.com.cn/s/blog_4ee13c2c01016div.html1,T检验和F检验的由来一般而言,为了确定从样本(sample)统计结果推论至总体时所犯错 ...
- 比较任意两个JSON串是否相等(比较对象是否相等)JAVA版
废话少说,直接入题. 在面向对象语言中,经常会比较两个对象是否相等,而比较的大多是实体类实例,也就是封装数据的那些类实例,或者是Map.List互相嵌套成的复杂数据结构. 比较对象是否相等,常见的思路 ...
- Web指纹识别目的Discuz识别+粗糙的版本演绎
这个识别程序是本学期在我的职业培训项目.它是做一类似至Zoomeye怪东西,然后使用ES集成,为了让搜索引擎寻找.因此,我们必须首先去网上识别相应的能力Web包裹,如果用户输入的关键词:Discuz ...
- 统计学常用概念:T检验、F检验、卡方检验、P值、自由度
1,T检验和F检验的由来 一般而言,为了确定从样本(sample)统计结果推论至总体时所犯错的概率,我们会利用统计学家所开发的一些统计方法,进行统计检定. 通过把所得到的统计检定值,与统计学家建立了一 ...
随机推荐
- php 中关于pdo的使用
之前一段时间,开始了php的研究,看了关于PDO的一些资料,发现不错,整理和总结一下,作为开发笔记,留待日后使用,<PHP开发笔记系列(一)-PDO使用>. PDO是PHP Data Ob ...
- 2014-2015 ACM-ICPC, NEERC, Eastern Subregional Contest Problem G. The Debut Album
题目来源:http://codeforces.com/group/aUVPeyEnI2/contest/229669 时间限制:1s 空间限制:64MB 题目大意:给定n,a,b的值 求一个长度为n的 ...
- UIView maskView属性
给View1的maskView 赋值View2 1.View2不会显示在View1上: 2.View2 的alpha通道会体现在View1上. 关于maskView,Apple的解释: An opti ...
- 缓存-MemoryCache Class
这是使用MemoryCache缓存的一个例子. private void btnGet_Click(object sender, EventArgs e) { ObjectCache cache = ...
- J2EE面试常见试题
一.基础问答 1.下面哪些类可以被继承? java.lang.Thread (T) java.lang.Number (T) java.lang.Double (F) java.lang.Math ...
- eclipse中jsp页面Invalid location of tag 解决办法分析小结
在jsp页面使用标签过程中有时候不注意规则的话,eclipse会提示一些错误,下面针对这些错误提出相应的解决办法: <form></form>标签 1. Invalid loc ...
- python接口自动化测试框架实现之字符串插入变量(字符串参数化)
问题: 在做接口自动化测试的时候,请求报文是json串,但是根据项目规则必须转换成字符串,然后在开头拼接“data=” 接口中很多入参值需要进行参数化. 解决方案: 1.Python并没有对在字符串中 ...
- 【php】session读写锁
事件:a文件中操作$_SESSION['start'] = 'yes'; sleep(100); 休眠100s 在这休眠的时间段中,b文件操作$_SESSION['start'] = 'no'; 结 ...
- Java 线程池详解
Executors创建线程池 Java中创建线程池很简单,只需要调用Executors中相应的便捷方法即可,比如Executors.newFixedThreadPool(int nThreads),但 ...
- Spring AOP基础
目录 AOP基本术语 Advice-通知 Before After After-returning After-throwing Around Pointcut-切点 Aspect-切面 Join P ...