Grafana安装配置介绍
一、Grafana介绍
Grafana是一个可视化面板(Dashboard),有着非常漂亮的图表和布局展示,功能齐全的度量仪表盘和图形编辑器,支持Graphite、zabbix、InfluxDB、Prometheus和OpenTSDB作为数据源。Grafana主要特性:灵活丰富的图形化选项;可以混合多种风格;支持白天和夜间模式;多个数据源。
二、安装Grafana
CentOS系列使用YUM安装
|
1
2
|
$ wget https://s3-us-west-2.amazonaws.com/grafana-releases/release/grafana-4.2.0-1.x86_64.rpm
$ sudo yum localinstall grafana-4.2.0-1.x86_64.rpm
|
或者
|
1
2
|
$ yum install initscripts fontconfig
$ rpm -Uvh grafana-3.1.1-1470047149.x86_64.rpm
|
安装文件
|
1
2
3
4
5
6
7
8
9
10
11
12
13
14
15
16
17
18
19
20
|
# 二进制程序文件
/usr/sbin/grafana-server
# init.d脚本
/etc/init.d/grafana-server
# 安装默认环境变量文件
/etc/sysconfig/grafana-server
# 配置文件
/etc/grafana/grafana.ini
# systemd服务名称
grafana-server.service
# 日志文件
/var/log/grafana/grafana.log
# 默认sqlite3数据库
/var/lib/grafana/grafana.db
|
Sysv方式启动Grafana
|
1
2
|
$ service grafana-server start
$ chkconfig --add grafana-server
|
Systemd方式启动Grafana
|
1
2
3
|
$ systemctl daemon-reload
$ systemctl start grafana-server
$ systemctl status grafana-server
|
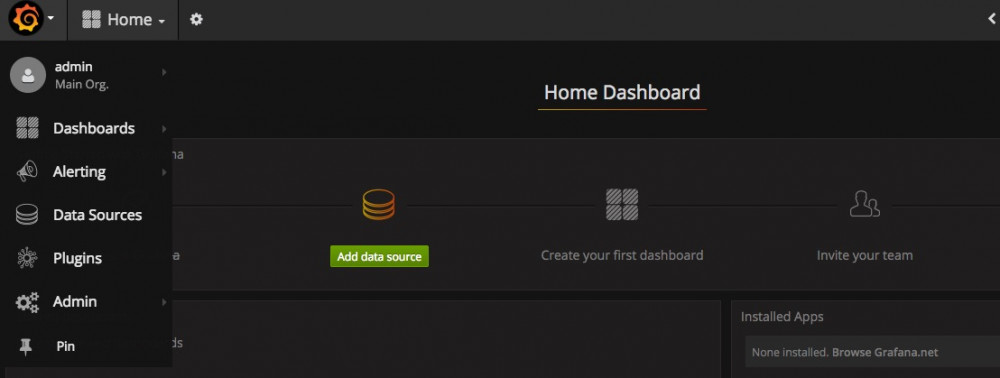
启动Granfa之后,进程名称为grafana-server。将会默认使用grafana用户和组运行Granfa进程。默认会开启HTTP的3000端口。启动服务之后直接直接在浏览器访问http://IP:3000就会出现如下界面,默认账号和用户名为admin/admin,在/etc/grafana/grafana.ini配置文件中可修改。
在/usr/share/grafana/public/app/plugins/datasource/目录下存放着Grafana默认支持的数据源,有如下数据源。
|
1
2
3
4
5
6
7
8
9
10
|
[root@localhost ~]# ll /usr/share/grafana/public/app/plugins/datasource/
drwxr-xr-x. 5 root root 4096 Aug 26 15:16 cloudwatch
drwxr-xr-x. 5 root root 4096 Aug 26 15:16 elasticsearch
drwxr-xr-x. 3 root root 4096 Aug 26 15:16 grafana
drwxr-xr-x. 3 root root 4096 Aug 26 15:16 grafana-live
drwxr-xr-x. 6 root root 4096 Aug 26 15:16 graphite
drwxr-xr-x. 5 root root 4096 Aug 26 15:16 influxdb
drwxr-xr-x. 2 root root 4096 Aug 26 15:16 mixed
drwxr-xr-x. 5 root root 4096 Aug 26 15:16 opentsdb
drwxr-xr-x. 6 root root 4096 Aug 26 15:16 prometheus
|
当Grafana安装完成后,就可以着手为Grafana添加数据源了,比如以Graphite和zabbix为数据源,或者以Elasticsearch为数据源都可以。具体如何添加数据源Grafana官网有详细说明
http://docs.grafana.org/datasources/overview/
后面我也会给出几个数据源具体添加过程作为参考。
三、Grafana插件安装
Grafana官网提供了很多类型的插件,能够帮助我们完成一些其他的任务,使用grafana-cli工具安装即可。如下:
安装Panel类型,以Clock为例
|
1
|
$grafana-cli plugins install grafana-clock-panel
|
安装apps类型,以Worldping为例
|
1
|
$ grafana-cli plugins install raintank-worldping-app
|
安装Data source类型,以SimpleJson为例
|
1
|
$ grafana-cli plugins install grafana-simple-json-datasource
|
安装完成,提示重启grafana服务
|
1
|
$ /etc/init.d/grafana-server restart
|
插件使用及仪表板模板导入,Worldping使用展示。
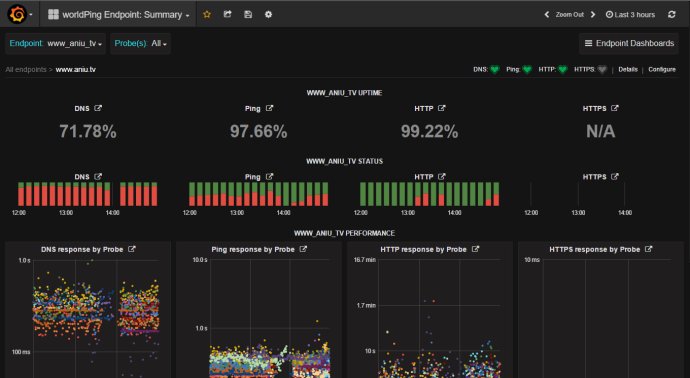
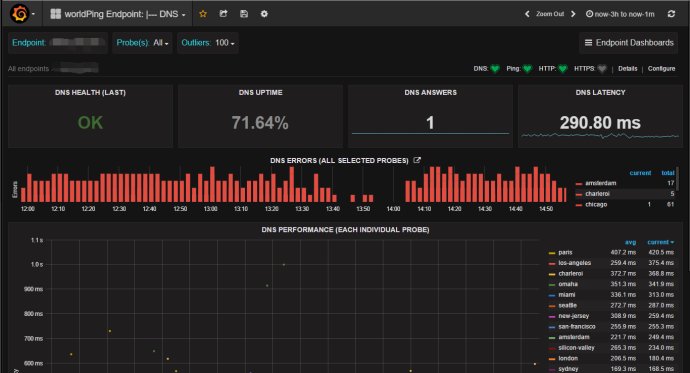
更多插件的使用自己摸索。
列出插件
|
1
|
$ grafana-cli plugins ls
|
更新插件
|
1
|
$ grafana-cli plugins update <plugin-id>
|
移除插件
|
1
|
$ grafana-cli plugins remove <plugin-id>
|
完结。。。
摘自 http://www.ywnds.com/?p=5903
关于grafana 的文章还有 https://yq.aliyun.com/articles/227006 《5分钟搭建网站实时分析:Grafana+日志服务实战》
Grafana安装配置介绍的更多相关文章
- grafana 安装配置
Grafana安装配置 1.下载安装包 wget https://s3-us-west-2.amazonaws.com/grafana-releases/release/grafana-5.1.3.l ...
- Prometheus(一):Prometheus+Grafana 安装配置
一.基础环境 系统 IP 监控主机 CentOS 7 192.168.56.200 被监控主机 CentOS 7 192.168.56.201 二.Prometheus服务端安装 以下操作皆在监控主机 ...
- Jmeter+ InfluxDB+Grafana安装配置
前置条件: 系统:windows jmeter:5.1 InfluxDB安装 下载InfluxDB-v1.7.9和Chronograf-v1.7.14(InfluxDB的可视化web端). 下载完成之 ...
- Grafana是一个可视化面板-安装配置介绍
Grafana是一个可视化面板(Dashboard),有着非常漂亮的图表和布局展示,功能齐全的度量仪表盘和图形编辑器,支持Graphite.zabbix.InfluxDB.Prometheus和Ope ...
- Node.js 安装配置介绍
Node.js 安装配置 本章节我们将向大家介绍在window和Linux上安装Node.js的方法. 本安装教程以Node.js v6.10.1 LTS(长期支持版本)版本为例. Node.js安装 ...
- influxDB+grafana安装配置及邮件告警发送配置
1. InfluxDB安装 下载包并解压: $:wgethttps://dl.influxdata.com/influxdb/releases/influxdb-1.3.6_linux_amd64.t ...
- NodeJS学习(1)--- 安装配置介绍
Node.js 安装配置 本章节我们将向大家介绍在window和Linux上安装Node.js的方法. 本安装教程以Node.js v6.10.1 LTS(长期支持版本)版本为例. Node.js安装 ...
- Nginx安装配置介绍(二)
一:Nginx安装(Windows) 官网地址:https://nginx.org/en/download.html 解压完成后,文件目录如下: 启动Nginx: 直接双击目录下的nginx.exe, ...
- 转:Redis 的安装配置介绍
redis 是一个高性能的key-value数据库. redis的出现,很大程度补偿了memcached这类keyvalue存储的不足,在部 分场合可以对关系数据库起到很好的补充作用.它提供了Pyth ...
随机推荐
- R语言通过loess去除某个变量对数据的影响--CNV分析
当我们想研究不同sample的某个变量A之间的差异时,往往会因为其它一些变量B对该变量的固有影响,而影响不同sample变量A的比较,这个时候需要对sample变量A进行标准化之后才能进行比较.标准化 ...
- 【BZOJ】4011: [HNOI2015]落忆枫音
题目链接:http://blog.csdn.net/popoqqq/article/details/45194103 写代码的时候也没有很清晰....具体看这里吧 #include<iostre ...
- onpause 与 onresume
- Thymeleaf的基本语法总结
最近用Spring boot开发一些测试平台和工具,用到页面展示的部分, 选择的是thymeleaf模版引擎. 页面开发的7788快结束了,下面来总结下此过程中对thymeleaf的使用总结. 什么是 ...
- Jmeter 二次开发 将CSV Data Set Config添加从哪一行开始读数据
经常遇到性能测试的时候,有100万条数据,才用了5万条,中途因为某些原因停止了,继续用的时候, 要么要清除DB中数据,要么要清除数据源中的数据, 觉得特别麻烦, 希望改写下代码,将 Ignore fi ...
- zzulioj 1734 堆
比赛的时候不会写,想不到DFS,一直以为需要二叉树或者建堆什么的,也没学,后来才明白这个题 代码: #include <cstdio> #include <cstring> # ...
- PostgreSQL安装及使用教程一(exe安装方式)
下载安装 百度搜索PostgreSQL,进入官网,选择相应版本的图形化安装程序(BigSQL)安装即可 连接数据库 对数据库操作有两种方式,一种是通过命令行工具psql,另一种是通过图形化界面pgAd ...
- tensorflow学习笔记一------下载安装,配置环境(基于ubuntu16.04 pycharm)
一,安装TensorFlow 安装所有必备工具 sudo apt-get install python-pip python-dev python-virtualenv 安装TensorFlow su ...
- PHP加密函数
单向散列加密 单向散列加密是指通过对不同输入长度的信息进行散列计算,得到固定长度的输出.这个散列计算是单向的,即不能对固定长度的输出进行计算从而获取输入信息. 特征:雪崩效应.定长输出和不可逆 作用: ...
- 初探nginx负载均衡配置
只简单说一下upstream的配置,如何进行负载均衡后续还需要多了解 1.另准备一个配置文件命名为nginx_test.conf 为了不污染原有的nginx.conf,提前复制一份配置文件做试验,然后 ...