Grafana安装配置介绍
一、Grafana介绍
Grafana是一个可视化面板(Dashboard),有着非常漂亮的图表和布局展示,功能齐全的度量仪表盘和图形编辑器,支持Graphite、zabbix、InfluxDB、Prometheus和OpenTSDB作为数据源。Grafana主要特性:灵活丰富的图形化选项;可以混合多种风格;支持白天和夜间模式;多个数据源。
二、安装Grafana
CentOS系列使用YUM安装
|
1
2
|
$ wget https://s3-us-west-2.amazonaws.com/grafana-releases/release/grafana-4.2.0-1.x86_64.rpm
$ sudo yum localinstall grafana-4.2.0-1.x86_64.rpm
|
或者
|
1
2
|
$ yum install initscripts fontconfig
$ rpm -Uvh grafana-3.1.1-1470047149.x86_64.rpm
|
安装文件
|
1
2
3
4
5
6
7
8
9
10
11
12
13
14
15
16
17
18
19
20
|
# 二进制程序文件
/usr/sbin/grafana-server
# init.d脚本
/etc/init.d/grafana-server
# 安装默认环境变量文件
/etc/sysconfig/grafana-server
# 配置文件
/etc/grafana/grafana.ini
# systemd服务名称
grafana-server.service
# 日志文件
/var/log/grafana/grafana.log
# 默认sqlite3数据库
/var/lib/grafana/grafana.db
|
Sysv方式启动Grafana
|
1
2
|
$ service grafana-server start
$ chkconfig --add grafana-server
|
Systemd方式启动Grafana
|
1
2
3
|
$ systemctl daemon-reload
$ systemctl start grafana-server
$ systemctl status grafana-server
|
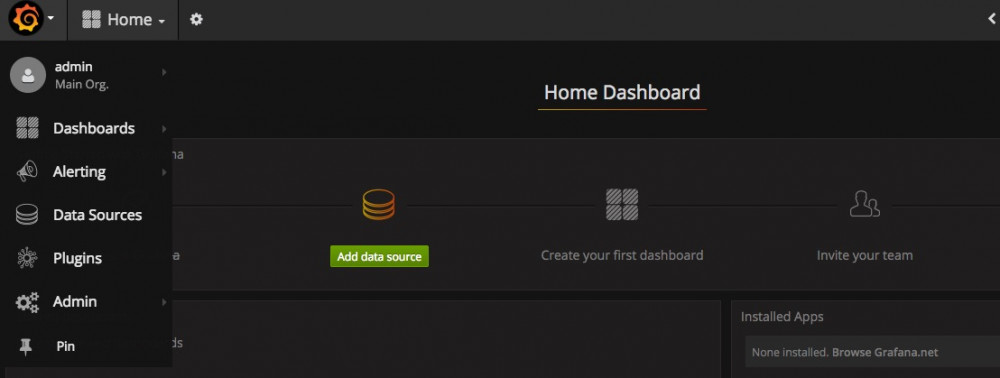
启动Granfa之后,进程名称为grafana-server。将会默认使用grafana用户和组运行Granfa进程。默认会开启HTTP的3000端口。启动服务之后直接直接在浏览器访问http://IP:3000就会出现如下界面,默认账号和用户名为admin/admin,在/etc/grafana/grafana.ini配置文件中可修改。
在/usr/share/grafana/public/app/plugins/datasource/目录下存放着Grafana默认支持的数据源,有如下数据源。
|
1
2
3
4
5
6
7
8
9
10
|
[root@localhost ~]# ll /usr/share/grafana/public/app/plugins/datasource/
drwxr-xr-x. 5 root root 4096 Aug 26 15:16 cloudwatch
drwxr-xr-x. 5 root root 4096 Aug 26 15:16 elasticsearch
drwxr-xr-x. 3 root root 4096 Aug 26 15:16 grafana
drwxr-xr-x. 3 root root 4096 Aug 26 15:16 grafana-live
drwxr-xr-x. 6 root root 4096 Aug 26 15:16 graphite
drwxr-xr-x. 5 root root 4096 Aug 26 15:16 influxdb
drwxr-xr-x. 2 root root 4096 Aug 26 15:16 mixed
drwxr-xr-x. 5 root root 4096 Aug 26 15:16 opentsdb
drwxr-xr-x. 6 root root 4096 Aug 26 15:16 prometheus
|
当Grafana安装完成后,就可以着手为Grafana添加数据源了,比如以Graphite和zabbix为数据源,或者以Elasticsearch为数据源都可以。具体如何添加数据源Grafana官网有详细说明
http://docs.grafana.org/datasources/overview/
后面我也会给出几个数据源具体添加过程作为参考。
三、Grafana插件安装
Grafana官网提供了很多类型的插件,能够帮助我们完成一些其他的任务,使用grafana-cli工具安装即可。如下:
安装Panel类型,以Clock为例
|
1
|
$grafana-cli plugins install grafana-clock-panel
|
安装apps类型,以Worldping为例
|
1
|
$ grafana-cli plugins install raintank-worldping-app
|
安装Data source类型,以SimpleJson为例
|
1
|
$ grafana-cli plugins install grafana-simple-json-datasource
|
安装完成,提示重启grafana服务
|
1
|
$ /etc/init.d/grafana-server restart
|
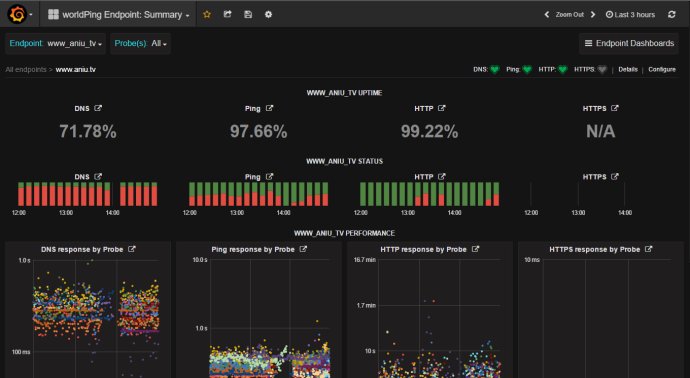
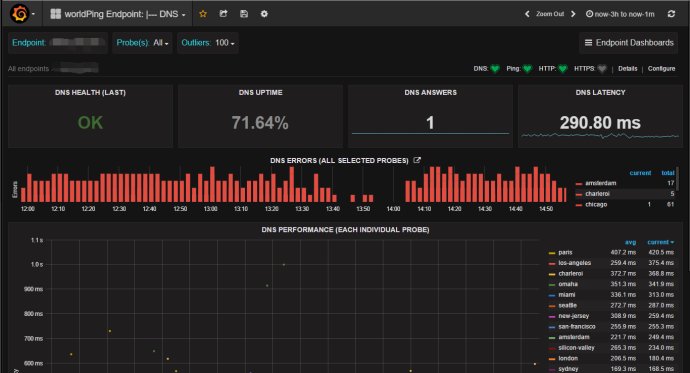
插件使用及仪表板模板导入,Worldping使用展示。
更多插件的使用自己摸索。
列出插件
|
1
|
$ grafana-cli plugins ls
|
更新插件
|
1
|
$ grafana-cli plugins update <plugin-id>
|
移除插件
|
1
|
$ grafana-cli plugins remove <plugin-id>
|
完结。。。
摘自 http://www.ywnds.com/?p=5903
关于grafana 的文章还有 https://yq.aliyun.com/articles/227006 《5分钟搭建网站实时分析:Grafana+日志服务实战》
Grafana安装配置介绍的更多相关文章
- grafana 安装配置
Grafana安装配置 1.下载安装包 wget https://s3-us-west-2.amazonaws.com/grafana-releases/release/grafana-5.1.3.l ...
- Prometheus(一):Prometheus+Grafana 安装配置
一.基础环境 系统 IP 监控主机 CentOS 7 192.168.56.200 被监控主机 CentOS 7 192.168.56.201 二.Prometheus服务端安装 以下操作皆在监控主机 ...
- Jmeter+ InfluxDB+Grafana安装配置
前置条件: 系统:windows jmeter:5.1 InfluxDB安装 下载InfluxDB-v1.7.9和Chronograf-v1.7.14(InfluxDB的可视化web端). 下载完成之 ...
- Grafana是一个可视化面板-安装配置介绍
Grafana是一个可视化面板(Dashboard),有着非常漂亮的图表和布局展示,功能齐全的度量仪表盘和图形编辑器,支持Graphite.zabbix.InfluxDB.Prometheus和Ope ...
- Node.js 安装配置介绍
Node.js 安装配置 本章节我们将向大家介绍在window和Linux上安装Node.js的方法. 本安装教程以Node.js v6.10.1 LTS(长期支持版本)版本为例. Node.js安装 ...
- influxDB+grafana安装配置及邮件告警发送配置
1. InfluxDB安装 下载包并解压: $:wgethttps://dl.influxdata.com/influxdb/releases/influxdb-1.3.6_linux_amd64.t ...
- NodeJS学习(1)--- 安装配置介绍
Node.js 安装配置 本章节我们将向大家介绍在window和Linux上安装Node.js的方法. 本安装教程以Node.js v6.10.1 LTS(长期支持版本)版本为例. Node.js安装 ...
- Nginx安装配置介绍(二)
一:Nginx安装(Windows) 官网地址:https://nginx.org/en/download.html 解压完成后,文件目录如下: 启动Nginx: 直接双击目录下的nginx.exe, ...
- 转:Redis 的安装配置介绍
redis 是一个高性能的key-value数据库. redis的出现,很大程度补偿了memcached这类keyvalue存储的不足,在部 分场合可以对关系数据库起到很好的补充作用.它提供了Pyth ...
随机推荐
- HDU 5754 Life Winner Bo(各类博弈大杂合)
http://acm.hdu.edu.cn/showproblem.php?pid=5754 题意: 给一个国际象棋的棋盘,起点为(1,1),终点为(n,m),现在每个棋子只能往右下方走,并且有4种不 ...
- Java 数据库篇
一.简易封装JDBC工具类: package com.jackie.MyBatis.main; import java.sql.Connection; import java.sql.DriverMa ...
- vue中click阻止事件冒泡,防止触发另一个事件
在使用el-upload组件时,在其中放置了一个删除按钮的图片. 当点击图片,本想只删除上传的视频,但是意外触发了el-upload中的事件 解决办法:用stop,结果只删除当前预览,不触发上传事件. ...
- 查看iis对应w3wp.exe显示的进程ID号
1.任务管理器,查看,选择列,选择PID(进程标识符) 2.通过cmd查询: 管理员身份运行cmd,跳转到C:\Windows\System32\inetsrv目录,然后运行appcmd list w ...
- DataTableHelper
public class DataTableHelper { /// <summary> /// 给DataTable增加一个自增列 /// 如果DataTable 存在 identity ...
- JS中什么是发布--订阅模式?
转载文章部分内容: 发布订阅模式介绍 发布---订阅模式又叫观察者模式,它定义了对象间的一种一对多的关系,让多个观察者对象同时监听某一个主题对象,当一个对象发生改变时,所有依赖于它的对象都将得到通知. ...
- Youtube-dl 配置 使用方法 + 配合aria2 多线程 下载 + 配合 ffmpeg 自动合并分段视频
首先介绍软件,Youtube-dl可以下载网页的视频,功能很强大. 但遇到分段视频不能合并,遇到视频音频分开播放的网站也没办法合并视频音频,所以 需要用ffmpeg来配合的合并视频.合并过程是无损的, ...
- _event_worldstate_team
EventId 事件ID ID WorldStateUI.dbc第10列数字部分 TeamId 事件玩家分组,攻守(防守为1,进攻为2),自定义阵营(_faction表自定义阵营ID),公会(公会gu ...
- java类加载器和双亲委派模型
一. 类加载器 ClassLoader即常说的类加载器,其功能是用于从Class文件加载所需的类,主要场景用于热部署.代码热替换等场景. 系统提供3种的类加载器:Bootstrap ClassLoad ...
- mint fcitx搜狗输入法不显示输入框,其他输入法丢失皮肤
mint18.3 因为这个原因刚刚重装过,结果一不留神又这样了. 这次原因相对清晰: 双屏显示下,合屏睡眠,打开之后,发现卡死了.屏幕分辨率改变了似的. 然后再重启,发现输入法悬浮框变大了,然后输入法 ...