regression | p-value | Simple (bivariate) linear model | 线性回归 | 多重检验 | FDR | BH | R代码
P122, 这是IQR method课的第一次作业,需要统计检验,x和y是否显著的有线性关系。
Assignment 1

1) Find a small bivariate dataset (preferably from your

own discipline) and produce a scatterplot (this is easy

using any spreadsheet)

2) Use any statistics tool (a calculator, spreadsheet or

statistical package) to calculate the best fitting

regression line and test whether the population slope

(=B) is zero.

Notes:

1. Testing whether the population slope (=B) is zero is

different to whether the estimated slope (=b) is zero.

2. Instructions for loading and using the Analysis

Toolpak in Excel: <https://support.office.com/en-us/article/load-theanalysis-

toolpak-in-excel-6a63e598-cd6d-42e3-9317-6b40ba1a66b4>
入门:散点图、线性拟合、拟合参数slope
进阶:统计检验,多重矫正FDR
基本概念:
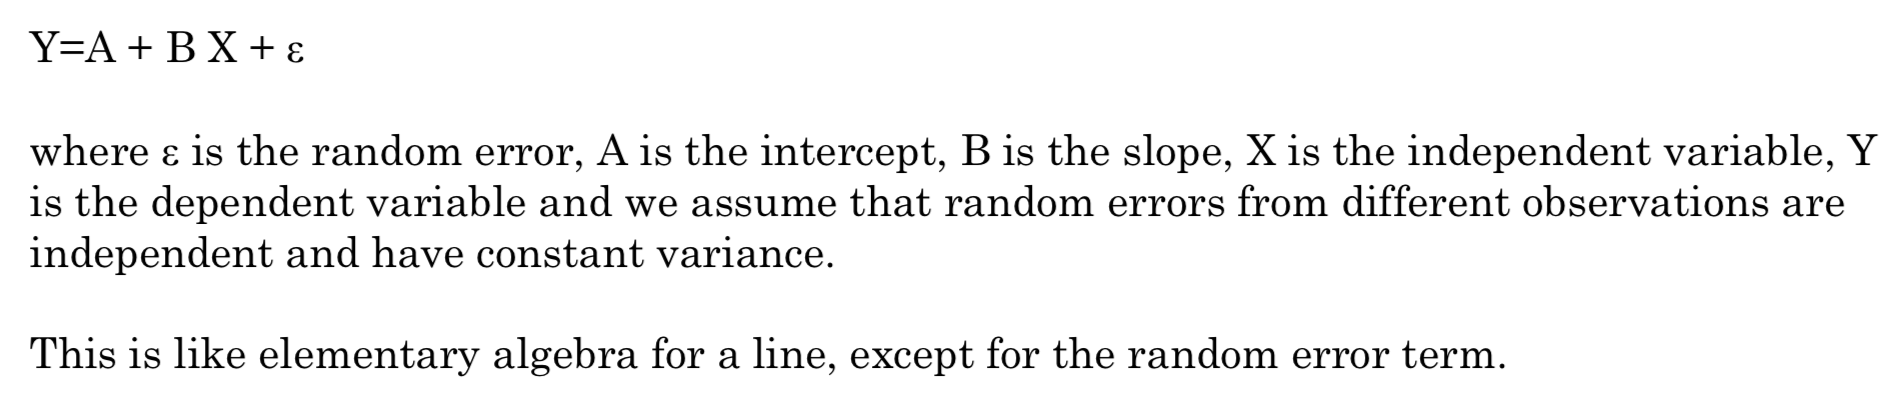
这和基本的代数一样,只是统计更加严谨,把误差纳入到模型中了。
怎么估计A和B呢?
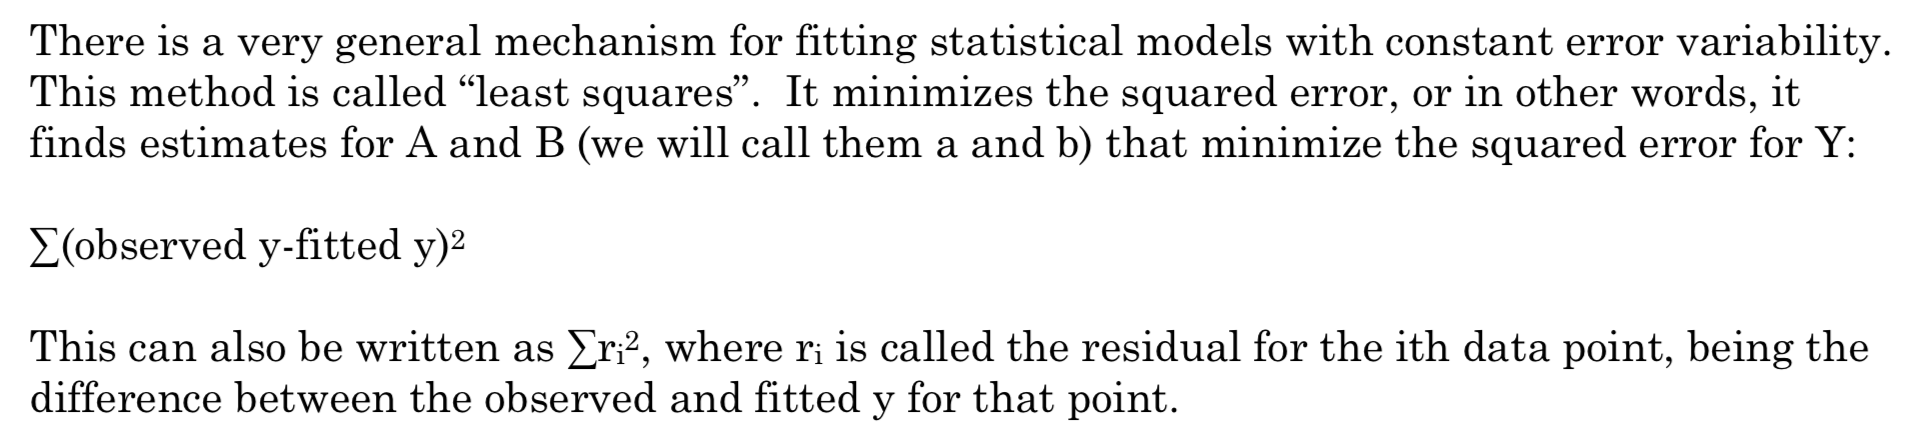
A和B可以看做是群体的参数,a和b可以看做是样本的估计参数,我们的方法是通过使残差最小来估计出a和b。
如果我们假设误差项服从正态分布,那么我们就可以对slope斜率进行统计推断。
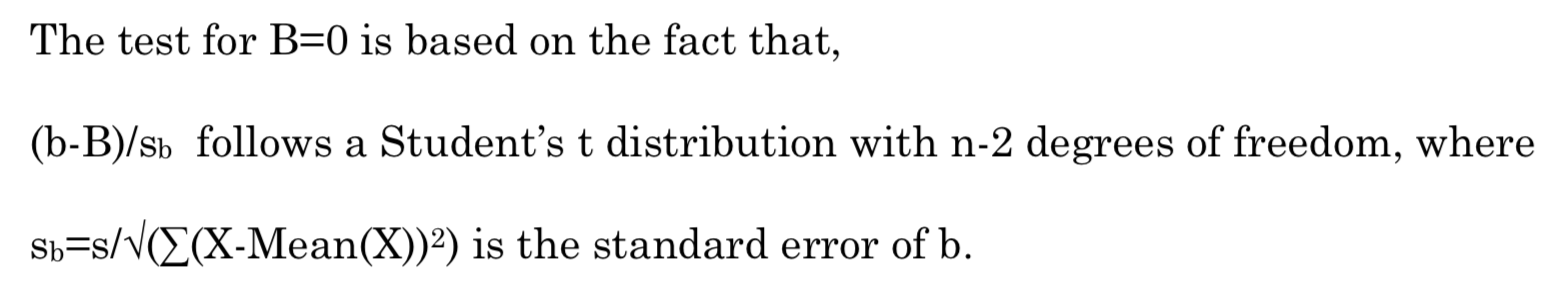
我们可以构造出一个关于b的统计量,它会服从t分布。
这部分还是看耶鲁大学的教程吧:Inference in Linear Regression
如果只是应用的话,知道怎么用R求显著性就行了。
入门R代码
height <- c(176, 154, 138, 196, 132, 176, 181, 169, 150, 175)

bodymass <- c(82, 49, 53, 112, 47, 69, 77, 71, 62, 78)

plot(bodymass, height)

plot(bodymass, height, pch = 16, cex = 1.3, col = "blue", main = "HEIGHT PLOTTED AGAINST BODY MASS", xlab = "BODY MASS (kg)", ylab = "HEIGHT (cm)")

进阶
eruption.lm = lm(eruptions ~ waiting, data=faithful)

summary(eruption.lm)

help(summary.lm)
Call:

lm(formula = eruptions ~ waiting, data = faithful)

Residuals:

    Min      1Q  Median      3Q     Max

-1.2992 -0.3769  0.0351  0.3491  1.1933

Coefficients:

            Estimate Std. Error t value Pr(>|t|)

(Intercept) -1.87402    0.16014   -11.7   <2e-16 ***

waiting      0.07563    0.00222    34.1   <2e-16 ***

---

Signif. codes:  0 ’***’ 0.001 ’**’ 0.01 ’*’ 0.05 ’.’ 0.1 ’ ’ 1

Residual standard error: 0.497 on 270 degrees of freedom

Multiple R-squared: 0.811,      Adjusted R-squared: 0.811

F-statistic: 1.16e+03 on 1 and 270 DF,  p-value: <2e-16
Decide whether there is a significant relationship between the variables in the linear regression model of the data set faithful at .05 significance level.
NULL hypothesis: no relationship between x and y, so the slope is zero.
假设误差服从正态分布,基于零假设,我们要检验以下统计量是否显著。
统计量:(b-B)/sb follows a Student’s t distribution with n-2 degrees of freedom, where sb=s/√(∑(X-Mean(X))2) is the standard error of b.
进阶:多项回归,多重检验
多次回归以后专门开一贴,以下讲多重检验multiple testing。
Lecture 10: Multiple Testing - PPT通俗易懂
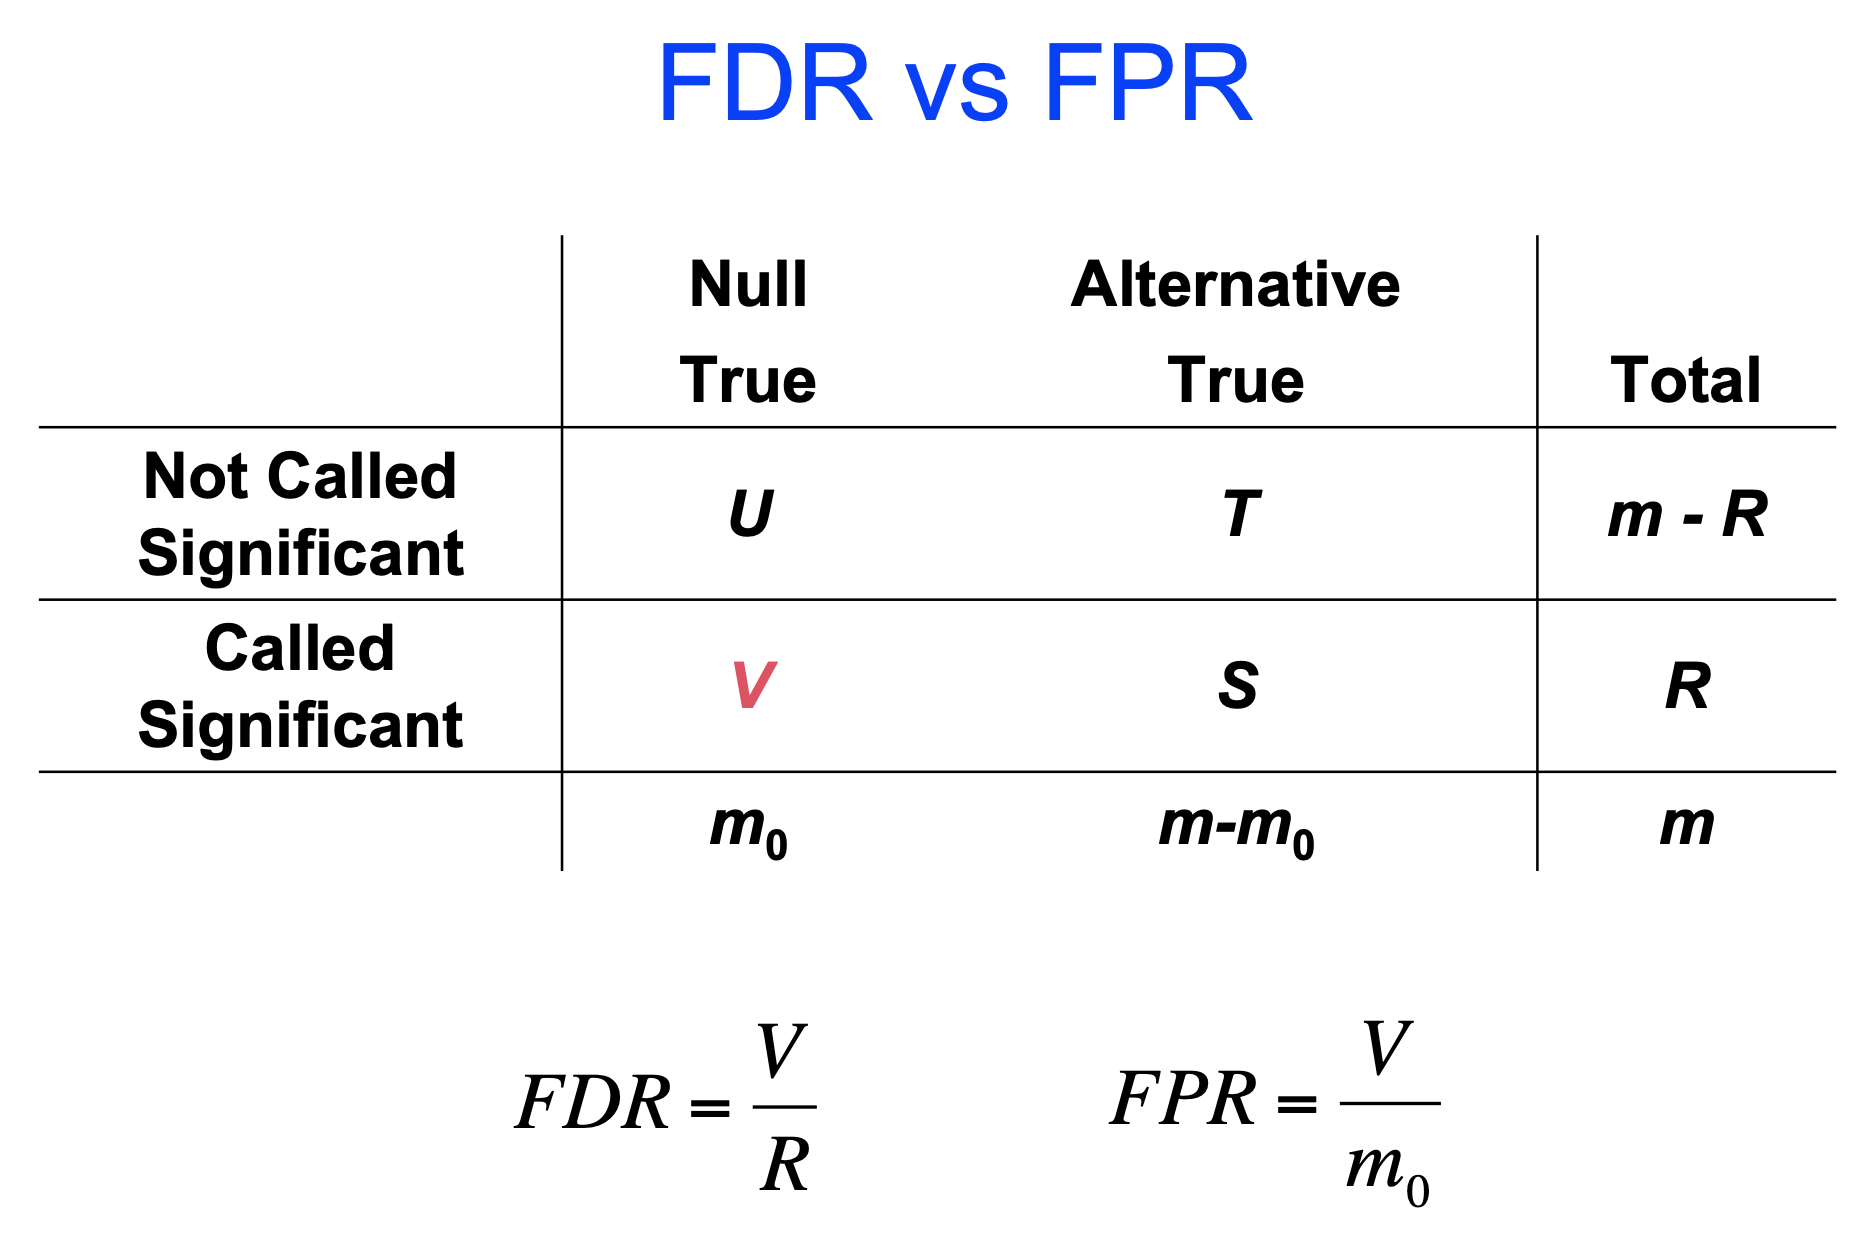
所有的问题都是围绕着多重和error(就是一个2X2的表,根据检验和真实,有四种可能)的:
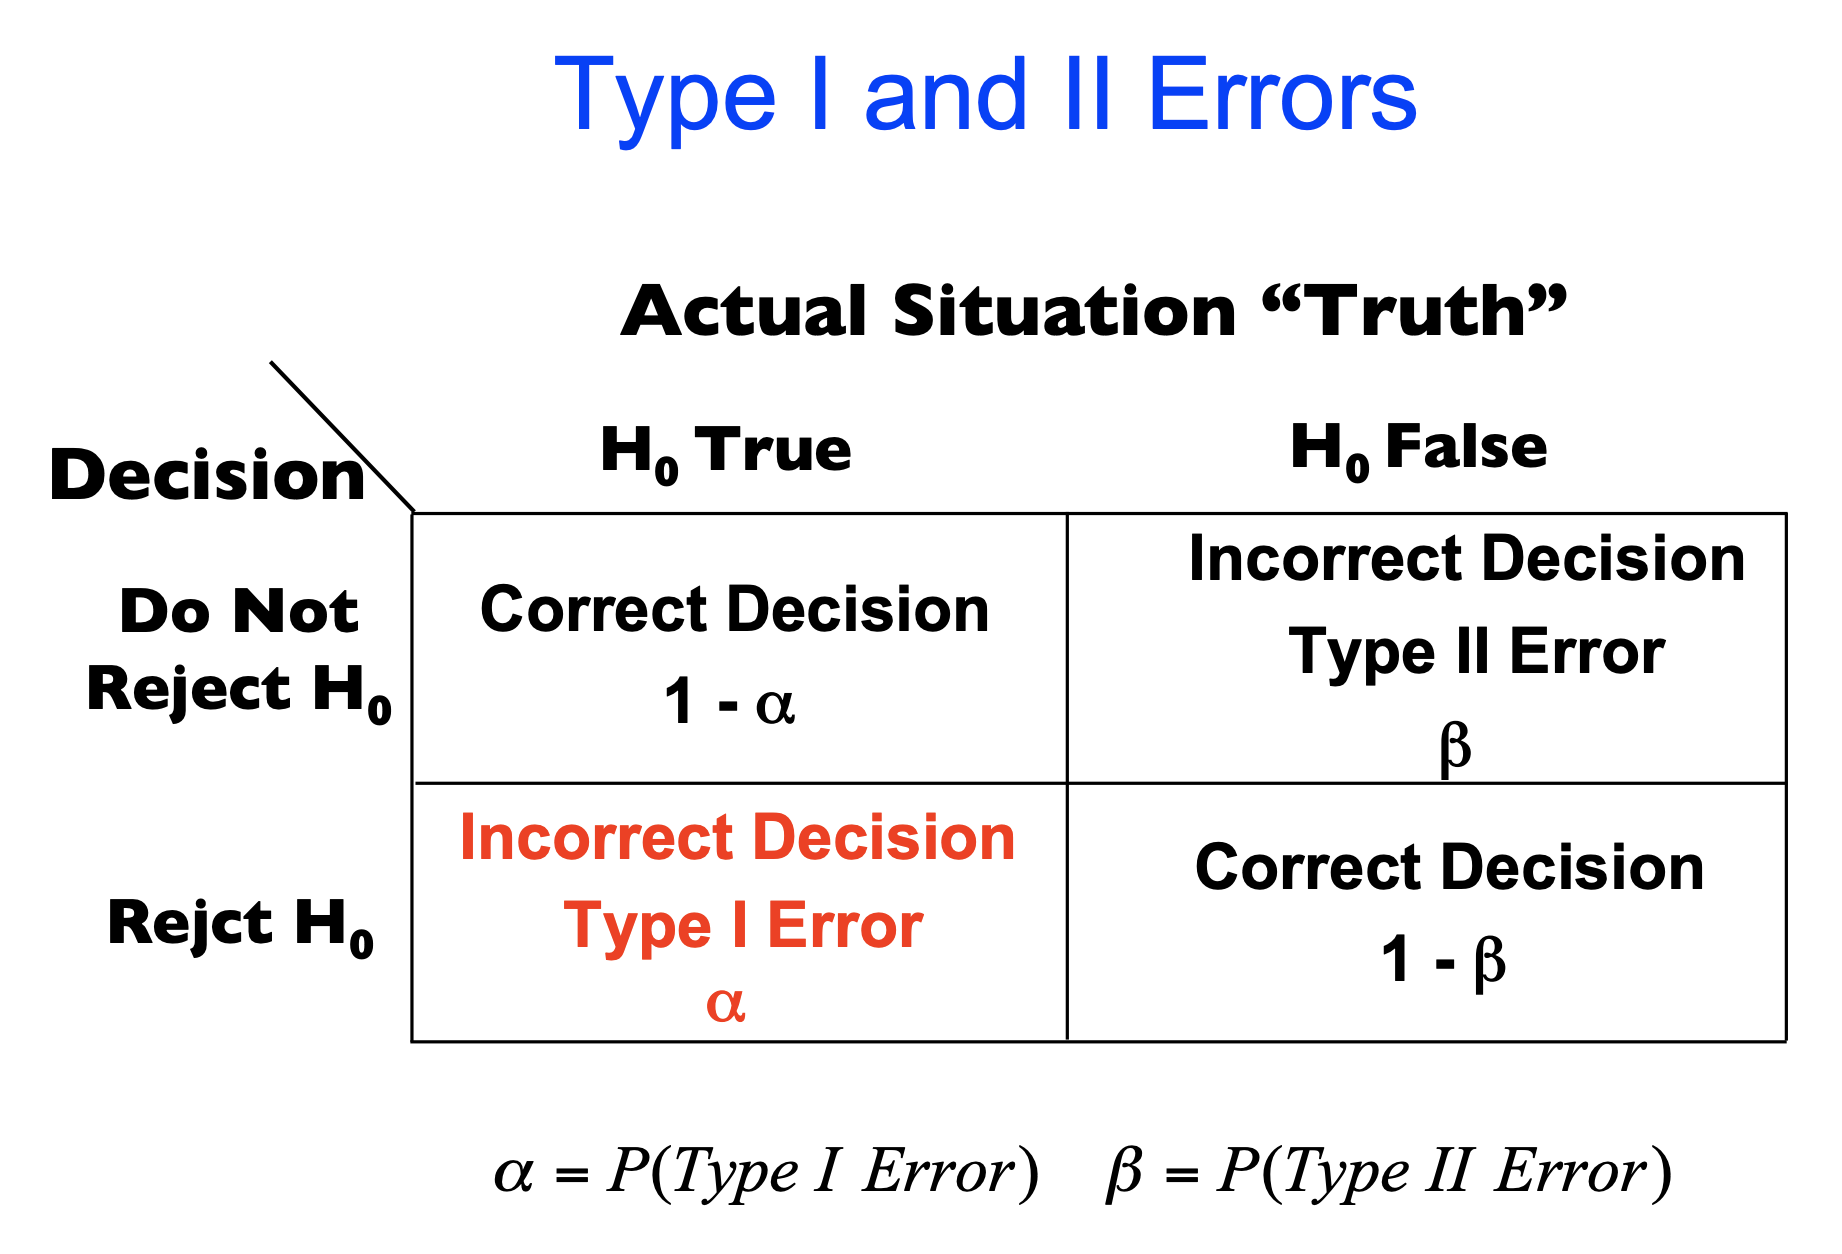
做一次检验,我们犯第一类错误(应该是真的,我们拒绝了,又叫错误拒绝率)为a,犯第二类错误(应该是假的,我们接受了,又叫纳伪率)为b。
那么,我们做基因差异表达,对每一个基因做一次检验,有3万多个基因,我们至少犯1次第一类错误的概率是多少呢?1-(a)2
为了使我们整体犯第一类错的概率效率0.05,我们必须要进行多重矫正。
方法1:
Bonferroni,直接把a 0.05除以次数,比如1万,来设立显著性阈值,这样会极大地增大第二类错误,我们会漏掉大量有用的信息。
方法2:
FDR,就是错误发现率,假/真阳性比例,就是显著水平里的真显著和假显著的比例。千万不要和假阳性率搞混了。
做法很简答,把我们检测出来的显著的结果按p-value排列一下,去掉后面5%不太显著的结果。FDR的计算方法很多,BH最为常用。
最熟悉的例子就是:生物信息学里的GO富集分析,一次检验是指我们的gene list与一个GO term做超几何分布检验,然而GO terms那么多,我们必须矫正,以控制错误率。
另一个就是一鸣的组会讲的回归问题的拟合,我们拟合了很多次,需要对p-value做矫正,看PPT。
medium专题
这个非常值得一看,回归里的系数和p-value分别是什么含义。
How to Interpret Regression Analysis Results: P-values and Coefficients
null hypothesis:coefficient is 0,如果p-value小于0.05,我们就可以拒绝零假设。
multiple testing
Benjamini and Hochberg's method
aggregated FDR
FDR with group info
Hu, James X., Hongyu Zhao, and Harrison H. Zhou. "False discovery rate control with groups." Journal of the American Statistical Association 105.491 (2010): 1215-1227.
pak说:这个太重要了,对于大数据时代的统计而言。
一般情况下:我们可以认为Q value = FDR = adjusted p value,即三者是一个东西,虽然有些定义上的细微区别,但是问题也不大。
参考:浅谈多重检验校正FDR
待续~
regression | p-value | Simple (bivariate) linear model | 线性回归 | 多重检验 | FDR | BH | R代码的更多相关文章
- Bayesian generalized linear model (GLM) | 贝叶斯广义线性回归实例
一些问题: 1. 什么时候我的问题可以用GLM,什么时候我的问题不能用GLM? 2. GLM到底能给我们带来什么好处? 3. 如何评价GLM模型的好坏? 广义线性回归啊,虐了我快几个月了,还是没有彻底 ...
- pytorch Model Linear实现线性回归CUDA版本
实验代码 import torch import torch.nn as nn #y = wx + b class MyModel(nn.Module): def __init__(self): su ...
- Note for video Machine Learning and Data Mining——Linear Model
Here is the note for lecture three. the linear model Linear model is a basic and important model in ...
- 从线性模型(linear model)衍生出的机器学习分类器(classifier)
1. 线性模型简介 0x1:线性模型的现实意义 在一个理想的连续世界中,任何非线性的东西都可以被线性的东西来拟合(参考Taylor Expansion公式),所以理论上线性模型可以模拟物理世界中的绝大 ...
- 2. Linear Model
1. 基本形式 给定由$d$个属性描述的示例 $\textbf{x} =(x_1;x_2;...,x_n)$,其中$x_i$是$x$在第$i$个属性上的取值,线性模型(linear model)试图学 ...
- 广义线性模型(Generalized Linear Model)
广义线性模型(Generalized Linear Model) http://www.cnblogs.com/sumai 1.指数分布族 我们在建模的时候,关心的目标变量Y可能服从很多种分布.像线性 ...
- [机器学习]Generalized Linear Model
最近一直在回顾linear regression model和logistic regression model,但对其中的一些问题都很疑惑不解,知道我看到广义线性模型即Generalized Lin ...
- Generic recipe for data analysis with general linear model
Generic recipe for data analysis with general linear model Courtesy of David Schneider State populat ...
- Lasso linear model实例 | Proliferation index | 评估单细胞的增殖指数
背景:We developed a cell-cycle scoring approach that uses expression data to compute an index for ever ...
随机推荐
- CDI services--Scope(生命周期)&&EL.(Sp El)
一.EL/SpEL 1.EL语言(CDI与表达式语言(EL)集成,允许在JavaServer Faces页面或JavaServer Pages页面中直接使用任何组件) 1)概述:EL是JSP内置的表达 ...
- asp.net无限递归
private void button1_Click(object sender, EventArgs e) { DialogResult dialogResult = folderBrowserDi ...
- centos7 源码安装php7
因为php安装需要编译,所以服务器应该保证gcc和g++环境的安装 1. 首先释放安装包: tar -xvzf php-7.0.5.tar.gz cd php-7.0.5 2. 接下来进行参数配置,配 ...
- 2018-2019-2 20165305《网络攻防技术》Exp5 MSF基础应用
1. 实践内容 本实践目标是掌握metasploit的基本应用方式,重点常用的三种攻击方式的思路.具体需要完成: 1.1一个主动攻击实践,如ms08_067; (1分) 1.2 一个针对浏览器的攻击, ...
- 五一培训 DAY1
DAY1 枚举 例题1 题解: 例题2 题解: 例题3 题解: vis[ ]判断是否为素数,pri[ ]储存素数 例题4 题解: 例题5 题解: PS: i < 1<<n ...
- kbmmemtable sorton 报错 : List index out of bounds
同一数据集,不同的排序条件,有的可以,但某一条件,却能100%重现报错. procedure TkbmIndex.InternalFastQuickSort(const L,R:Integer); v ...
- C sharp #001# hello world
饮水思源:金老师的自学网站 索引 编写一个简单的控制台程序. 日期计算的结构化编程实现 日期计算机面向对象编程实现 直接应用已有组件 1.编写一个简单的控制台程序. using System; usi ...
- python操作字符串类型json的注意点
python操作json的方法有json.dumps——将json对象(字典)转换为字符串对象json.loads——将字符串对象转换为json对象(字典)如果定义json对象jsonstring1= ...
- python coroutine
1. Python Async/Await入门指南 2. 用 Python 3 的 async / await 做异步编程 3.
- shell实现大批量word转码然后分析相关字段
需求 需要从服务器中的所有附件(2013-2019) 共60G查找相关字段 在linux上面直接打开doc等是乱码的 思路 先全部附件转码为txt, 然后用grep遍历查找字段实现 转码shell # ...