matplotlib热图
1.基础知识点回顾
- 1.plot(x, y, marker='D')表示绘制折线图,marker设置样式菱形。
- 2.scatter(x, y, marker='s', color='r')绘制散点图,红色正方形。
- 3.bar(x, y, 0.5, color='c')绘制柱状图,间距为0.5,原色。
- 4.hist(data,40,normed=1,histtype='bar',facecolor='yellowgreen',alpha=0.75)直方图。
- 5.设置x轴和y轴的坐标值:
- xlim(-2.5, 2.5) #设置x轴范围
- ylim(-1, 1) #设置y轴范围
- 6.显示中文和负号代码如下:
- plt.rcParams['font.sas-serig']=['SimHei'] #用来正常显示中文标签
- plt.rcParams['axes.unicode_minus']=False #用来正常显示负号
2.Heatmap热图基础知识
详情请参阅:http://matplotlib.org/users/image_tutorial.html
In [1]: import matplot.pyplot as plt

In [2]: help(plt.imshow)

Help on function imshow in module matplotlib.pyplot:

imshow(X, cmap=None, norm=None, aspect=None, interpolation=None, alpha=None, vmin=None, vmax=None, origin=None, extent=None, shape=None, filternorm=1, filterrad=4.0, imlim=None, resample=None, url=None, hold=None, data=None, **kwargs)

    Display an image on the axes.

    Parameters

    ----------

    X : array_like, shape (n, m) or (n, m, 3) or (n, m, 4)

        Display the image in `X` to current axes.  `X` may be an

        array or a PIL image. If `X` is an array, it

        can have the following shapes and types:

        - MxN -- values to be mapped (float or int)

        - MxNx3 -- RGB (float or uint8)

        - MxNx4 -- RGBA (float or uint8)

        The value for each component of MxNx3 and MxNx4 float arrays

        should be in the range 0.0 to 1.0. MxN arrays are mapped

        to colors based on the `norm` (mapping scalar to scalar)

        and the `cmap` (mapping the normed scalar to a color).

    cmap : `~matplotlib.colors.Colormap`, optional, default: None

        If None, default to rc `image.cmap` value. `cmap` is ignored

        if `X` is 3-D, directly specifying RGB(A) values.
参数X可以是图片也可以数组,若是数组,必须以下三种形式
- MxN:values to be mapped (float or int)
- MxNx3 -- RGB (float or uint8)
- MxNx4 -- RGBA (float or uint8))
- 3维数组或4维数组范围必须是(0,1)
- 参考:http://blog.csdn.net/Eastmount/article/details/73392106?fps=1&locationNum=5
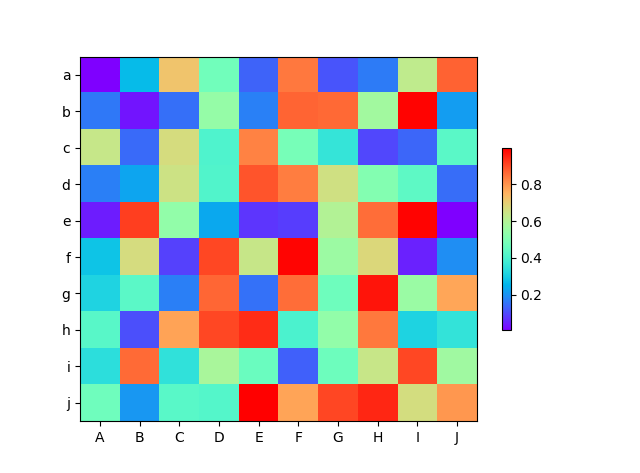
3.Heatmap热图绘制
import numpy as np

from matplotlib import pyplot as plt

from matplotlib import cm

from matplotlib import axes

def draw_heatmap(data,xlabels,ylabels):

    #cmap=cm.Blues

    cmap=cm.get_cmap('rainbow',1000)

    figure=plt.figure(facecolor='w')

    ax=figure.add_subplot(1,1,1,position=[0.1,0.15,0.8,0.8])

    ax.set_yticks(range(len(ylabels)))

    ax.set_yticklabels(ylabels)

    ax.set_xticks(range(len(xlabels)))

    ax.set_xticklabels(xlabels)

    map=ax.imshow(data,interpolation='nearest',cmap=cmap,aspect='auto',vmin=a.min(),vmax=a.max())

    cb=plt.colorbar(mappable=map,cax=None,ax=None,shrink=0.5)

    plt.show()

a=np.random.rand(10,10)

print(a)

xlabels=['A','B','C','D','E','F','G','H','I','J']

ylabels=['a','b','c','d','e','f','g','h','i','j']

draw_heatmap(a,xlabels,ylabels)
这里想把某块显示成一种颜色,则需要调用interpolation='nearest'参数即可
matplotlib热图的更多相关文章
- 基于matplotlib的数据可视化 - 热图imshow
热图: Display an image on the axes. 可以用来比较两个矩阵的相似程度 mp.imshow(z, cmap=颜色映射,origin=垂直轴向) imshow( X, cma ...
- Matplotlib学习---用matplotlib画热图(heatmap)
这里利用Nathan Yau所著的<鲜活的数据:数据可视化指南>一书中的数据,学习画图. 数据地址:http://datasets.flowingdata.com/ppg2008.csv ...
- python matplotlib imshow热图坐标替换/映射
今天遇到了这样一个问题,使用matplotlib绘制热图数组中横纵坐标自然是图片的像素排列顺序, 但是这样带来的问题就是画出来的x,y轴中坐标点的数据任然是x,y在数组中的下标, 实际中我们可能期望坐 ...
- Python图表数据可视化Seaborn:3. 线性关系数据| 时间线图表| 热图
1. 线性关系数据可视化 lmplot( ) import numpy as np import pandas as pd import matplotlib.pyplot as plt import ...
- 基于HTML5实现3D热图Heatmap应用
Heatmap热图通过众多数据点信息,汇聚成直观可视化颜色效果,热图已广泛被应用于气象预报.医疗成像.机房温度监控等行业,甚至应用于竞技体育领域的数据分析. http://www.hightopo.c ...
- 用Excel制作热图(heatmap)的方法
http://jingyan.baidu.com/article/64d05a0240ec75de55f73bd8.html 利用Excel 2010及以上版本的"条件格式"--& ...
- Heatmap.js v2.0 – 最强大的 Web 动态热图
Heatmap 是用来呈现一定区域内的统计度量,最常见的网站访问热力图就是以特殊高亮的形式显示访客热衷的页面区域和访客所在的地理区域的图示.Heatmap.js 这个 JavaScript 库可以实现 ...
- 基于HTML5实现的Heatmap热图3D应用
Heatmap热图通过众多数据点信息,汇聚成直观可视化颜色效果,热图已广泛被应用于气象预报.医疗成像.机房温度监控等行业,甚至应用于竞技体育领域的数据分析. 已有众多文章分享了生成Heatmap热图原 ...
- matplotlib 出图示例
如果你想要在Linxu中获得一个高效.自动化.高质量的科学画图的解决方案,应该考虑尝试下matplotlib库.Matplotlib是基于python的开源科学测绘包,基于python软件基金会许可证 ...
随机推荐
- jQuery多文件下载
文件下载是一个Web中非常常用的功能,不过你是做内部管理系统还是做面向公众的互联网公司都会遇到这个问题,对于下载一般有点实际开发经验的都会自己解决,上周弄了一下多文件下载,业务场景就是一条数据详细信息 ...
- android 随手记 摄像头录像
1 xml <?xml version="1.0" encoding="utf-8"?> <LinearLayout xmlns:androi ...
- [jQuery] $.map, $.each, detach() , $.getJSOIN()
$.map function will return the modifies array. $.each function will not new a new array, the old val ...
- 【Nodejs】“快算24”扑克牌游戏算法
算24是一款扑克牌游戏,它的游戏方式是把四张牌的牌面数值通过四则运算得到结果24,四张牌必须仅用一次.这是一种挺好的锻炼孩子算数能力的扑克牌游戏. 各地玩法还有点差别,有的只算1-10,其它抽出来:有 ...
- 单页WEB应用(三),Chat聊天模块
Chat 聊天模块 这个模块应该就是该书全篇的唯一一个模块吧,后面差点儿全部的篇章都环绕这个模块去实现的,只是就通过这一个模块的实现和上线,也能体现单页应用开发到公布上线的整个过程,毕竟后面的数据.通 ...
- TCP/IP协议族——IP工作原理及实例具体解释(上)
IP协议具体解释 本文主要介绍了IP服务特点,头部结构,IP分片知识,并用tcpdump抓取数据包.来观察IP数据报传送过程中IP的格式,以及分片的过程. IP头部信息:IP头部信息出如今每一个 ...
- mac 连接windows 共享内容
mac 连接windows 共享内容 一:场景 在win7上下载了一个5G左右的系统文件,想弄到mac上,本打算用使用U盘,把文件从win7copy到mac电脑上: 可是U盘的分区是fat的,大于4G ...
- PACS系统简易
PACS系统 http://baike.baidu.com/link?url=prHBMbyu5W98ET1UGQ0PXXxLebxAeljckFH0pfO_2aODe1UgsrWgRd4Unbopt ...
- SVN diff 笔记
SVN diff命令在实际中经常使用,在此记录使用点滴. #对比工作文件与缓存在.svn的“原始”拷贝: svn diff #显示工作文件和服务器版本2的不同: svn diff -r 2 #显示分支 ...
- 教您使用java爬虫gecco抓取JD全部商品信息
gecco爬虫 如果对gecco还没有了解可以参看一下gecco的github首页.gecco爬虫十分的简单易用,JD全部商品信息的抓取9个类就能搞定. JD网站的分析 要抓取JD网站的全部商品信息, ...