Linux下如何查看高CPU占用率线程 专题
Java 系统性能分析 命令
1. cpu分析
top , pidstat(sysstat)
pid -p PID -t 1 10
vmstat 1 CPU上下文切换、运行队列、利用率
ps Hh -eo tid
pcpu 查看具体线程的CPU消耗
sar 来查看一定世界范围内以及历史的cpu消耗情况信息
查看java线程信息
jstack pid | grep 'nid=0x9999'
2. cs sy消耗比较高
上下文切换性能偏高, jstack -l pid, 查看on object monitor
3. io消耗
pidstat -d -t -p pid 1 100
iostat
4. 网络io消耗
cat /proc/interruptes
sar -n FULL 1 2
tcpdump
http://www.cnblogs.com/lidabo/p/4738113.html
近期java应用,CPU使用率一直很高,经常达到100%,通过以下步骤完美解决,分享一下。
方法一:
转载:http://www.linuxhot.com/java-cpu-used-high.html
1.jps 获取Java进程的PID。
2.jstack pid >> java.txt 导出CPU占用高进程的线程栈。
3.top -H -p PID 查看对应进程的哪个线程占用CPU过高。
4.echo “obase=16; PID” | bc 将线程的PID转换为16进制,大写转换为小写。
5.在第二步导出的Java.txt中查找转换成为16进制的线程PID。找到对应的线程栈。
6.分析负载高的线程栈都是什么业务操作。优化程序并处理问题。
方法二:
1.使用top 定位到占用CPU高的进程PID
top
通过ps aux | grep PID命令
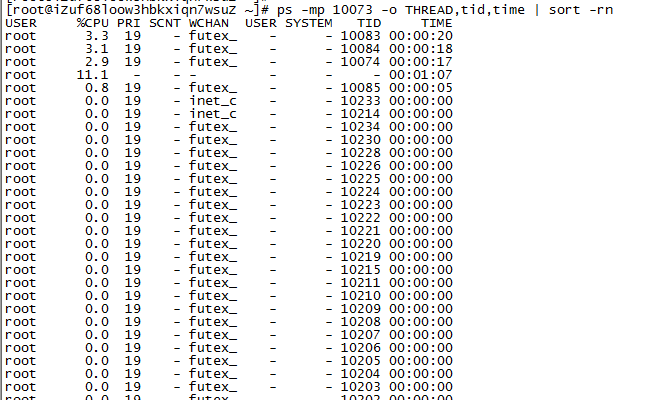
2.获取线程信息,并找到占用CPU高的线程
ps -mp pid -o THREAD,tid,time | sort -rn
譬如:
ps -mp -o THREAD,tid,time | sort -rn
3.将需要的线程ID转换为16进制格式
printf "%x\n" tid
4.打印线程的堆栈信息
jstack pid |grep tid -A 30
http://www.cnblogs.com/pangguoping/p/5715848.html
c233 plugins # ps -elf|head -1
F S UID PID PPID C PRI NI ADDR SZ WCHAN STIME TTY TIME CMD
4 S root 28149 4204 0 80 0 - 16283 poll_s Jul05 ? 00:00:00 sshd: root
73
PROCESS FLAGS
The sum of these values is displayed in the "F" column, which is provided by the flags output specifier.
1 forked but didn't exec
4 used super-user privileges
(1)S列.
D Uninterruptible sleep (usually IO)
R Running or runnable (on run queue)
S Interruptible sleep (waiting for an event to complete)
T Stopped, either by a job control signal or because it is being traced.
W paging (not valid since the 2.6.xx kernel)
X dead (should never be seen)
Z Defunct ("zombie") process, terminated but not reaped by its parent.
(3)C列.C pcpu cpu utilization
(4)
command COMMAND see args. (alias args, cmd).
sz SZ size in physical pages of the core image of the process. This
includes text, data, and stack space. Device mappings are currently
excluded; this is subject to change. See vsz and rss.
(5)WCHAN列.
wchan WCHAN name of the kernel function in which the process is sleeping,
a "-" if the process is running, or a "*" if the process is
multi-threaded and ps is not displaying threads.
二、统计当前运行的线程总数."-L"
c233 plugins # ps -eLf|grep -v $$|wc -l //-L Show threads, possibly with LWP and NLWP columns
646
c233 plugins # ps -eLf|grep -v $$|tail
UID PID PPID LWP C NLWP STIME TTY TIME CMD
root 23678 1 688 0 36 Jul01 ? 00:00:06 /usr/sbin/nscd
root 23678 1 689 0 36 Jul01 ? 00:00:06 /usr/sbin/nscd
root 23678 1 690 0 36 Jul01 ? 00:00:06 /usr/sbin/nscd
root 23678 1 691 0 36 Jul01 ? 00:00:06 /usr/sbin/nscd
root 23678 1 692 0 36 Jul01 ? 00:00:06 /usr/sbin/nscd
root 23678 1 693 0 36 Jul01 ? 00:00:06 /usr/sbin/nscd
root 23678 1 694 0 36 Jul01 ? 00:00:06 /usr/sbin/nscd
root 23678 1 695 0 36 Jul01 ? 00:00:06 /usr/sbin/nscd
root 23678 1 696 0 36 Jul01 ? 00:00:06 /usr/sbin/nscd
root 28149 4204 28149 0 1 Jul05 ? 00:00:00 sshd: root
NLWP (number of threads)
LWP (thread ID)
c233 plugins # ps -ef|grep nscd
root 23678 1 0 Jun30 ? 00:15:32 /usr/sbin/nscd
三、Linux下查看某个进程的线程数量.
1.根据进程号进行查询:
# pstree -p 进程号 //-p pid
# top -Hp 进程号 //-H : Threads toggle
2.根据进程名字进行查询:
# pstree -p `ps -e | grep sshd | awk '{print $1}'`
# pstree -p `ps -e | grep sshd | awk '{print $1}'` | wc -l
http://www.cnblogs.com/itcomputer/p/4652140.html
003_监测域名证书过期时间
由于因为线上证书过期,出过比较大的事故,所以就有了如下的监测证书过期的脚本
#!/bin/sh

### SSL Certificate Expire Day Check Script ###

if [ "$1" = '' ];then

    echo "Need URL."

    exit

;fi

TARGET_URL=$

EXP_DAY=`openssl s_client -connect ${TARGET_URL}: < /dev/null > /dev/null | openssl x509 -text > /dev/null | grep "Not After" | sed -e 's/^ *//g' | cut -d " " -f ,,,,`

NOW_TIME=`date +%s`

EXP_TIME=`date +%s -d "${EXP_DAY}"`

if [ "${EXP_DAY}" != '' -a ${NOW_TIME} -lt ${EXP_TIME} ]; then

    echo $(((EXP_TIME-NOW_TIME)/(**)))

else

    echo "ERROR"

    exit ;

fi
http://www.cnblogs.com/itcomputer/p/7192734.html
Linux通过PID查看进程完整信息
说明
通过ps及top命令查看进程信息时,只能查到相对路径,查不到的进程的详细信息,如绝对路径等。
先通过top查看进程PID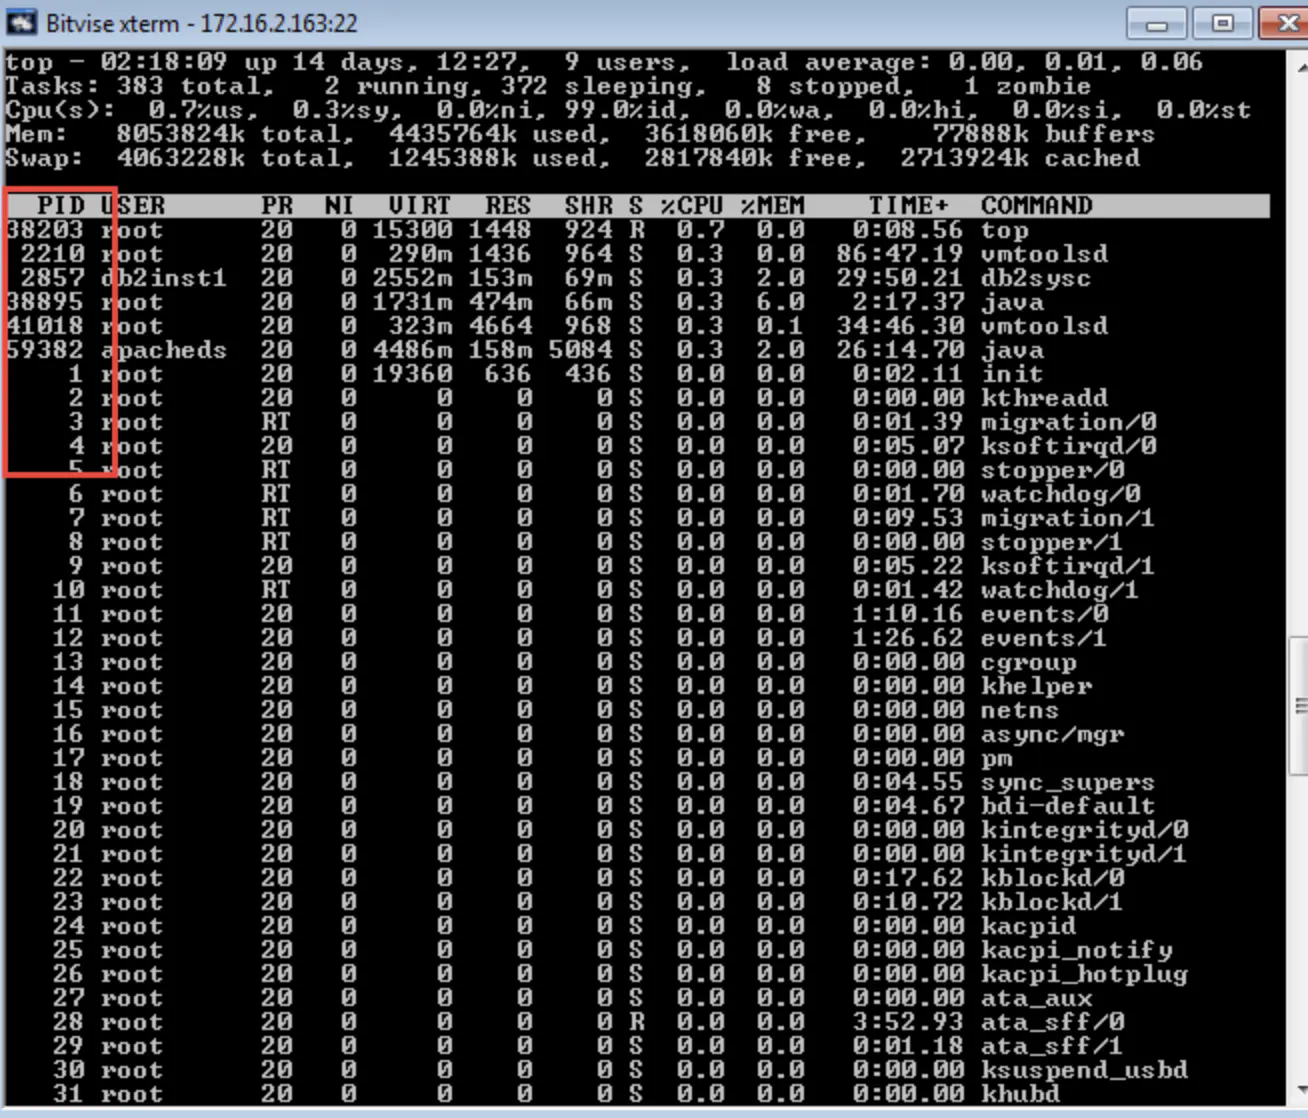
这时,我们需要通过以下的方法来查看进程的详细信息:
Linux在启动一个进程时,系统会在/proc下创建一个以PID命名的文件夹,在该文件夹下会有我们的进程的信息,其中包括一个名为exe的文件即记录了绝对路径,通过ll或ls –l命令即可查看。
ll /proc/PID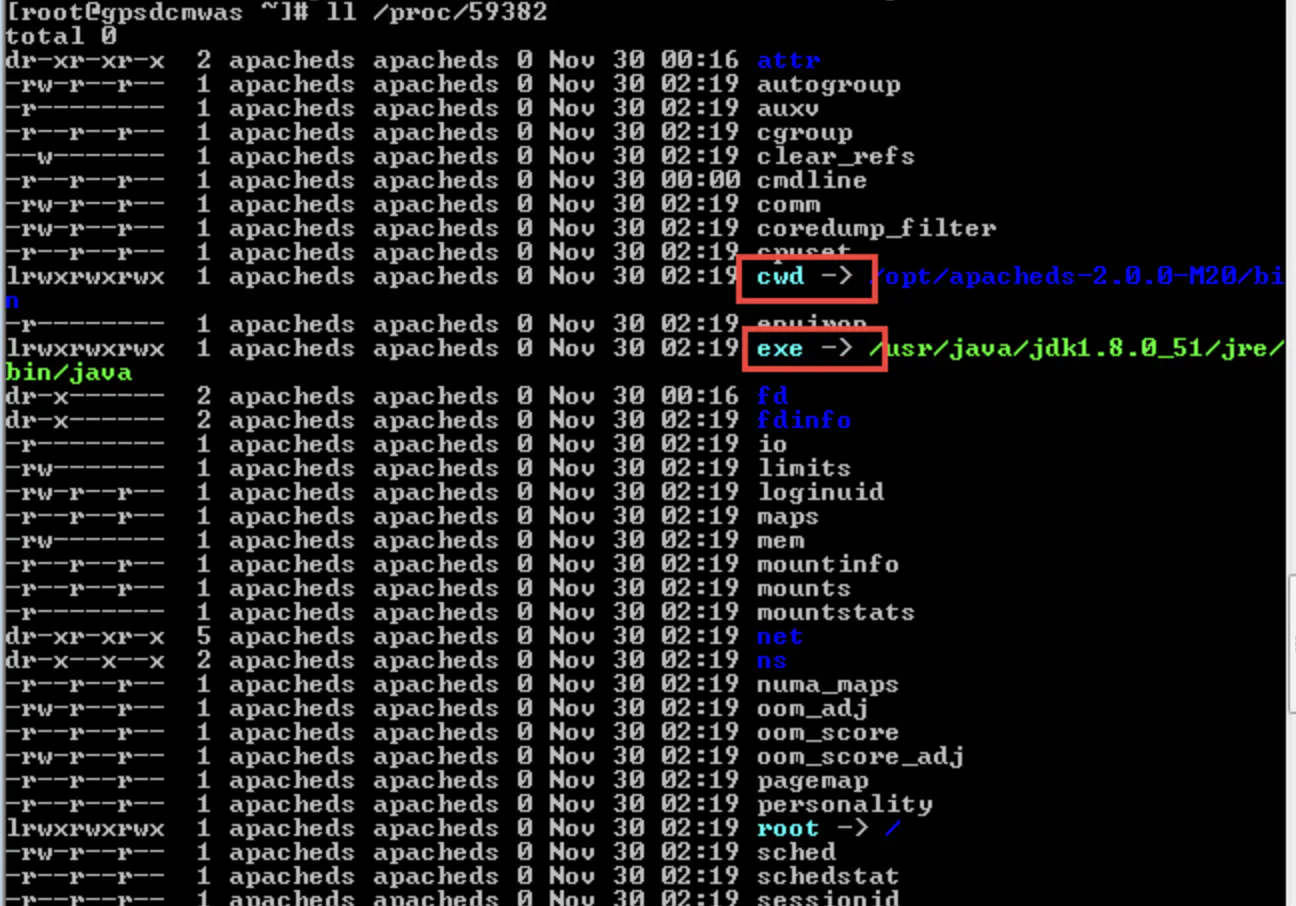
解释
cwd符号链接的是进程运行目录;
exe符号连接就是执行程序的绝对路径;
cmdline就是程序运行时输入的命令行命令;
environ记录了进程运行时的环境变量;
fd目录下是进程打开或使用的文件的符号连接。
https://www.jianshu.com/p/383b998b77d0
Linux下如何查看高CPU占用率线程 专题的更多相关文章
- Linux下如何查看高CPU占用率线程
转于:http://www.cnblogs.com/lidabo/p/4738113.html 目录(?)[-] proc文件系统 proccpuinfo文件 procstat文件 procpidst ...
- Linux下如何查看高CPU占用率线程 LINUX CPU利用率计算
目录(?)[-] proc文件系统 proccpuinfo文件 procstat文件 procpidstat文件 procpidtasktidstat文件 系统中有关进程cpu使用率的常用命令 ps ...
- (笔记)Linux下如何查看高CPU占用率线程
在 Linux 下 top 工具可以显示 cpu 的平均利用率(user,nice,system,idle,iowait,irq,softirq,etc.),可以显示每个 cpu 的利用率.但是无法显 ...
- Linux下如何查看高CPU占用率线程 LINUX CPU利用率计算(转)
Java 系统性能分析 命令 1. cpu分析 top , pidstat(sysstat) pid -p PID -t 1 10 vmstat 1 CPU上下文切换.运行队列.利用率 ps Hh - ...
- Linux下分析某个进程CPU占用率高的原因
Linux下分析某个进程CPU占用率高的原因 通过top命令找出消耗资源高的线程id,利用strace命令查看该线程所有系统调用 1.top 查到占用cpu高的进程pid 2.查看该pid的线程 ...
- linux top命令中各cpu占用率含义
linux top命令中各cpu占用率含义 [尊重原创文章摘自:http://www.iteye.com/topic/1137848]0.3% us 用户空间占用CPU百分比 1.0% sy 内核空间 ...
- (转)linux top命令中各cpu占用率含义及案例分析
原文:https://blog.csdn.net/ydyang1126/article/details/72820349 linux top命令中各cpu占用率含义 0 性能监控介绍 1 确定应用类型 ...
- Visual Studio 2013 Ultimate因为CodeLens功能导致Microsoft.Alm.Shared.Remoting.RemoteContainer.dll高CPU占用率的折中解决方案
1.为什么Microsoft.Alm.Shared.Remoting.RemoteContainer.dll的CPU占用率以及内存使用率会那么高? 在Visual Studio 2013 Ultima ...
- [项目机会]citrix 虚拟桌面对于java等高CPU占用率如何解决
citrix 虚拟桌面对于java等高CPU占用率如何解决 问题1:java等客户端对于虚拟桌面cpu影响较大,但是有些用户的确需要使用java支持的程序,是否可以通过其他途径来解决? 问题2:对于其 ...
随机推荐
- Effective C++ 条款14
在资源管理器中小心copying行为 上节是对资源的管理说明.有时候我们不能依赖于shared_ptr或者auto_ptr,所以我们须要自己建立一个资源管理类来管理自己的资源. 比如建立一个类来管理M ...
- SystemServer概述
SystemServer由Zygote fork生成的,进程名为system_server,该进程承载着framework的核心服务. 调用流程如下: 上图前4步骤(即颜色为紫色的流程)运行在是Zyg ...
- 【BZOJ 1023】[SHOI2008]cactus仙人掌图
[题目链接]:http://www.lydsy.com/JudgeOnline/problem.php?id=1023 [题意] [题解] 如果不考虑有环的情况; 那么有一个经典的求树的直径的方法; ...
- 详解Qt,并举例说明动态编译(shared)和静态编译(static)以及debug and release 编译版本区别(可产生静态版的Debug版本,需要把-release 改为 –debug-and-release)
作为初入Qt学习的新人,花了整整一两天时间,对Qt编译版本等问题进行了一步步探索,首先感谢网站博客中文章,开始也不是很明白一些几个问题: 1.Qt版本问题 作为初学者,可能下载时这么多版本,如何选择呢 ...
- Win7,Vista UAC下应用程序标注为“需要管理员权限”的四种方法(可以修改注册表)
[转]Vista UAC下应用程序标注为“需要管理员权限”的四种方法 在Microsoft 的UACBlog里对此有过叙述.总结如下: 首先,如果一个程序被识别为管理员程序时,Vista会在它的图标上 ...
- wpf绑定全局静态变量(mvvm)
原文 wpf绑定全局静态变量(mvvm) 在实际的开发中,有一些集合或者属性可能是全局的,比如当你做一个oa的时候,可能需要展示所有的人员,这时这个所有的人员列表显然可以作为全局参数,比如这里有一个全 ...
- [UWP]在应用开发中安全使用文件资源
原文:[UWP]在应用开发中安全使用文件资源 在WPF或者UWP应用开发中,有时候会不可避免的需要操作文件系统(创建文件/目录),这时候有几个坑是需要大家注意下的. 创建文件或目录时的非法字符检测 在 ...
- QWidget之Alien与Native小记(果然是DirectUI的方式,QWidget居然提供了nativeParentWidget函数,而且可以动态设置native父窗口)good
在QWidget 之paint部分杂记提到了从Qt4.4开始,Alien Widget被引入.那么...这是什么东西呢,我们在使用中又可能会感受到什么东西? 用例子来说话似乎比用源码来说话来得容易,所 ...
- 主干(trunk)、分支(branch )、标记(tag)
主干(trunk).分支(branch ).标记(tag) 用法示例 + 图解 以svn为例,git的master相当于trunk,dev分支相当于branches --------------- ...
- 参数方法(parameter)与非参数方法(nonparameter)
参数方法表示参数固定,不随数据点的变化而变化: 非参数方法并不意味着没有参数,而是说,参数的数目随数据点而变化, 1. 参数方法举例 logistic regression:p(y=1|x,α)=11 ...