Matplotlib绘图设置---文字和标签
文字和文字位置
通过plt.text()或ax.text()命令可在图形上添加文字。
Signature:

ax.text(x, y, s, fontdict=None, withdash=<deprecated parameter>, **kwargs)

Docstring:

Add text to the axes.

Add the text *s* to the axes at location *x*, *y* in data coordinates.

Parameters

----------

x, y : scalars

    The position to place the text. By default, this is in data

    coordinates. The coordinate system can be changed using the

    *transform* parameter.

s : str

    The text.

fontdict : dictionary, optional, default: None

    A dictionary to override the default text properties. If fontdict

    is None, the defaults are determined by your rc parameters.

withdash : boolean, optional, default: False

    Creates a `~matplotlib.text.TextWithDash` instance instead of a

    `~matplotlib.text.Text` instance.

Returns

-------

text : `.Text`

    The created `.Text` instance.

Other Parameters

----------------

**kwargs : `~matplotlib.text.Text` properties.

    Other miscellaneous text parameters.

Examples

--------

Individual keyword arguments can be used to override any given

parameter::

    >>> text(x, y, s, fontsize=12)

The default transform specifies that text is in data coords,

alternatively, you can specify text in axis coords (0,0 is

lower-left and 1,1 is upper-right).  The example below places

text in the center of the axes::

    >>> text(0.5, 0.5, 'matplotlib', horizontalalignment='center',

    ...      verticalalignment='center', transform=ax.transAxes)

You can put a rectangular box around the text instance (e.g., to

set a background color) by using the keyword `bbox`.  `bbox` is

a dictionary of `~matplotlib.patches.Rectangle`

properties.  For example::

    >>> text(x, y, s, bbox=dict(facecolor='red', alpha=0.5))
text函数中transform参数用于设置坐标变换,Matplotlib一共有三种方式设置文字位置:
- ax.transData : 默认的,以数据为基准的坐标变换(x轴和y轴的标签作为数据坐标);
- ax.transAxes: 以坐标轴为基准的坐标变换(以坐标轴左下角原点,按坐标轴尺寸的比例呈现坐标);
- fig.transFigure:以图形为基准的坐标变换(以图纸左下角原点,按图形尺寸的比例呈现坐标)。
三个坐标系呈现的文字都是左对齐,当改变坐标轴上下限时,只有transData坐标会受影响,其它两个坐标系不变。
fig, ax = plt.subplots(facecolor='lightgray')

ax.axis([0, 10, 0, 10])

ax.text(1, 5, ".Data:(1, 5)", transform=ax.transData)

ax.text(0.5, 0.1, ".Axes:(0.5, 0.1)", transform=ax.transAxes)

ax.text(0.2, 0.2, ".Figure:(0.2, 0.2)", transform=fig.transFigure)
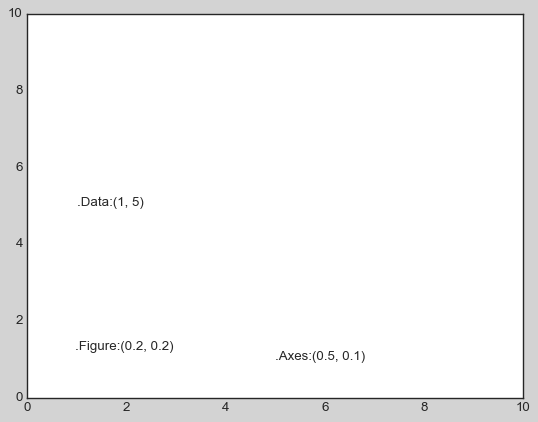
ax.set_xlim(0, 2)

ax.set_ylim(-6, 6)

fig

箭头和注释
Matplotlib中plt.annotate()/ax.annotate()函数可用于创建文字以及箭头等。
Signature:

ax.annotate(s, xy, *args, **kwargs)

Docstring:

Annotate the point *xy* with text *text*.

In the simplest form, the text is placed at *xy*.

Optionally, the text can be displayed in another position *xytext*.

An arrow pointing from the text to the annotated point *xy* can then

be added by defining *arrowprops*.

Parameters

----------

text : str

    The text of the annotation.  *s* is a deprecated synonym for this

    parameter.

xy : (float, float)

    The point *(x,y)* to annotate.

xytext : (float, float), optional

    The position *(x,y)* to place the text at.

    If *None*, defaults to *xy*.

xycoords : str, `.Artist`, `.Transform`, callable or tuple, optional

    The coordinate system that *xy* is given in. The following types

    of values are supported:

    - One of the following strings:

      =================   =============================================

      Value               Description

      =================   =============================================

      'figure points'     Points from the lower left of the figure

      'figure pixels'     Pixels from the lower left of the figure

      'figure fraction'   Fraction of figure from lower left

      'axes points'       Points from lower left corner of axes

      'axes pixels'       Pixels from lower left corner of axes

      'axes fraction'     Fraction of axes from lower left

      'data'              Use the coordinate system of the object being

                          annotated (default)

      'polar'             *(theta,r)* if not native 'data' coordinates

      =================   =============================================

    - An `.Artist`: *xy* is interpreted as a fraction of the artists

      `~matplotlib.transforms.Bbox`. E.g. *(0, 0)* would be the lower

      left corner of the bounding box and *(0.5, 1)* would be the

      center top of the bounding box.

    - A `.Transform` to transform *xy* to screen coordinates.

    - A function with one of the following signatures::

        def transform(renderer) -> Bbox

        def transform(renderer) -> Transform

      where *renderer* is a `.RendererBase` subclass.

      The result of the function is interpreted like the `.Artist` and

      `.Transform` cases above.

    - A tuple *(xcoords, ycoords)* specifying separate coordinate

      systems for *x* and *y*. *xcoords* and *ycoords* must each be

      of one of the above described types.

    See :ref:`plotting-guide-annotation` for more details.

    Defaults to 'data'.

textcoords : str, `.Artist`, `.Transform`, callable or tuple, optional

    The coordinate system that *xytext* is given in.

    All *xycoords* values are valid as well as the following

    strings:

    =================   =========================================

    Value               Description

    =================   =========================================

    'offset points'     Offset (in points) from the *xy* value

    'offset pixels'     Offset (in pixels) from the *xy* value

    =================   =========================================

    Defaults to the value of *xycoords*, i.e. use the same coordinate

    system for annotation point and text position.

arrowprops : dict, optional

    The properties used to draw a

    `~matplotlib.patches.FancyArrowPatch` arrow between the

    positions *xy* and *xytext*.

    If *arrowprops* does not contain the key 'arrowstyle' the

    allowed keys are:

    ==========   ======================================================

    Key          Description

    ==========   ======================================================

    width        The width of the arrow in points

    headwidth    The width of the base of the arrow head in points

    headlength   The length of the arrow head in points

    shrink       Fraction of total length to shrink from both ends

    ?            Any key to :class:`matplotlib.patches.FancyArrowPatch`

    ==========   ======================================================

    If *arrowprops* contains the key 'arrowstyle' the

    above keys are forbidden.  The allowed values of

    ``'arrowstyle'`` are:

    ============   =============================================

    Name           Attrs

    ============   =============================================

    ``'-'``        None

    ``'->'``       head_length=0.4,head_width=0.2

    ``'-['``       widthB=1.0,lengthB=0.2,angleB=None

    ``'|-|'``      widthA=1.0,widthB=1.0

    ``'-|>'``      head_length=0.4,head_width=0.2

    ``'<-'``       head_length=0.4,head_width=0.2

    ``'<->'``      head_length=0.4,head_width=0.2

    ``'<|-'``      head_length=0.4,head_width=0.2

    ``'<|-|>'``    head_length=0.4,head_width=0.2

    ``'fancy'``    head_length=0.4,head_width=0.4,tail_width=0.4

    ``'simple'``   head_length=0.5,head_width=0.5,tail_width=0.2

    ``'wedge'``    tail_width=0.3,shrink_factor=0.5

    ============   =============================================

    Valid keys for `~matplotlib.patches.FancyArrowPatch` are:

    ===============  ==================================================

    Key              Description

    ===============  ==================================================

    arrowstyle       the arrow style

    connectionstyle  the connection style

    relpos           default is (0.5, 0.5)

    patchA           default is bounding box of the text

    patchB           default is None

    shrinkA          default is 2 points

    shrinkB          default is 2 points

    mutation_scale   default is text size (in points)

    mutation_aspect  default is 1.

    ?                any key for :class:`matplotlib.patches.PathPatch`

    ===============  ==================================================

    Defaults to None, i.e. no arrow is drawn.

annotation_clip : bool or None, optional

    Whether to draw the annotation when the annotation point *xy* is

    outside the axes area.

    - If *True*, the annotation will only be drawn when *xy* is

      within the axes.

    - If *False*, the annotation will always be drawn.

    - If *None*, the annotation will only be drawn when *xy* is

      within the axes and *xycoords* is 'data'.

    Defaults to *None*.

**kwargs

    Additional kwargs are passed to `~matplotlib.text.Text`.
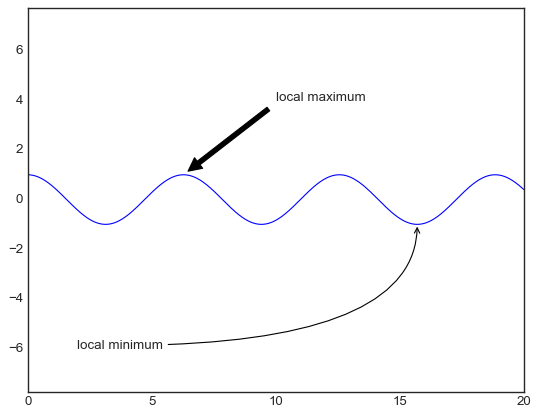
fig, ax = plt.subplots()

x = np.linspace(0, 20, 1000)

ax.plot(x, np.cos(x))

ax.axis('equal')

#arrowprops用于设置箭头风格,xy设置箭头位置,xytext设置文字位置

ax.annotate('local maximum', xy=(6.28, 1), xytext=(10, 4),

            arrowprops=dict(facecolor='black', shrink=0.05))

ax.annotate('local minimum', xy=(5 * np.pi, -1), xytext=(2, -6),

            arrowprops=dict(arrowstyle="->",connectionstyle="angle3,angleA=0,angleB=90"))
Matplotlib绘图设置---文字和标签的更多相关文章
- Python matplotlib绘图设置图例
一.语法简介 plt.legend(loc=2,edgecolor='red',facecolor='green',shadow='True',fontsize=10) #edgecolor 图例边框 ...
- 【划重点】Python matplotlib绘图设置坐标轴的刻度
一.语法简介 plt.xticks(ticks,labels,rotation=30,fontsize=10,color='red',fontweight='bold',backgroundcolor ...
- Python matplotlib绘图设置坐标轴的标题
一.语法简介 plt.xlabel("销售月份",fontsize=16,color='red',fontweight='bold',loc='center',background ...
- python绘图设置标题、标签,无法显示中文
先说解决办法:在程序开始之前,引入使用的模块之后,添加如下代码: plt.rcParams['font.sans-serif']=['SimHei'] plt.rcParams['axes.unico ...
- matplotlib绘图教程,设置标签与图例
大家好,欢迎大家阅读周四数据处理专题,我们继续介绍matplotlib作图工具. 在上一篇文章当中我们介绍了matplotlib这个包当中颜色.标记和线条这三种画图的设置,今天我们同样也介绍三种新的设 ...
- Matplotlib绘图双纵坐标轴设置及控制设置时间格式
双y轴坐标轴图 今天利用matplotlib绘图,想要完成一个双坐标格式的图. fig=plt.figure(figsize=(20,15)) ax1=fig.add_subplot(111) ax1 ...
- matplotlib 绘图
http://blog.csdn.net/jkhere/article/details/9324823 都打一遍 5 matplotlib-绘制精美的图表 matplotlib 是python最著名的 ...
- matplotlib绘图的基本操作
转自:Laumians博客园 更简明易懂看Matplotlib Python 画图教程 (莫烦Python)_演讲•公开课_科技_bilibili_哔哩哔哩 https://www.bilibili. ...
- python中利用matplotlib绘图可视化知识归纳
python中利用matplotlib绘图可视化知识归纳: (1)matplotlib图标正常显示中文 import matplotlib.pyplot as plt plt.rcParams['fo ...
- matplotlib绘图基本用法-转自(http://blog.csdn.net/mao19931004/article/details/51915016)
本文转载自http://blog.csdn.net/mao19931004/article/details/51915016 <!DOCTYPE html PUBLIC "-//W3C ...
随机推荐
- 【算法day6】哈希表、有序表、链表(反转单链表)
哈希表的简单介绍 1)哈希表在使用层面上可以理解为一种集合结构 2)如果只有key,没有伴随数据value,可以使用HashSet结构(C++中叫UnOrderedSet) 3)如果既有key,又有伴 ...
- 【Azure 应用服务】Azure Function在执行Function的时候,如果失败了,是否可以重试呢?
问题描述 Azure Function在执行Function的时候,如果失败了,是否可以重试呢? 问题解答 Function app默认是不开启重试的,但是可以修改 host.json 文件来定义重试 ...
- 【Azure 应用服务】如何为Web Jobs 安装Python包呢?
问题描述 WebJobs 怎么安装Python包? 问题解答 第一步:登录到App Service的高级管理工具(Kudu:https://<webappname>.scm.chinacl ...
- Nebula Graph 在大规模数据量级下的实践和定制化开发
本文作者系微信技术专家李本利 图数据在社交推荐.多跳实时计算.风控和安全等领域有可期待的前景.如何用图数据库高效存储和查询大规模异构图数据,是一个重大挑战.本文描述了开源分布式图数据库 Nebula ...
- PHP项目&RCE安全&调试&追踪&代码执行&命令执行
常见漏洞关键字 SQL注入:select.insert.update.mysql_query.mysqli等 文件上传:$_FILES.type="file".上传.move_up ...
- Java 常用类 JDK 8 之前日期和时间的API测试
1 package com.bytezero.stringclass; 2 3 import org.junit.Test; 4 5 import java.util.Date; 6 7 8 /** ...
- GDB调试入门笔记
目录 What? Why How 安装GDB 安装命令 查看是否安装成功 调试简单的程序 预备一个程序 调试 使用 break info list next print step 一些小技巧 在gdb ...
- vscode 快速切换窗口 快捷键 设置成 Alt + Q 了
vscode 切换窗口 快捷键 设置成 Alt + Q 了 又换了 换成 快速切换窗口了 quickSwitchWindow 这样方便了 我再感受下一
- KeyCastOW win10 屏幕显示按键 - 屏幕录像用
KeyCastOW win10 屏幕显示按键 - 屏幕录像用 https://gitee.com/itas109/KeyCastOW/releases/v2.0.2.5-cn
- JDK1.8版本java字符串常量池里存的是String对象还是引用?
转载自http://t.csdn.cn/iD9LD 先下结论:对象! 众所周知,JDK1.8版本中,String常量池已经从方法区中的运行时常量池分离到堆中了,那么在堆中的String常量池里存的是S ...