Kubernetes监控手册04-监控Kube-Proxy
简介
首先,请阅读文章《Kubernetes监控手册01-体系介绍》,回顾一下 Kubernetes 架构,Kube-Proxy 是在所有工作负载节点上的。
Kube-Proxy 默认暴露两个端口,10249用于暴露监控指标,在 /metrics 接口吐出 Prometheus 协议的监控数据:
[root@tt-fc-dev01.nj lib]# curl -s http://localhost:10249/metrics | head -n 10

# HELP apiserver_audit_event_total [ALPHA] Counter of audit events generated and sent to the audit backend.

# TYPE apiserver_audit_event_total counter

apiserver_audit_event_total 0

# HELP apiserver_audit_requests_rejected_total [ALPHA] Counter of apiserver requests rejected due to an error in audit logging backend.

# TYPE apiserver_audit_requests_rejected_total counter

apiserver_audit_requests_rejected_total 0

# HELP go_gc_duration_seconds A summary of the pause duration of garbage collection cycles.

# TYPE go_gc_duration_seconds summary

go_gc_duration_seconds{quantile="0"} 2.5307e-05

go_gc_duration_seconds{quantile="0.25"} 2.8884e-05
10256 端口作为健康检查的端口,使用 /healthz 接口做健康检查,请求之后返回两个时间信息:
[root@tt-fc-dev01.nj lib]# curl -s http://localhost:10256/healthz | jq .

{

  "lastUpdated": "2022-11-09 13:14:35.621317865 +0800 CST m=+4802354.950616250",

  "currentTime": "2022-11-09 13:14:35.621317865 +0800 CST m=+4802354.950616250"

}
所以,我们只要从 http://localhost:10249/metrics 采集监控数据即可。既然是 Prometheus 协议的数据,使用 Categraf 的 input.prometheus 来搞定即可。
Categraf prometheus 插件
配置文件在 conf/input.prometheus/prometheus.toml,把 Kube-Proxy 的地址配置进来即可:
interval = 15

[[instances]]

urls = [

     "http://localhost:10249/metrics"

]

labels = { job="kube-proxy" }
urls 字段配置 endpoint 列表,即所有提供 metrics 数据的接口,我们使用下面的命令做个测试:
[work@tt-fc-dev01.nj categraf]$ ./categraf --test --inputs prometheus | grep kubeproxy_sync_proxy_rules

2022/11/09 13:30:17 main.go:110: I! runner.binarydir: /home/work/go/src/categraf

2022/11/09 13:30:17 main.go:111: I! runner.hostname: tt-fc-dev01.nj

2022/11/09 13:30:17 main.go:112: I! runner.fd_limits: (soft=655360, hard=655360)

2022/11/09 13:30:17 main.go:113: I! runner.vm_limits: (soft=unlimited, hard=unlimited)

2022/11/09 13:30:17 config.go:33: I! tracing disabled

2022/11/09 13:30:17 provider.go:63: I! use input provider: [local]

2022/11/09 13:30:17 agent.go:87: I! agent starting

2022/11/09 13:30:17 metrics_agent.go:93: I! input: local.prometheus started

2022/11/09 13:30:17 prometheus_scrape.go:14: I! prometheus scraping disabled!

2022/11/09 13:30:17 agent.go:98: I! agent started

13:30:17 kubeproxy_sync_proxy_rules_endpoint_changes_pending agent_hostname=tt-fc-dev01.nj instance=http://localhost:10249/metrics 0

13:30:17 kubeproxy_sync_proxy_rules_duration_seconds_count agent_hostname=tt-fc-dev01.nj instance=http://localhost:10249/metrics 319786

13:30:17 kubeproxy_sync_proxy_rules_duration_seconds_sum agent_hostname=tt-fc-dev01.nj instance=http://localhost:10249/metrics 17652.749911909214

13:30:17 kubeproxy_sync_proxy_rules_duration_seconds_bucket agent_hostname=tt-fc-dev01.nj instance=http://localhost:10249/metrics le=+Inf 319786

13:30:17 kubeproxy_sync_proxy_rules_duration_seconds_bucket agent_hostname=tt-fc-dev01.nj instance=http://localhost:10249/metrics le=0.001 0

13:30:17 kubeproxy_sync_proxy_rules_duration_seconds_bucket agent_hostname=tt-fc-dev01.nj instance=http://localhost:10249/metrics le=0.002 0

13:30:17 kubeproxy_sync_proxy_rules_duration_seconds_bucket agent_hostname=tt-fc-dev01.nj instance=http://localhost:10249/metrics le=0.004 0

13:30:17 kubeproxy_sync_proxy_rules_duration_seconds_bucket agent_hostname=tt-fc-dev01.nj instance=http://localhost:10249/metrics le=0.008 0

13:30:17 kubeproxy_sync_proxy_rules_duration_seconds_bucket agent_hostname=tt-fc-dev01.nj instance=http://localhost:10249/metrics le=0.016 0

13:30:17 kubeproxy_sync_proxy_rules_duration_seconds_bucket agent_hostname=tt-fc-dev01.nj instance=http://localhost:10249/metrics le=0.032 0

13:30:17 kubeproxy_sync_proxy_rules_duration_seconds_bucket agent_hostname=tt-fc-dev01.nj instance=http://localhost:10249/metrics le=0.064 274815

13:30:17 kubeproxy_sync_proxy_rules_duration_seconds_bucket agent_hostname=tt-fc-dev01.nj instance=http://localhost:10249/metrics le=0.128 316616

13:30:17 kubeproxy_sync_proxy_rules_duration_seconds_bucket agent_hostname=tt-fc-dev01.nj instance=http://localhost:10249/metrics le=0.256 319525

13:30:17 kubeproxy_sync_proxy_rules_duration_seconds_bucket agent_hostname=tt-fc-dev01.nj instance=http://localhost:10249/metrics le=0.512 319776

13:30:17 kubeproxy_sync_proxy_rules_duration_seconds_bucket agent_hostname=tt-fc-dev01.nj instance=http://localhost:10249/metrics le=1.024 319784

13:30:17 kubeproxy_sync_proxy_rules_duration_seconds_bucket agent_hostname=tt-fc-dev01.nj instance=http://localhost:10249/metrics le=2.048 319784

13:30:17 kubeproxy_sync_proxy_rules_duration_seconds_bucket agent_hostname=tt-fc-dev01.nj instance=http://localhost:10249/metrics le=4.096 319784

13:30:17 kubeproxy_sync_proxy_rules_duration_seconds_bucket agent_hostname=tt-fc-dev01.nj instance=http://localhost:10249/metrics le=8.192 319784

13:30:17 kubeproxy_sync_proxy_rules_duration_seconds_bucket agent_hostname=tt-fc-dev01.nj instance=http://localhost:10249/metrics le=16.384 319786

13:30:17 kubeproxy_sync_proxy_rules_service_changes_pending agent_hostname=tt-fc-dev01.nj instance=http://localhost:10249/metrics 0

13:30:17 kubeproxy_sync_proxy_rules_last_queued_timestamp_seconds agent_hostname=tt-fc-dev01.nj instance=http://localhost:10249/metrics 1.6668536394083393e+09

13:30:17 kubeproxy_sync_proxy_rules_iptables_restore_failures_total agent_hostname=tt-fc-dev01.nj instance=http://localhost:10249/metrics 0

13:30:17 kubeproxy_sync_proxy_rules_endpoint_changes_total agent_hostname=tt-fc-dev01.nj instance=http://localhost:10249/metrics 219139

13:30:17 kubeproxy_sync_proxy_rules_last_timestamp_seconds agent_hostname=tt-fc-dev01.nj instance=http://localhost:10249/metrics 1.6679718066295934e+09

13:30:17 kubeproxy_sync_proxy_rules_service_changes_total agent_hostname=tt-fc-dev01.nj instance=http://localhost:10249/metrics 512372
Kube-Proxy 在 Kubernetes 架构中,负责从 APIServer 同步规则,然后修改 iptables 或 ipvs 配置,同步规则相关的指标就非常关键了,这里我就 grep 了这些指标作为样例。
通过 --test 看到输出了,就说明正常采集到数据了,你有几个工作负载节点,就分别去修改 Categraf 的配置即可。当然,这样做非常直观,只是略麻烦,如果未来扩容新的 Node 节点,也要去修改 Categraf 的采集配置,把 Kube-Proxy 这个 /metrics 地址给加上,如果你是用脚本批量跑的,倒是还可以,如果是手工部署就略麻烦。我们可以把 Categraf 采集器做成 Daemonset,这样就不用担心扩容的问题了,Daemonset 会被自动调度到所有 Node 节点。
Categraf 作为 Daemonset 部署
Categraf 作为 Daemonset 运行,首先要创建一个 namespace,然后相关的 ConfigMap、Daemonset 等都归属这个 namespace。只是监控 Kube-Proxy 的话,Categraf 的配置就只需要主配置 config.toml 和 prometheus.toml,下面我们就实操演示一下。
创建 namespace
[work@tt-fc-dev01.nj categraf]$ kubectl create namespace flashcat

namespace/flashcat created

[work@tt-fc-dev01.nj categraf]$ kubectl get ns | grep flashcat

flashcat                                 Active   29s
创建 ConfigMap
ConfigMap 是用于放置 config.toml 和 prometheus.toml 的内容,我把 yaml 文件也给你准备好了,请保存为 categraf-configmap-v1.yaml
---

kind: ConfigMap

metadata:

  name: categraf-config

apiVersion: v1

data:

  config.toml: |

    [global]

    hostname = "$HOSTNAME"

    interval = 15

    providers = ["local"]

    [writer_opt]

    batch = 2000

    chan_size = 10000

    [[writers]]

    url = "http://10.206.0.16:19000/prometheus/v1/write"

    timeout = 5000

    dial_timeout = 2500

    max_idle_conns_per_host = 100

---

kind: ConfigMap

metadata:

  name: categraf-input-prometheus

apiVersion: v1

data:

  prometheus.toml: |

    [[instances]]

    urls = ["http://127.0.0.1:10249/metrics"]

    labels = { job="kube-proxy" }
上面的 10.206.0.16:19000 只是举个例子,请改成你自己的 n9e-server 的地址。当然,如果不想把监控数据推给 Nightingale 也OK,写成其他的时序库(支持 remote write 协议的接口)也可以。hostname = "$HOSTNAME" 这个配置用了 $ 符号,后面创建 Daemonset 的时候会把 HOSTNAME 这个环境变量注入,让 Categraf 自动拿到。
下面我们把 ConfigMap 创建出来:
[work@tt-fc-dev01.nj yamls]$ kubectl apply -f categraf-configmap-v1.yaml -n flashcat

configmap/categraf-config created

configmap/categraf-input-prometheus created

[work@tt-fc-dev01.nj yamls]$ kubectl get configmap -n flashcat

NAME                        DATA   AGE

categraf-config             1      19s

categraf-input-prometheus   1      19s

kube-root-ca.crt            1      22m
创建 Daemonset
配置文件准备好了,开始创建 Daemonset,注意把 HOSTNAME 环境变量注入进去,yaml 文件如下,你可以保存为 categraf-daemonset-v1.yaml:
apiVersion: apps/v1

kind: DaemonSet

metadata:

  labels:

    app: categraf-daemonset

  name: categraf-daemonset

spec:

  selector:

    matchLabels:

      app: categraf-daemonset

  template:

    metadata:

      labels:

        app: categraf-daemonset

    spec:

      containers:

      - env:

        - name: TZ

          value: Asia/Shanghai

        - name: HOSTNAME

          valueFrom:

            fieldRef:

              apiVersion: v1

              fieldPath: spec.nodeName

        - name: HOSTIP

          valueFrom:

            fieldRef:

              apiVersion: v1

              fieldPath: status.hostIP

        image: flashcatcloud/categraf:v0.2.18

        imagePullPolicy: IfNotPresent

        name: categraf

        volumeMounts:

        - mountPath: /etc/categraf/conf

          name: categraf-config

        - mountPath: /etc/categraf/conf/input.prometheus

          name: categraf-input-prometheus

      hostNetwork: true

      restartPolicy: Always

      tolerations:

      - effect: NoSchedule

        operator: Exists

      volumes:

      - configMap:

          name: categraf-config

        name: categraf-config

      - configMap:

          name: categraf-input-prometheus

        name: categraf-input-prometheus
apply 一下这个 Daemonset 文件:
[work@tt-fc-dev01.nj yamls]$ kubectl apply -f categraf-daemonset-v1.yaml -n flashcat

daemonset.apps/categraf-daemonset created

[work@tt-fc-dev01.nj yamls]$ kubectl get ds -o wide -n flashcat

NAME                 DESIRED   CURRENT   READY   UP-TO-DATE   AVAILABLE   NODE SELECTOR   AGE     CONTAINERS   IMAGES                           SELECTOR

categraf-daemonset   6         6         6       6            6           <none>          2m20s   categraf     flashcatcloud/categraf:v0.2.17   app=categraf-daemonset

[work@tt-fc-dev01.nj yamls]$ kubectl get pods -o wide -n flashcat

NAME                       READY   STATUS    RESTARTS   AGE     IP            NODE          NOMINATED NODE   READINESS GATES

categraf-daemonset-4qlt9   1/1     Running   0          2m10s   10.206.0.7    10.206.0.7    <none>           <none>

categraf-daemonset-s9bk2   1/1     Running   0          2m10s   10.206.0.11   10.206.0.11   <none>           <none>

categraf-daemonset-w77lt   1/1     Running   0          2m10s   10.206.16.3   10.206.16.3   <none>           <none>

categraf-daemonset-xgwf5   1/1     Running   0          2m10s   10.206.0.16   10.206.0.16   <none>           <none>

categraf-daemonset-z9rk5   1/1     Running   0          2m10s   10.206.16.8   10.206.16.8   <none>           <none>

categraf-daemonset-zdp8v   1/1     Running   0          2m10s   10.206.0.17   10.206.0.17   <none>           <none>
看起来一切正常,我们去 Nightingale 查一下相关监控指标,看看有了没有:
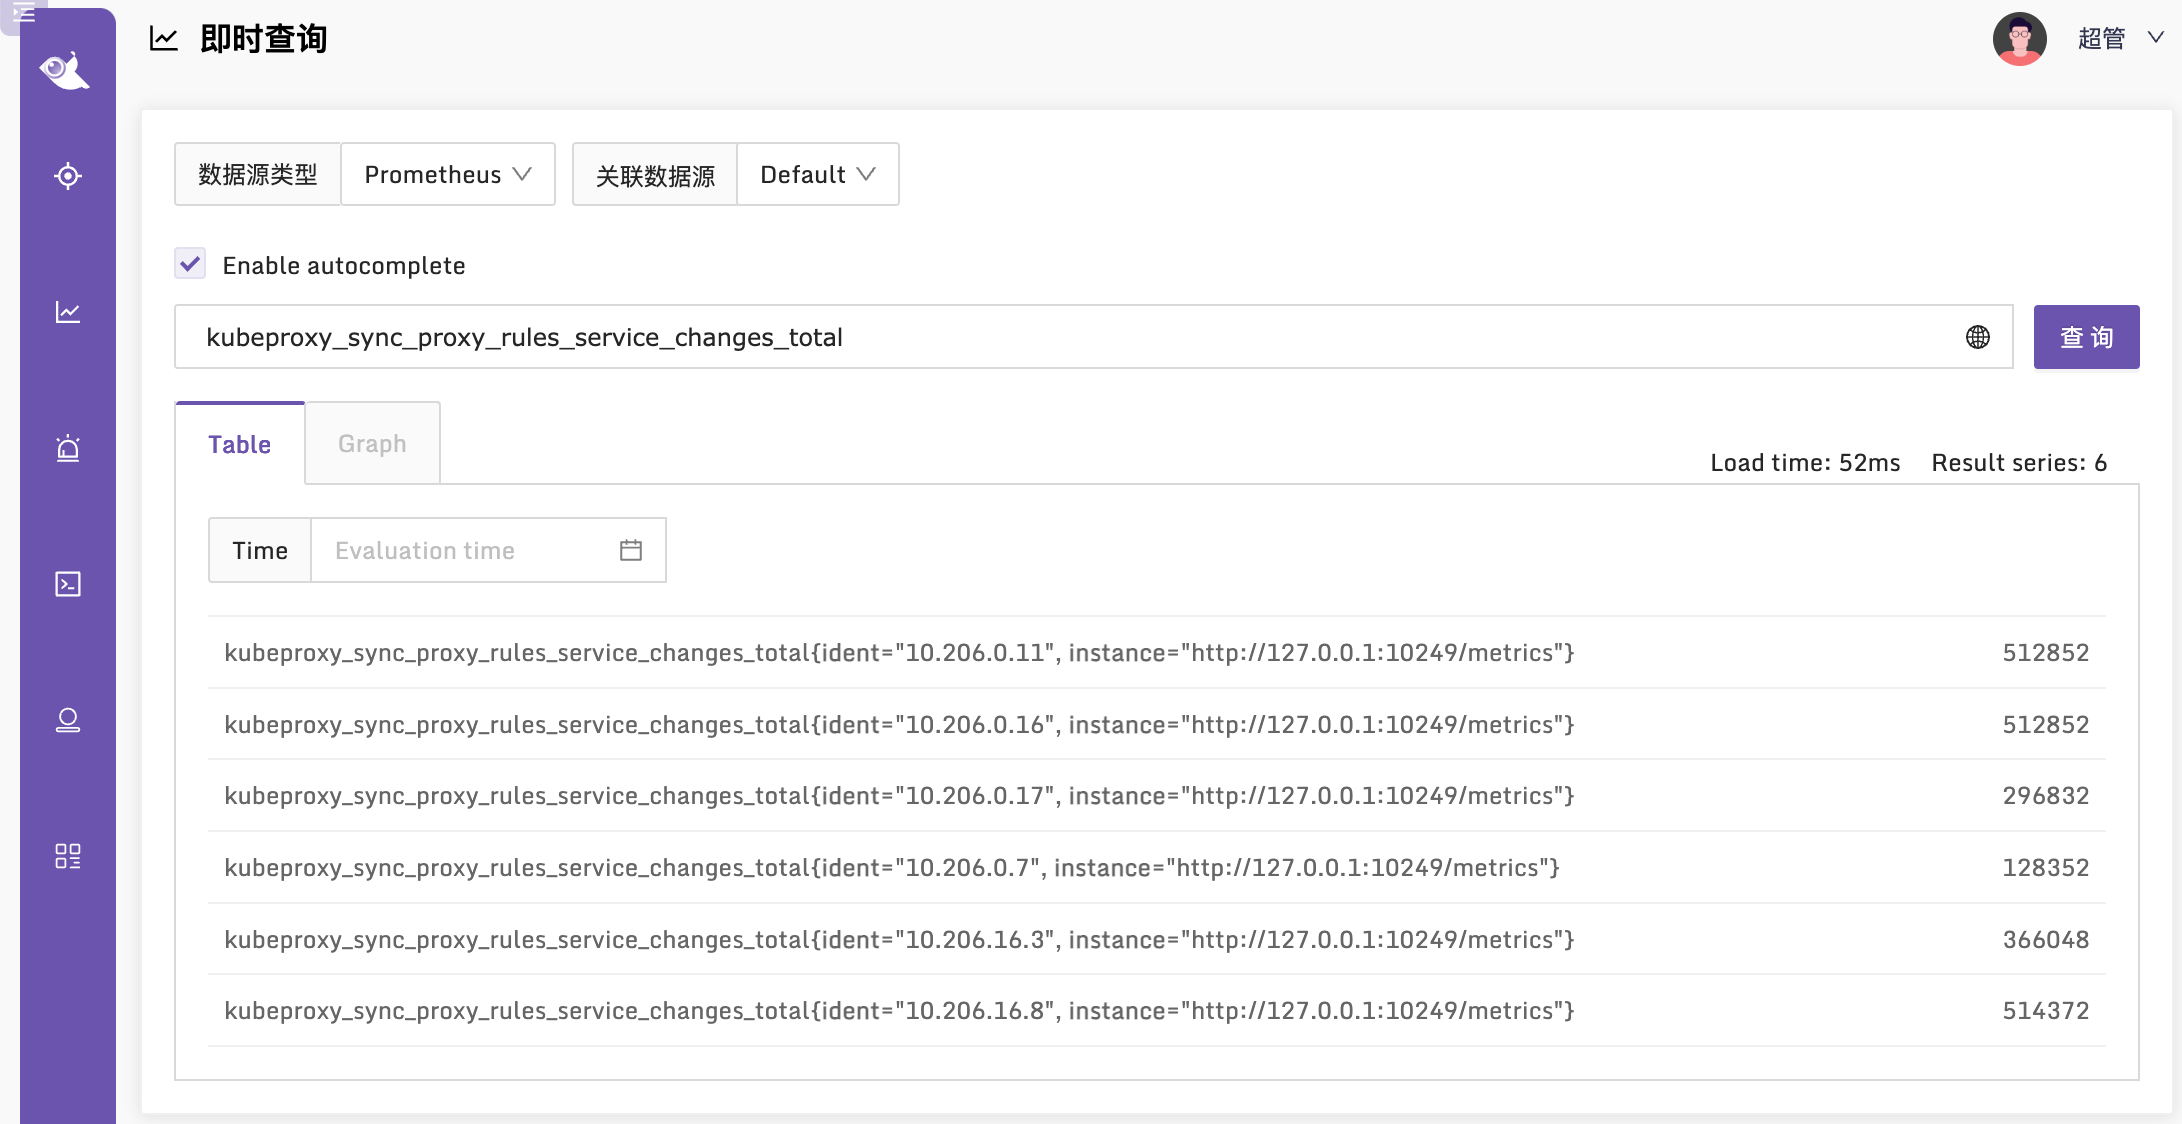
监控指标说明
Kube-Proxy 的指标,孔飞老师之前整理过,我也给挪到这个章节,供大家参考:
# HELP go_gc_duration_seconds A summary of the pause duration of garbage collection cycles.

# TYPE go_gc_duration_seconds summary

gc时间

# HELP go_goroutines Number of goroutines that currently exist.

# TYPE go_goroutines gauge

goroutine数量

# HELP go_threads Number of OS threads created.

# TYPE go_threads gauge

线程数量

# HELP kubeproxy_network_programming_duration_seconds [ALPHA] In Cluster Network Programming Latency in seconds

# TYPE kubeproxy_network_programming_duration_seconds histogram

service或者pod发生变化到kube-proxy规则同步完成时间指标含义较复杂,参照https://github.com/kubernetes/community/blob/master/sig-scalability/slos/network_programming_latency.md

# HELP kubeproxy_sync_proxy_rules_duration_seconds [ALPHA] SyncProxyRules latency in seconds

# TYPE kubeproxy_sync_proxy_rules_duration_seconds histogram

规则同步耗时

# HELP kubeproxy_sync_proxy_rules_endpoint_changes_pending [ALPHA] Pending proxy rules Endpoint changes

# TYPE kubeproxy_sync_proxy_rules_endpoint_changes_pending gauge

endpoint 发生变化后规则同步pending的次数

# HELP kubeproxy_sync_proxy_rules_endpoint_changes_total [ALPHA] Cumulative proxy rules Endpoint changes

# TYPE kubeproxy_sync_proxy_rules_endpoint_changes_total counter

endpoint 发生变化后规则同步的总次数

# HELP kubeproxy_sync_proxy_rules_iptables_restore_failures_total [ALPHA] Cumulative proxy iptables restore failures

# TYPE kubeproxy_sync_proxy_rules_iptables_restore_failures_total counter

本机上 iptables restore 失败的总次数

# HELP kubeproxy_sync_proxy_rules_last_queued_timestamp_seconds [ALPHA] The last time a sync of proxy rules was queued

# TYPE kubeproxy_sync_proxy_rules_last_queued_timestamp_seconds gauge

最近一次规则同步的请求时间戳,如果比下一个指标 kubeproxy_sync_proxy_rules_last_timestamp_seconds 大很多,那说明同步 hung 住了

# HELP kubeproxy_sync_proxy_rules_last_timestamp_seconds [ALPHA] The last time proxy rules were successfully synced

# TYPE kubeproxy_sync_proxy_rules_last_timestamp_seconds gauge

最近一次规则同步的完成时间戳

# HELP kubeproxy_sync_proxy_rules_service_changes_pending [ALPHA] Pending proxy rules Service changes

# TYPE kubeproxy_sync_proxy_rules_service_changes_pending gauge

service变化引起的规则同步pending数量

# HELP kubeproxy_sync_proxy_rules_service_changes_total [ALPHA] Cumulative proxy rules Service changes

# TYPE kubeproxy_sync_proxy_rules_service_changes_total counter

service变化引起的规则同步总数

# HELP process_cpu_seconds_total Total user and system CPU time spent in seconds.

# TYPE process_cpu_seconds_total counter

利用这个指标统计cpu使用率

# HELP process_max_fds Maximum number of open file descriptors.

# TYPE process_max_fds gauge

进程可以打开的最大fd数

# HELP process_open_fds Number of open file descriptors.

# TYPE process_open_fds gauge

进程当前打开的fd数

# HELP process_resident_memory_bytes Resident memory size in bytes.

# TYPE process_resident_memory_bytes gauge

统计内存使用大小

# HELP process_start_time_seconds Start time of the process since unix epoch in seconds.

# TYPE process_start_time_seconds gauge

进程启动时间戳

# HELP rest_client_request_duration_seconds [ALPHA] Request latency in seconds. Broken down by verb and URL.

# TYPE rest_client_request_duration_seconds histogram

请求 apiserver 的耗时(按照url和verb统计)

# HELP rest_client_requests_total [ALPHA] Number of HTTP requests, partitioned by status code, method, and host.

# TYPE rest_client_requests_total counter

请求 apiserver 的总数(按照code method host统计)
导入监控大盘
由于上面给出的监控方案是通过 Daemonset,所以各个 Kube-Proxy 的监控数据,是通过 ident 标签来区分的,并非是通过 instance 标签来区分,从 Grafana 官网找到一个分享,地址在 这里,改造之后的大盘在 这里 导入夜莺即可使用。
相关文章
关于作者
本文作者秦晓辉,快猫星云合伙人,文章内容是快猫技术团队共同沉淀的结晶,作者做了编辑整理,我们会持续输出监控、稳定性保障相关的技术文章,文章可转载,转载请注明出处,尊重技术人员的成果。
Kubernetes监控手册04-监控Kube-Proxy的更多相关文章
- Kubernetes监控手册-01体系概述
Kubernetes 监控体系驳杂,涉及到的内容非常多,总是感觉摸不到头绪,网上虽然有很多资料,都略显凌乱,没有一个体系化的讲解,今天开始,我们准备撰写一系列文章,把 Kubernetes 监控说透, ...
- 高可用Kubernetes集群-14. 部署Kubernetes集群性能监控平台
参考文档: Github介绍:https://github.com/kubernetes/heapster Github yaml文件: https://github.com/kubernetes/h ...
- (转)实验文档4:kubernetes集群的监控和日志分析
改造dubbo-demo-web项目为Tomcat启动项目 Tomcat官网 准备Tomcat的镜像底包 准备tomcat二进制包 运维主机HDSS7-200.host.com上:Tomcat8下载链 ...
- Kubernetes集群的监控报警策略最佳实践
版权声明:本文为博主原创文章,未经博主同意不得转载. https://blog.csdn.net/M2l0ZgSsVc7r69eFdTj/article/details/79652064 本文为Kub ...
- Prometheus 监控K8S Node监控
Prometheus 监控K8S Node监控 Prometheus社区提供的NodeExporter项目可以对主机的关键度量指标进行监控,通过Kubernetes的DeamonSet可以在各个主机节 ...
- 【干货】解密监控宝Docker监控实现原理
分享人高驰涛(Neeke),云智慧高级架构师,PHP 开发组成员,同时也是 PECL/SeasLog 的作者.8 年研发管理经验,早期从事大规模企业信息化研发架构,09 年涉足互联网数字营销领域并深入 ...
- nagios监控linux主机监控内存脚本
说明 工作包括两部分监控端(一二三)和被监控端(四) 一.nrpe.cfg中添加脚本 nrpe.cfg中添加命令索引 command[check_used_mem]=/usr/local/nagios ...
- 探索Windows Azure 监控和自动伸缩系列2 - 获取虚拟机的监控定义和监控数据
上一篇博文介绍了如何连接Windows Azure: http://www.cnblogs.com/teld/p/5113063.html 本篇我们继续上次的示例代码,获取虚拟机的监控定义和监控数据. ...
- 指导手册04:运行MapReduce
指导手册04:运行MapReduce Part 1:运行单个MapReduce任务 情景描述: 本次任务要求对HDFS目录中的数据文件/user/root/email_log.txt进行计算处理, ...
- [博客迁移]探索Windows Azure 监控和自动伸缩系列2 - 获取虚拟机的监控定义和监控数据
上一篇博文介绍了如何连接Windows Azure: http://www.cnblogs.com/teld/p/5113063.html 本篇我们继续上次的示例代码,获取虚拟机的监控定义和监控数据. ...
随机推荐
- 迁移 Nacos 和 ZooKeeper,有了新工具
简介: 注册中心迁移在行业中主要有两个方案,一个是双注册双订阅模式(类似数据库双写),一个是 Sync 模式(类似于数据库 DTS):MSE 同时支持了两种模式,对于开通 MSE 服务治理客户,MSE ...
- 使用MaxCompute LOAD命令批量导入OSS数据最佳实践—STS方式LOAD开启KMS加密OSS数据
简介: MaxCompute使用load overwrite或load into命令将外部存储的数据(如:oss)导入到MaxCompute前的授权操作. MaxCompute使用load overw ...
- 实用的 Bash 快捷键
前端也有需要运维的时候,这时我们不可避免需要登录 Linux 服务器,并在 Bash 终端输入一些命令,当需要对输入的命令进行一些操作时,比如快速移动光标位置或快速删除字符,如果只会用方向键和退格键, ...
- C++编程英语词汇
abstract抽象的 abstraction抽象性.抽象件 access访问 access level访问级别 access function访问函数 adapter适配器 address地址 ad ...
- maven的环境配置
将maven压缩包解压到一个空文件夹中.比如:D盘中的maven文件夹(D:\maven\apache-maven-3.6.3) 注意:路径中不要包含中文.空格.数字等字符 2.新建变量名: MAVE ...
- JWT 构建Rails API 授权登录
目录 安装jwt组件 创建base_controller.rb控制器 配置路由 用户登陆-api接口 验证用户token信息-api接口(*) 参考下面的连接 使用Rails构建JSON-API ht ...
- three.js案例-web3d三维地图大屏炫酷3D地图下钻地图-附源码
炫酷3D地图效果如下: 代码注释非常详细: create() { // 添加雾,随着距离线性增大,只能看到一个小是视野范围内的场景,地图缩小很多东西就会看不清 //this.scene.fog = n ...
- 4G EPS 中的 User Plane
目录 文章目录 目录 前文列表 用户平面 EPS UP 中的 GTP-U F-TEID 的组成 UE IP 数据包在 GTP-U Tunnel 上的封装流程 GTP-U 与 EPS Bearer MM ...
- LLM实战:LLM微调加速神器-Unsloth + Qwen1.5
1. 背景 上一篇介绍了基于训练加速框架Unsloth,微调训练Llama3的显卡资源占用及训练时间对比. 近期Unsloth新增了Qwen1.5的模型适配,因此本qiang~马不停蹄地又进行了一次实 ...
- java学习之旅(day.20)
注解和反射 注释comment:给人看 注解annotation:不仅可以给人看,还能给程序看,甚至能被其他程序读取 注解入门 什么是注解 注解的作用: 不是程序本身,可以对程序作出解释(这一点和注释 ...