fit in gnuplot
Table of Contents
1 fit-gnuplot
syntax
>> fit [xrange][yrange] function 'datafile' using modifier via paprameterfile
example:
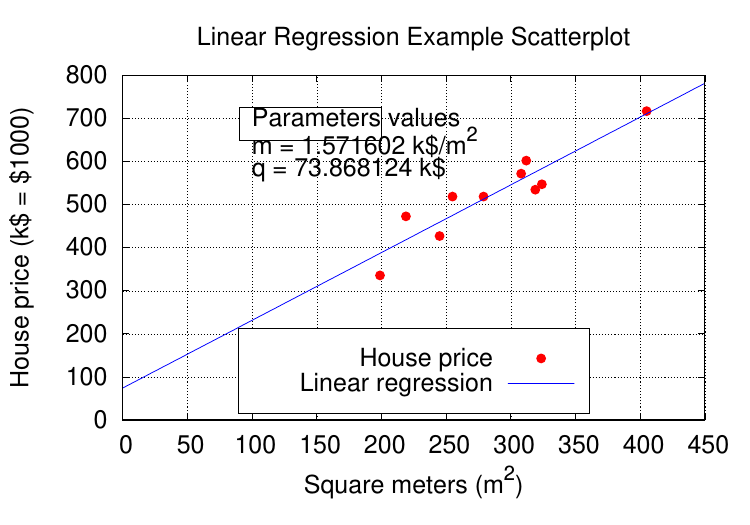
input: house_price.dat
###	'house_price.dat'

##	X-Axis:	House	price	(in	$1000)	-	Y-Axis:	Square	meters	(m^2)

245	426.72

312	601.68

279	518.16

308	571.5

199	335.28

219	472.44

405	716.28

324	546.76

319	534.34

255	518.16
gnuplot> # m, q will be our fitting parameters

gnuplot> f(x) = m*x + q

gnuplot> fit f(x) 'house_price.dat' using 1:2 via m, q

iter      chisq       delta/lim  lambda   m             q

   0 5.8376960560e+05   0.00e+00  2.07e+02    1.000000e+00   1.000000e+00

   1 1.6488461223e+04  -3.44e+06  2.07e+01    1.777346e+00   1.003262e+00

   2 1.5195558950e+04  -8.51e+03  2.07e+00    1.815976e+00   1.068562e+00

   3 1.4876544660e+04  -2.14e+03  2.07e-01    1.795915e+00   7.050054e+00

   4 1.3188280257e+04  -1.28e+04  2.07e-02    1.594141e+00   6.715403e+01

   5 1.3171060201e+04  -1.31e+02  2.07e-03    1.571627e+00   7.386063e+01

   6 1.3171060179e+04  -1.63e-04  2.07e-04    1.571602e+00   7.386812e+01

iter      chisq       delta/lim  lambda   m             q

After 6 iterations the fit converged.

final sum of squares of residuals : 13171.1

rel. change during last iteration : -1.62785e-09

degrees of freedom    (FIT_NDF)                        : 8

rms of residuals      (FIT_STDFIT) = sqrt(WSSR/ndf)    : 40.5756

variance of residuals (reduced chisquare) = WSSR/ndf   : 1646.38

Final set of parameters            Asymptotic Standard Error

=======================            ==========================

m               = 1.5716           +/- 0.2247       (14.3%)

q               = 73.8681          +/- 65.65        (88.87%)

correlation matrix of the fit parameters:

                m      q

m               1.000

q              -0.981  1.000
To save m, and q values in a string and plotting
set terminal postscript eps font 24

set out 'house_price_fit.eps'

mq_value = sprintf("Parameters values\nm = %f k$/m^2\nq = %f k$", m, q)

# \n -->> next line

set  title 'Linear Regression Example Scatterplot'

set  ylabel 'House price (k$ = $1000)'

set  xlabel 'Square meters (m^2)'

set  style line 1 ps 1.5 pt 7 lc 'red'

set  style line 2 lw 1.5 lc 'blue'

set grid

set key bottom center box height 1.4

set xrange [0:450]

set yrange [0:]

set object 1 rect from 90,725 to 200, 650 fc rgb "white"

set label 1 at 100,700 mq_value

print 'house_price.dat' ls 1 title 'House price', f(x) ls 2 title 'Linear regression'

set out
figures/gnuplot/fit/house_price_fit.pdf
fit in gnuplot的更多相关文章
- k fit in Park Model
software: Gnuplot input: area_averaged_axial_mean_velocity_TI_1.txt # One Rotor, front, eldad blade ...
- gnuplot: 一种更为简洁的曲线,柱状图绘图软件
gnuplot: 一种更为简洁的曲线,柱状图绘图软件 gnuplot: 一种更为简洁的曲线,柱状图绘图软件 Zhong Xiewei Wed Jun 25 gnuplot简单介绍 关于gnuplot的 ...
- u-boot FIT image介绍_转自“蜗窝科技”
转自:http://www.wowotech.net/u-boot/fit_image_overview.html 1. 前言 Linux kernel在ARM架构中引入设备树device tree( ...
- gnuplot使用,操作,保存等教程
gnuplot绘制图像并保存 对于在Linux下工作的人,如果你经常要画一些二维图和简单的三维图的话,那么,gnuplot无疑是一个非常好的选择,不仅图形漂亮,而且操作简单.当然如果需要质量更高的三维 ...
- gnuplot安装的小问题
今天在学习NS2的过程中接触到了awk和gnuplot来分析延迟,丢包等情况. gnuplot是一款非常精巧的绘图工具,使用方法也很简单,功能却很强大. 安装还是通过终端: sudo apt-get ...
- Modified Least Square Method and Ransan Method to Fit Circle from Data
In OpenCv, it only provide the function fitEllipse to fit Ellipse, but doesn't provide function to f ...
- gnuplot 的安装
需要同时安装gnuplot和gnuplot-x11才能画出图 sudo apt-get install gnuplot gnuplot-x11 gnuplot not showing the grap ...
- gnuplot conditional plotting: plot col A:col B if col C == x
http://stackoverflow.com/questions/6564561/gnuplot-conditional-plotting-plot-col-acol-b-if-col-c-x H ...
- gnuplot配置HOME目录
http://blog.csdn.net/jspenliany/article/details/39828261 本人使用gnuplot绘图,使用console version的来进行处理的时候,经常 ...
随机推荐
- memcached原理及介绍
memcached是一种缓存技术,在存储在内存中(高性能分布式内存缓存服务器).目的 : 提速.(传统的都是把数据保存在关系型数据库管理系统既RDBMS,客户端请求时会从RDBS中读取数据并在浏览器中 ...
- hdu 3172 Virtual Friends (字符串的并查集)
一开始一直wa,因为第一个数字t也是多组输入. 然后一直超时,因为我用的是C++里面的cin,所以非常耗时,几乎比scanf慢了10倍,但是加上了一个语句后: std::ios::sync_with_ ...
- C++伪函数
#include <iostream> void say_hello() { std::cout << "hello world !" << s ...
- JS判断字符串长度(英文占1个字符,中文汉字占2个字符)
//计算字符串长度(英文占1个字符,中文汉字占2个字符) 方法一: String.prototype.gblen = function() { var len = 0; for (var i=0; i ...
- nginx用户统计
1 概念 PV:页面访问量,即PageView,用户每次对网站的访问均被记录,用户对同一页面的多次访问,访问量累计. UV:独立访问用户数:即UniqueVisitor,访问网站的一台电脑客户端为一个 ...
- Asp.net WebApi 异常处理解决方案
一.使用异常筛选器捕获所有异常 我们知道,一般情况下,WebApi作为服务使用,每次客户端发送http请求到我们的WebApi服务里面,服务端得到结果输出response到客户端.这个过程中,一旦服务 ...
- _bzoj1029 [JSOI2007]建筑抢修【贪心 堆】
传送门:http://www.lydsy.com/JudgeOnline/problem.php?id=1029 经典的贪心问题,不解释. #include <cstdio> #inclu ...
- matplotlib 绘图实例01:正弦余弦曲线
该讲的实例结果如下图所示: 第01步:导入模块,并设置显示中文和负号的属性: import matplotlib.pyplot as plt import numpy as np plt.rcPara ...
- and or类比c中的 bool?a :b
a = "heaven" b = "hell" c = True and a or b print c d = False and a or b ...
- 480 Sliding Window Median 滑动窗口中位数
详见:https://leetcode.com/problems/sliding-window-median/description/ C++: class Solution { public: ve ...