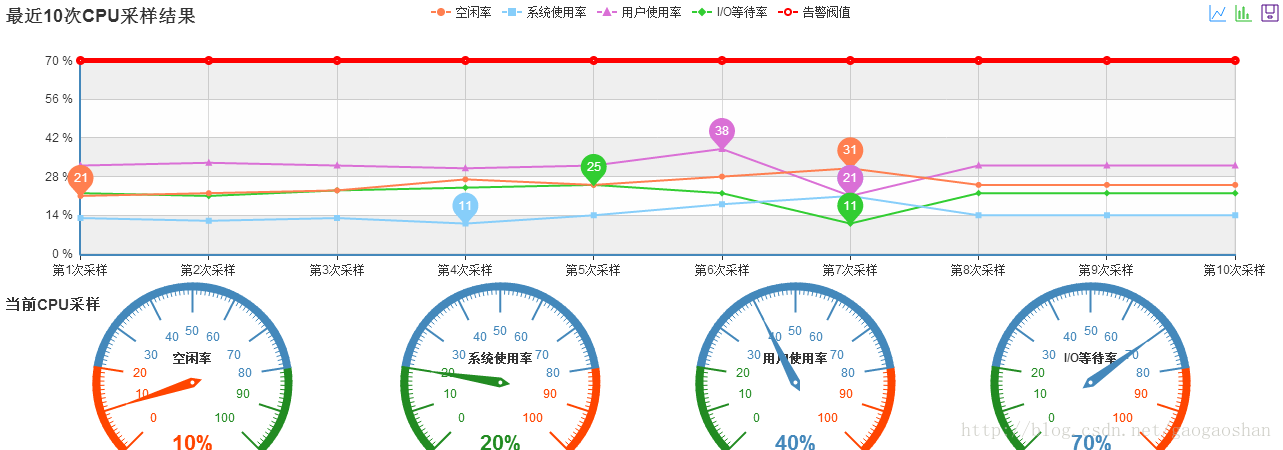
Echarts CPU监控 (折线仪表盘,图例混搭)
https://blog.csdn.net/mengxiangfeiyang/article/details/44802939
CPU page
<script type="text/javascript" >
var myChart;
var eCharts;
var cpu_r = 100;
var cpu_y= '85%';
var cpu_title = '-25%';
var cpu_detail =21;
require([ 'echarts', 'echarts/chart/line' //按需加载图表关于线性图、折线图的部分
], DrawEChart //异步加载的回调函数绘制图表
);
//创建ECharts图表方法
function DrawEChart(ec) {
eCharts = ec;
myChart = eCharts.init(document.getElementById('main'));
myChart.showLoading({
text : "图表数据正在努力加载...",
effect :'whirling',//'spin' | 'bar' | 'ring' | 'whirling' | 'dynamicLine' | 'bubble'
textStyle : {
fontSize : 20
}
});
//定义图表options
var options = {
backgroundColor: 'white',
title : {
text : "最近10次CPU采样结果",
itemGap :270,
subtext : "当前CPU采样",
subtextStyle :{
fontSize: 15, fontWeight: 'bolder', color: '#333'
},
sublink : "http://www.baidu.com"
},
tooltip : {
trigger : 'axis'
},
legend : {
data : [ "空闲率","系统使用率","用户使用率","I/O等待率","告警阀值" ]
},
toolbox : {
show : true,
feature : {
//mark : {show : true},
//dataView : {show : true,readOnly : false},
magicType : {
show : true,type : [ 'line', 'bar' ]
},
//restore : {show : true},
saveAsImage : {
show : true
}
}
},
calculable : true,
xAxis : [ {
type : 'category',
boundaryGap : false,
data : [ '第1次采样', '第2次采样', '第3次采样', '第4次采样', '第5次采样', '第6次采样', '第7次采样', '第8次采样', '第9次采样', '第10次采样' ]
} ],
yAxis : [ {
type : 'value',
axisLabel : {
formatter : '{value} %'
},
splitArea : {
show : true
}
} ],
grid : {
width : '90%' , //直角坐标轴占整页的百分比
height : '43%'
},
series : [
{
name : '空闲率',
type : 'gauge',
center : [ '15%', cpu_y ],//圆心坐标,支持绝对值(px)和百分比
radius : cpu_r, //仪表盘的半径
splitNumber : 10, // 分割段数,默认为5
axisLine : { // 坐标轴线
lineStyle : { // 属性lineStyle控制线条样式
color : [ [ 0.2, '#ff4500' ],
[ 0.8, '#48b' ], [ 1, '#228b22' ] ],
width : 8
}
},
axisTick : { // 坐标轴小标记
splitNumber : 10, // 每份split细分多少段
length : 12, // 属性length控制线长
lineStyle : { // 属性lineStyle控制线条样式
color : 'auto'
}
},
axisLabel : { // 坐标轴文本标签,详见axis.axisLabel
textStyle : { // 其余属性默认使用全局文本样式,详见TEXTSTYLE
color : 'auto'
}
},
splitLine : { // 分隔线
show : true, // 默认显示,属性show控制显示与否
length : 30, // 属性length控制线长
lineStyle : { // 属性lineStyle(详见lineStyle)控制线条样式
color : 'auto'
}
},
pointer : {
width : 5
},
title : {
show : true,
offsetCenter : [ 0, cpu_title ], // x, y,单位px
textStyle : { // 其余属性默认使用全局文本样式,详见TEXTSTYLE
fontWeight : 'bolder',
fontSize : 10
}
},
detail : {
formatter : '{value}%',
textStyle : { // 其余属性默认使用全局文本样式,详见TEXTSTYLE
color : 'auto',
fontWeight : 'bolder',
fontSize : cpu_detail
}
},
data : [ {
value : 10,
name : '空闲率'
} ]
},
{
name : '系统使用率',
type : 'gauge',
center : [ '39%', cpu_y ],//圆心坐标,支持绝对值(px)和百分比
radius : cpu_r, //仪表盘的半径
splitNumber : 10, // 分割段数,默认为5
axisLine : { // 坐标轴线
lineStyle : { // 属性lineStyle控制线条样式
color : [ [ 0.2, '#228b22' ],
[ 0.8, '#48b' ], [ 1, '#ff4500' ] ],
width : 8
}
},
axisTick : { // 坐标轴小标记
splitNumber : 10, // 每份split细分多少段
length : 12, // 属性length控制线长
lineStyle : { // 属性lineStyle控制线条样式
color : 'auto'
}
},
axisLabel : { // 坐标轴文本标签,详见axis.axisLabel
textStyle : { // 其余属性默认使用全局文本样式,详见TEXTSTYLE
color : 'auto'
}
},
splitLine : { // 分隔线
show : true, // 默认显示,属性show控制显示与否
length : 30, // 属性length控制线长
lineStyle : { // 属性lineStyle(详见lineStyle)控制线条样式
color : 'auto'
}
},
pointer : {
width : 5
},
title : {
show : true,
offsetCenter : [ 0, cpu_title ], // x, y,单位px
textStyle : { // 其余属性默认使用全局文本样式,详见TEXTSTYLE
fontWeight : 'bolder',
fontSize : 10
}
},
detail : {
formatter : '{value}%',
textStyle : { // 其余属性默认使用全局文本样式,详见TEXTSTYLE
color : 'auto',
fontWeight : 'bolder',
fontSize : cpu_detail
}
},
data : [ {
value : 20,
name : '系统使用率'
} ]
},
{
name : '用户使用率',
type : 'gauge',
center : [ '62%', cpu_y ],//圆心坐标,支持绝对值(px)和百分比
radius : cpu_r, //仪表盘的半径
splitNumber : 10, // 分割段数,默认为5
axisLine : { // 坐标轴线
lineStyle : { // 属性lineStyle控制线条样式
color : [ [ 0.2, '#228b22' ],
[ 0.8, '#48b' ], [ 1, '#ff4500' ] ],
width : 8
}
},
axisTick : { // 坐标轴小标记
splitNumber : 10, // 每份split细分多少段
length : 12, // 属性length控制线长
lineStyle : { // 属性lineStyle控制线条样式
color : 'auto'
}
},
axisLabel : { // 坐标轴文本标签,详见axis.axisLabel
textStyle : { // 其余属性默认使用全局文本样式,详见TEXTSTYLE
color : 'auto'
}
},
splitLine : { // 分隔线
show : true, // 默认显示,属性show控制显示与否
length : 30, // 属性length控制线长
lineStyle : { // 属性lineStyle(详见lineStyle)控制线条样式
color : 'auto'
}
},
pointer : {
width : 5
},
title : {
show : true,
offsetCenter : [ 0, cpu_title ], // x, y,单位px
textStyle : { // 其余属性默认使用全局文本样式,详见TEXTSTYLE
fontWeight : 'bolder',
fontSize : 10
}
},
detail : {
formatter : '{value}%',
textStyle : { // 其余属性默认使用全局文本样式,详见TEXTSTYLE
color : 'auto',
fontWeight : 'bolder',
fontSize : cpu_detail
}
},
data : [ {
value : 40,
name : '用户使用率'
} ]
},
{
name : 'IO等待率',
type : 'gauge',
center : [ '85%', cpu_y ],//圆心坐标,支持绝对值(px)和百分比
radius : cpu_r, //仪表盘的半径
splitNumber : 10, // 分割段数,默认为5
axisLine : { // 坐标轴线
lineStyle : { // 属性lineStyle控制线条样式
color : [ [ 0.2, '#228b22' ],
[ 0.8, '#48b' ], [ 1, '#ff4500' ] ],
width : 8
}
},
axisTick : { // 坐标轴小标记
splitNumber : 10, // 每份split细分多少段
length : 12, // 属性length控制线长
lineStyle : { // 属性lineStyle控制线条样式
color : 'auto'
}
},
axisLabel : { // 坐标轴文本标签,详见axis.axisLabel
textStyle : { // 其余属性默认使用全局文本样式,详见TEXTSTYLE
color : 'auto',
//fontSize : 12
}
},
splitLine : { // 分隔线
show : true, // 默认显示,属性show控制显示与否
length : 30, // 属性length控制线长
lineStyle : { // 属性lineStyle(详见lineStyle)控制线条样式
color : 'auto'
}
},
pointer : {
width : 5
},
title : {
show : true,
offsetCenter : [ 0, cpu_title ], // x, y,单位px
textStyle : { // 其余属性默认使用全局文本样式,详见TEXTSTYLE
fontWeight : 'bolder',
fontSize : 10
}
},
detail : {
formatter : '{value}%',
textStyle : { // 其余属性默认使用全局文本样式,详见TEXTSTYLE
color : 'auto',
fontWeight : 'bolder',
fontSize : cpu_detail
}
},
data : [ {
value : 70,
name : 'I/O等待率'
} ]
},
//============================================================================================================
{
name : '空闲率',
type : 'line',
data : [ 21, 22, 23, 27, 25, 28, 31 ,25, 25, 25],//必须是Integer类型的,String计算平均值会出错
markPoint : {
data : [ {
type : 'max',
name : '最大值'
}, {
type : 'min',
name : '最小值'
} ]
},
//markLine : {
//data : [ {
// type : 'average',
// name : '平均值'
//} ]
//}
} ,
{
name : '系统使用率',
type : 'line',
data : [ 13, 12, 13, 11, 14, 18, 21 , 14, 14, 14 ],//必须是Integer类型的,String计算平均值会出错
markPoint : {
data : [ {
type : 'max',
name : '最大值'
}, {
type : 'min',
name : '最小值'
} ]
}
} ,
{
name : '用户使用率',
type : 'line',
data : [ 32, 33, 32, 31, 32, 38, 21 , 32, 32, 32 ],//必须是Integer类型的,String计算平均值会出错
markPoint : {
data : [ {
type : 'max',
name : '最大值'
}, {
type : 'min',
name : '最小值'
} ]
}
} ,
{
name : 'I/O等待率',
type : 'line',
data : [ 22, 21, 23, 24, 25, 22, 11, 22, 22, 22 ],//必须是Integer类型的,String计算平均值会出错
markPoint : {
data : [ {
type : 'max',
name : '最大值'
}, {
type : 'min',
name : '最小值'
} ]
}
} ,
{
name : '告警阀值',
type : 'line',
itemStyle: {
normal: {
color: 'red',
lineStyle: {width: 5}
}
},
data : [ 70, 70, 70, 70,70, 70, 70, 70,70, 70 ]//必须是Integer类型的,String计算平均值会出错
}
]
};
//clearTimeout(loadingTicket);
//loadingTicket = setTimeout(function (){
myChart.setOption(options);
myChart.hideLoading();
//},100);
//myChart.setOption(options); //先把可选项注入myChart中
//myChart.hideLoading();
//getChartData();
}
</script>
<script type="text/javascript">
function getChartData() {
//获得图表的options对象
var options = myChart.getOption();
//通过Ajax获取数据
$.ajax({
type : "post",
async : false, //同步执行
url : "${pageContext.request.contextPath}/echarts/line_data",
data : {},
dataType : "json", //返回数据形式为json
success : function(result) {
if (result) {
options.legend.data = result.legend;
options.xAxis[0].data = result.category;
options.series[0].data = result.series[0].data;
myChart.hideLoading();
myChart.setOption(options);
}
},
error : function(errorMsg) {
alert("不好意思,大爷,图表请求数据失败啦!");
myChart.hideLoading();
}
});
}
</script>
- 1
- 2
- 3
- 4
- 5
- 6
- 7
- 8
- 9
- 10
- 11
- 12
- 13
- 14
- 15
- 16
- 17
- 18
- 19
- 20
- 21
- 22
- 23
- 24
- 25
- 26
- 27
- 28
- 29
- 30
- 31
- 32
- 33
- 34
- 35
- 36
- 37
- 38
- 39
- 40
- 41
- 42
- 43
- 44
- 45
- 46
- 47
- 48
- 49
- 50
- 51
- 52
- 53
- 54
- 55
- 56
- 57
- 58
- 59
- 60
- 61
- 62
- 63
- 64
- 65
- 66
- 67
- 68
- 69
- 70
- 71
- 72
- 73
- 74
- 75
- 76
- 77
- 78
- 79
- 80
- 81
- 82
- 83
- 84
- 85
- 86
- 87
- 88
- 89
- 90
- 91
- 92
- 93
- 94
- 95
- 96
- 97
- 98
- 99
- 100
- 101
- 102
- 103
- 104
- 105
- 106
- 107
- 108
- 109
- 110
- 111
- 112
- 113
- 114
- 115
- 116
- 117
- 118
- 119
- 120
- 121
- 122
- 123
- 124
- 125
- 126
- 127
- 128
- 129
- 130
- 131
- 132
- 133
- 134
- 135
- 136
- 137
- 138
- 139
- 140
- 141
- 142
- 143
- 144
- 145
- 146
- 147
- 148
- 149
- 150
- 151
- 152
- 153
- 154
- 155
- 156
- 157
- 158
- 159
- 160
- 161
- 162
- 163
- 164
- 165
- 166
- 167
- 168
- 169
- 170
- 171
- 172
- 173
- 174
- 175
- 176
- 177
- 178
- 179
- 180
- 181
- 182
- 183
- 184
- 185
- 186
- 187
- 188
- 189
- 190
- 191
- 192
- 193
- 194
- 195
- 196
- 197
- 198
- 199
- 200
- 201
- 202
- 203
- 204
- 205
- 206
- 207
- 208
- 209
- 210
- 211
- 212
- 213
- 214
- 215
- 216
- 217
- 218
- 219
- 220
- 221
- 222
- 223
- 224
- 225
- 226
- 227
- 228
- 229
- 230
- 231
- 232
- 233
- 234
- 235
- 236
- 237
- 238
- 239
- 240
- 241
- 242
- 243
- 244
- 245
- 246
- 247
- 248
- 249
- 250
- 251
- 252
- 253
- 254
- 255
- 256
- 257
- 258
- 259
- 260
- 261
- 262
- 263
- 264
- 265
- 266
- 267
- 268
- 269
- 270
- 271
- 272
- 273
- 274
- 275
- 276
- 277
- 278
- 279
- 280
- 281
- 282
- 283
- 284
- 285
- 286
- 287
- 288
- 289
- 290
- 291
- 292
- 293
- 294
- 295
- 296
- 297
- 298
- 299
- 300
- 301
- 302
- 303
- 304
- 305
- 306
- 307
- 308
- 309
- 310
- 311
- 312
- 313
- 314
- 315
- 316
- 317
- 318
- 319
- 320
- 321
- 322
- 323
- 324
- 325
- 326
- 327
- 328
- 329
- 330
- 331
- 332
- 333
- 334
- 335
- 336
- 337
- 338
- 339
- 340
- 341
- 342
- 343
- 344
- 345
- 346
- 347
- 348
- 349
- 350
- 351
- 352
- 353
- 354
- 355
- 356
- 357
- 358
- 359
- 360
- 361
- 362
- 363
- 364
- 365
- 366
- 367
- 368
- 369
- 370
- 371
- 372
- 373
- 374
- 375
- 376
- 377
- 378
- 379
- 380
- 381
- 382
- 383
- 384
- 385
- 386
- 387
- 388
- 389
- 390
- 391
- 392
- 393
- 394
- 395
- 396
- 397
- 398
- 399
- 400
- 401
- 402
- 403
- 404
- 405
- 406
- 407
- 408
- 409
- 410
- 411
- 412
- 413
- 414
- 415
- 416
- 417
- 418
- 419
- 420
- 421
- 422
- 423
- 424
- 425
- 426
- 427
- 428
- 429
- 430
- 431
- 432
- 433
Echarts CPU监控 (折线仪表盘,图例混搭)的更多相关文章
- echarts 拼图和折线图的封装 及常规处理
1.html <div id="wrap"></div> 2.js ; (function ($) { $.fn.extend({ echartsPie: ...
- C#实现对远程服务器的内存和CPU监控
C#实现对远程服务器的内存和CPU监控小记 1. 主要使用到的组件有System.Management.dll 2. 主要类为 :ManagementScope 连接远程服务器示例代码: priv ...
- Linux CPU监控指标
Linux CPU监控指标 Linux提供了非常丰富的命令可以进行CPU相关数据进行监控,例如:top.vmstat等命令.top是一个动态显示过程,即可以通过用户按键来不断刷新当前状态.如果在前台执 ...
- [补档][Tyvj 1518]CPU监控
[Tyvj 1518]CPU监控 题目 Bob需要一个程序来监视CPU使用率.这是一个很繁琐的过程,为了让问题更加简单,Bob会慢慢列出今天会在用计算机时做什么事. Bob会干很多事,除了跑暴力程序看 ...
- spring cloud 集群健康监控--turbine-dashboard仪表盘
这里仍然以Windows和jdk为运行环境,按照下面的步骤打包-运行-访问就能看到效果. 运维健康监控--hystrix-dashboard仪表盘 java -jar F:\jars-dashboar ...
- echarts、higncharts折线图或柱状图显示数据为0的点
echarts.higncharts折线图或柱状图只需要后端传到前端一段json数据,接送数据的x轴与y周有对应数据,折线图或柱状图就会渲染出这数据. 比如,x轴表示美每天日期,y轴表示数量.他们的数 ...
- CPU监控 解题报告
CPU监控 这种题就需要小黄鸭调试法,不行就重构,动态gdb可能会死人,一堆tag的... 维护历史最值的一个核心是历史最值tag,它的意义是从上一次这个点下放tag之后到当前时刻的这个点的tag达到 ...
- 【BZOJ3064】CPU监控(线段树)
[BZOJ3064]CPU监控(线段树) 题面 BZOJ 洛谷 题解 神仙\(zsy\)出在了\(noip\)模拟的题目.(然而\(zsy\)出的还是这题的升级版) 首先明确一点,这题是一个吉司机线段 ...
- BZOJ 3064 CPU监控
题目链接:CPU监控 学习一番线段树的历史标记- 这道题就是区间加法,区间赋值,要询问区间最大值 和 区间历史最大值的最大值. 然后这种题就是在现有标记的基础上多弄一套标记,维护这个点出现过的最大的标 ...
随机推荐
- Numpy中array数据操作
1.创建: import numpy as np arr=np.array([1,2,3]) print(arr,arr.ndim) list=[1,2,3] arr=np.array(list) 2 ...
- python爬虫之多线程、多进程、GIL锁
背景: 我们知道多线程要比多进程效率更高,因为线程存在于进程之内,打开一个进程的话,首先需要开辟内存空间,占用内存空间比线程大.这样想也不怪,比如一个进程用10MB,开10个进程就得100MB的内存空 ...
- 使用python库xlsxwriter库来输出各种xlsx文件
功能性的文章直接用几个最简单的实现表达: xlsxwriter库的核心就是其Workbook对象. 创建一个指定名字的xlsx文件: import xlsxwriter filename = '/Us ...
- list类型功能剖析
append 向后追加 name_list=["eirc","alex","tony"] name_list.append('seven' ...
- WEB相关概念、Tomcat初识、Servlet、基本知识。
/* * 一.web的概念? * 1.web就是在http协议基础之上, 利用浏览器进行访问的网站. * Web Page指网站内的网页. 我们常说的WWW(World Wide Web 万维网)就是 ...
- ABP实践学习
一.
- Vue数组更新及过滤排序
前面的话 Vue为了增加列表渲染的功能,增加了一组观察数组的方法,而且可以显示一个数组的过滤或排序的副本.本文将详细介绍Vue数组更新及过滤排序 变异方法 Vue 包含一组观察数组的变异方法,它们将会 ...
- poj-1273(最大流)
题解:纯板子题... EK算法 #include<iostream> #include<algorithm> #include<cstring> #include& ...
- luogu3702-[SDOI2017]序列计数
Description Alice想要得到一个长度为nn的序列,序列中的数都是不超过mm的正整数,而且这nn个数的和是pp的倍数. Alice还希望,这nn个数中,至少有一个数是质数. Alice想知 ...
- 洛谷 P1538 迎春舞会之数字舞蹈
题目背景 HNSDFZ的同学们为了庆祝春节,准备排练一场舞会. 题目描述 在越来越讲究合作的时代,人们注意的更多的不是个人物的舞姿,而是集体的排列. 为了配合每年的倒计时,同学们决定排出——“数字舞蹈 ...