
最新版Prometheus+Grafana+node-exporter炫酷界面
一、概述
理论知识就不多介绍了,参考链接:
https://www.cnblogs.com/xiao987334176/p/9930517.html
本文使用2台服务器,来搭建。
环境
| 操作系统 | docker版本 | ip | 容器 |
| centos 7.4 | 18.09.2 | 192.168.10.104 | Prometheus+Grafana+node-exporter |
| centos 7.4 | 18.09.2 | 192.168.10.20 | node-exporter |
二、安装
请确保2台服务器,已经安装了docker。
163 docker镜像
默认下载镜像太慢了,需要更改为163
2台服务器都修改
vim /etc/docker/daemon.json
内容如下:
{

  "registry-mirrors": ["http://hub-mirror.c.163.com"]

}
重启docker
systemctl restart docker
node-exporter
2台服务器,都执行一下。用来收集服务器数据的
docker run -d -p : \

  -v "/proc:/host/proc:ro" \

  -v "/sys:/host/sys:ro" \

  -v "/:/rootfs:ro" \

  --net="host" \

  --restart=always \

  --name node-exporter \

  prom/node-exporter
Prometheus
新建目录prometheus,编辑配置文件prometheus.yml
mkdir /opt/prometheus

cd /opt/prometheus/

vim prometheus.yml
内容如下:
global:

  scrape_interval:     60s

  evaluation_interval: 60s

scrape_configs:

  - job_name: prometheus

    static_configs:

      - targets: ['localhost:9090']

        labels:

          instance: prometheus

  - job_name: localhost

    static_configs:

      - targets: ['192.168.10.104:9100']

        labels:

          instance: localhost

  - job_name: server20

    static_configs:

      - targets: ['192.168.10.20:9100']

        labels:

          instance: server20
注意:修改IP地址
启动prometheus
docker run  -d \

  -p : \

  -v /opt/prometheus/prometheus.yml:/etc/prometheus/prometheus.yml  \

  --restart=always \

  --name prometheus \

  prom/prometheus
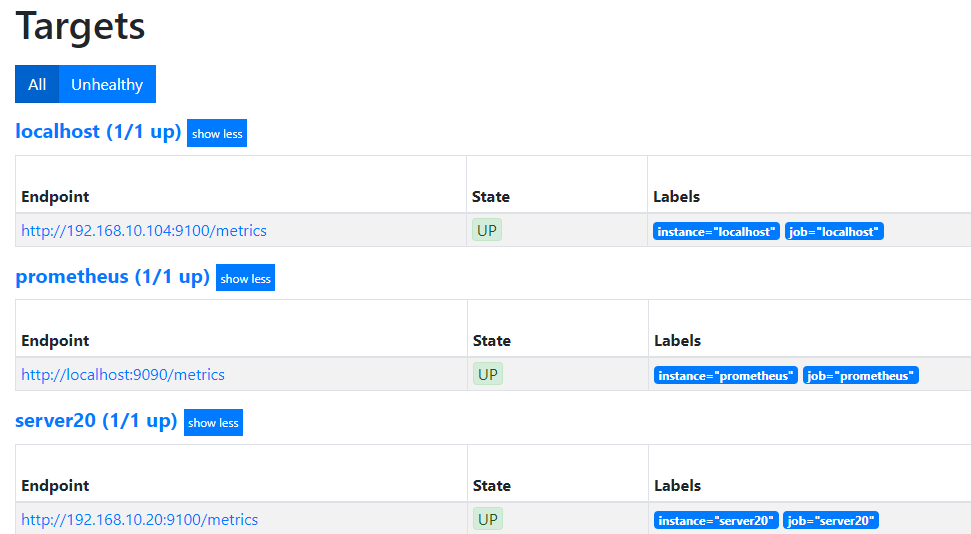
访问页面:
http://192.168.10.104:9090/targets
等待1分钟,确保是up状态
Grafana
新建空文件夹grafana-storage,用来存储数据
mkdir /opt/grafana-storage
设置权限
chmod -R /opt/grafana-storage
因为grafana用户会在这个目录写入文件,直接设置777,比较简单粗暴!
启动grafana
docker run -d \

  -p : \

  --name=grafana \

  -v /opt/grafana-storage:/var/lib/grafana \

  --restart=always \

  --name grafana \

  grafana/grafana
等待1分钟,访问url:
默认会先跳转到登录页面,默认的用户名和密码都是admin

登录之后,它会要求你重置密码。你还可以再输次admin密码!

密码设置完成之后,就会跳转到首页
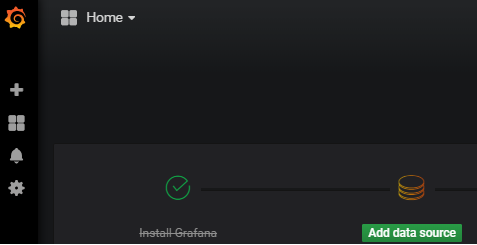
点击Add data source
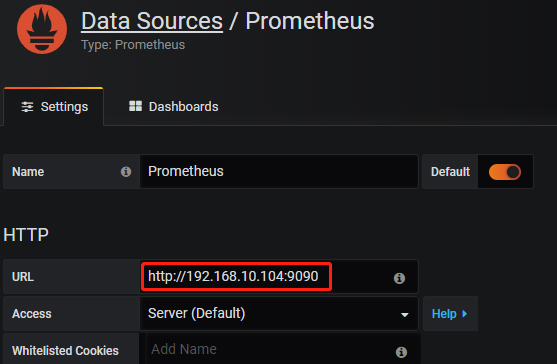
点击下面的Save & Test,如果出现绿色的,说明ok了

三、Node Exporter for Prometheus Dashboard 中文版
访问链接:
https://grafana.com/grafana/dashboards/8919/revisions
下载最新的
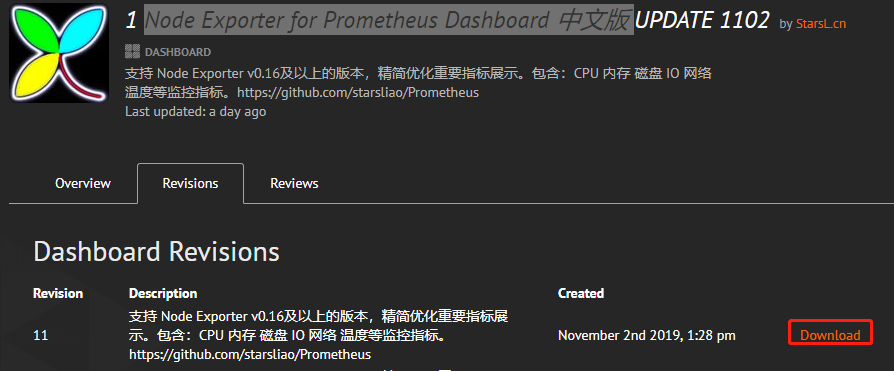
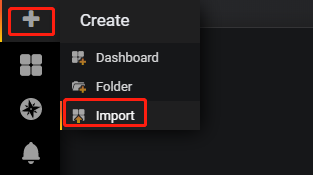
点击import
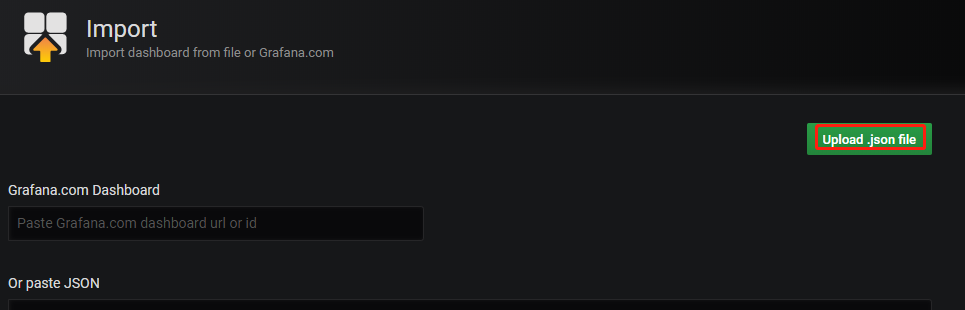
点击上传
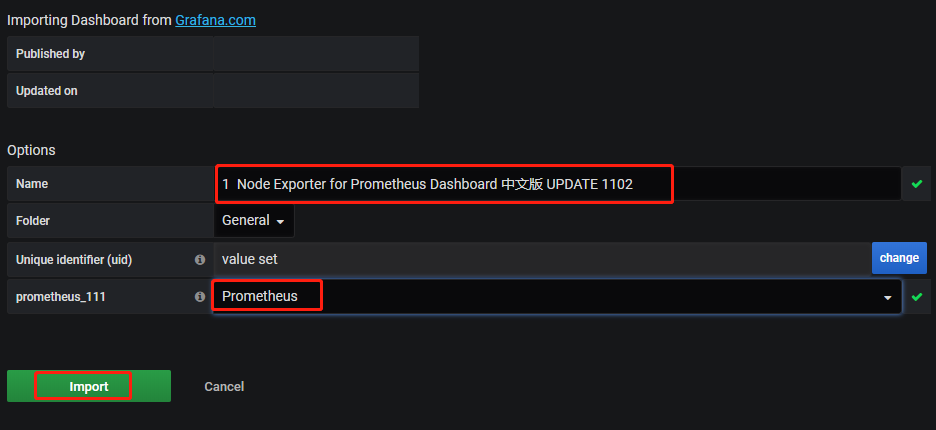
选择下载好的json文件,选择Prometheus
效果如下:

是不是,看着很炫酷啊!!!
四、session问题
刚刚我用的是谷歌浏览器访问的,没啥问题。
但是我用 edge 浏览器,访问时。输入用户名和密码之后,还依然提示更改密码。
这个时候,直接跳过即可。
但是进入之后,却发现,数据都是空的!!!
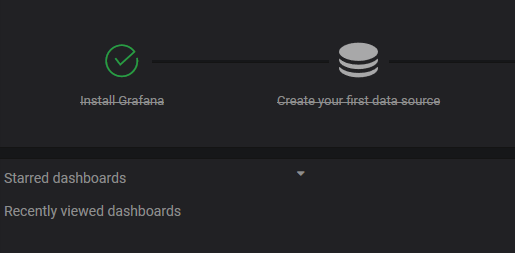
点击左侧的admin,就可以看到session列表。

因此,只需要将谷歌浏览器的配置,导入进来即可。
点击管理
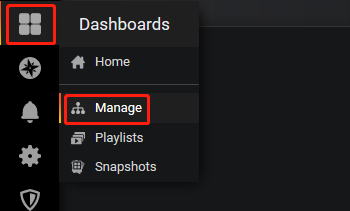
选择,点击一下
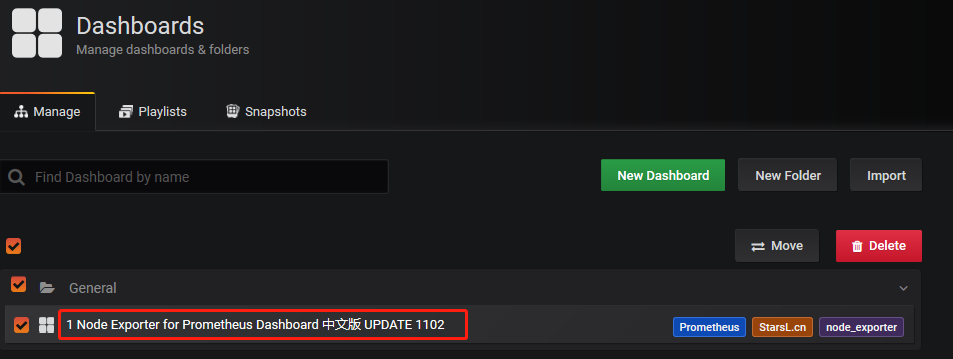
就可以看到数据了
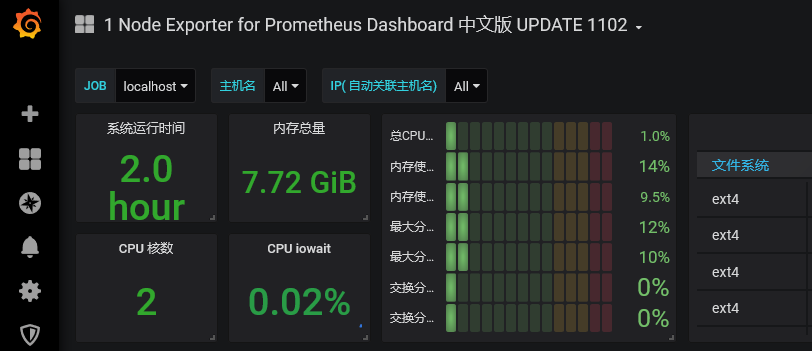
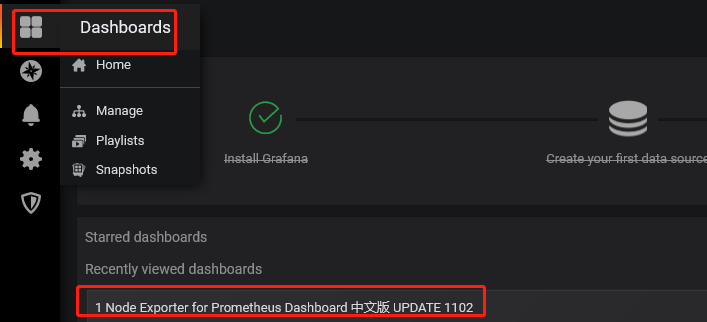
重新点击,就可以看到面板了。
最新版Prometheus+Grafana+node-exporter炫酷界面的更多相关文章
- Prometheus 集成 Node Exporter
文章首发于公众号<程序员果果> 地址:https://mp.weixin.qq.com/s/40ULB9UWbXVA21MxqnjBxw 简介 Prometheus 官方和一些第三方,已经 ...
- 容器监控告警方案(cAdvisor + nodeExporter + alertmanager + prometheus +grafana)
一.prometheus基本架构 Prometheus 是一套开源的系统监控报警框架.它启发于 Google 的 borgmon 监控系统,由工作在 SoundCloud 的 google 前员工在 ...
- Prometheus Grafana快速搭建
Prometheus Prometheus和Grafana组合基本上是监控系统的标配.Prometheus做存储后端,Grafana做分析及可视化界面. 普罗米修斯是开源的系统监控/报警工具库,功能非 ...
- kubernetes生态--交付prometheus监控及grafana炫酷dashboard到k8s集群
由于docker容器的特殊性,传统的zabbix无法对k8s集群内的docker状态进行监控,所以需要使用prometheus来进行监控: 什么是Prometheus? Prometheus是由Sou ...
- 【开源监控】Prometheus+Node Exporter+Grafana监控linux服务器
Prometheus Prometheus介绍 Prometheus新一代开源监控解决方案.github地址 Prometheus主要功能 多维 数据模型(时序由 metric 名字和 k/v 的 l ...
- Prometheus + Node Exporter + Grafana 监控主机运行信息
上一篇文章中讲了如何利用Prometheus和Grafana监控SpringBoot应用的JVM信息,这次就来看看如何监控 服务器运行状态,先列出用到的工具: Prometheus node_ex ...
- k8s集群监控 cadvisor/exporter+prometheus+grafana
### k8s监控处理 ### 1.cadvisor/exporter+prometheus+grafana 安装#### 1.1 配置nfs安装```shellubuntu: nfs 服务器 apt ...
- Prometheus 使用之 node exporter
本文使用的 Prometheus 版本为 2.22.0,node exporter 版本为 1.0.1:部署在 Linux 服务器Prometheus 是开源的监控报警系统和时序列数据库 (TSDB) ...
- Prometheus exporter的Node exporter是可以独立安装,用来测试的
现在慢慢在把prometheus operator的一些概念组织完整. https://github.com/coreos/prometheus-operator/tree/master/contri ...
随机推荐
- 中国大学生计算机系统与程序设计竞赛 CCF-CCSP-2017 串行调度(serial)
串行调度(serial) 除等价条件, 根据题意设置限制条件,然后求字典序最小拓扑序. 简洁版 #include<bits/stdc++.h> using namespace std; ; ...
- shell中的字符串操作——字符串的切割
default.yaml {default_baseurl: 'http://10.113.10.68:8082'} test.sh a=`cat default.yaml` t=":&qu ...
- AttributeError: module 'pytest' has no attribute 'allure'
解决 pip3 uninstall pytest-allure-adaptor pip3 install allure-pytest 参考: https://www.cnblogs.com/lansa ...
- 利用 Matplotlib 绘图
各类绘图 ## 导入包 import matplotlib as mpl import matplotlib.pyplot as plt import seaborn as sns ## 参数设置 # ...
- SpringBoot:使用feign调用restful服务时地址栏传参
1.服务提供者(controller层) @GetMapping("/user/{id}") public ApiResult getById(@PathVariable(&quo ...
- quick player运行分析
mac应用从AppController.mm源文件的applicationDidFinishLaunching函数启动: . - (void)applicationDidFinishLaunching ...
- https与http的区别?
https要比http更加安全一些,也就是说http协议是由ssl+http协议构建的可进行加密传输.身份验证的网络协议要比http协议安全 现在大多数的网站都逐渐用https://,因为安全问题太重 ...
- Note for Reidentification by Relative Distance Comparison
link Reidentification by Relative Distance Comparison Challenge: large visual appearance changes cau ...
- DNS基本操作详解
在很多人看来,DNS只是为外部提供DNS解析服务(我以前也是这么认为的,直到膝盖中了一箭),但作为互联网的基础设施,DNS远没有想象的那么简单.如果你没有听说过DNS查询.反向解析.zone传输.动态 ...
- java ali支付服务端对接
引入SDK: <!-- https://mvnrepository.com/artifact/com.aliyun/aliyun-java-sdk-core --><dependen ...