Logstash Reference Getting started with Logstash
进阶功能_Logstash_数据采集_用户指南_日志服务-阿里云 https://help.aliyun.com/document_detail/49025.html
Logstash Reference [6.4] | Elastic https://www.elastic.co/guide/en/logstash/current/index.html
https://opensource.com/article/17/10/logstash-fundamentals
No longer a simple log-processing pipeline, Logstash has evolved into a powerful and versatile data processing tool. Here are basics to get you started.

Logstash, an open source tool released by Elastic, is designed to ingest and transform data. It was originally built to be a log-processing pipeline to ingest logging data into ElasticSearch. Several versions later, it can do much more.
At its core, Logstash is a form of Extract-Transform-Load (ETL) pipeline. Unstructured log data is extracted, filters transform it, and the results are loaded into some form of data store.
Logstash can take a line of text like this syslog example:
and transform it into a much richer datastructure:
"timestamp": "1505157218000",
"host": "vorthys",
"program": "sshd",
"pid": "16998",
"message": "Received disconnect from 192.0.2.11 port 53730:11: disconnected by user",
"sshd_action": "disconnect",
"sshd_tuple": "192.0.2.11:513730"
}
Internal architecture
Logstash has a three-stage pipeline implemented in JRuby:
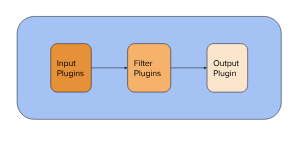
The input stage plugins extract data. This can be from logfiles, a TCP or UDP listener, one of several protocol-specific plugins such as syslog or IRC, or even queuing systems such as Redis, AQMP, or Kafka. This stage tags incoming events with metadata surrounding where the events came from.
The filter stage plugins transform and enrich the data. This is the stage that produces the sshd_action and sshd_tuple fields in the example above. This is where you'll find most of Logstash's value.
The output stage plugins load the processed events into something else, such as ElasticSearch or another document-database, or a queuing system such as Redis, AQMP, or Kafka. It can also be configured to communicate with an API. It is also possible to hook up something like PagerDuty to your Logstash outputs.
Have a cron job that checks if your backups completed successfully? It can issue an alarm in the logging stream. This is picked up by an input, and a filter config set up to catch those events marks it up, allowing a conditional output to know this event is for it. This is how you can add alarms to scripts that would otherwise need to create their own notification layers, or that operate on systems that aren't allowed to communicate with the outside world.
Threads
In general, each input runs in its own thread. The filter and output stages are more complicated. In Logstash 1.5 through 2.1, the filter stage had a configurable number of threads, with the output stage occupying a single thread. That changed in Logstash 2.2, when the filter-stage threads were built to handle the output stage. With one fewer internal queue to keep track of, throughput improved with Logstash 2.2.
If you're running an older version, it's worth upgrading to at least 2.2. When we moved from 1.5 to 2.2, we saw a 20-25% increase in overall throughput. Logstash also spent less time in wait states, so we used more of the CPU (47% vs 75%).
Configuring the pipeline
Logstash can take a single file or a directory for its configuration. If a directory is given, it reads the files in lexical order. This is important, as ordering is significant for filter plugins (we'll discuss that in more detail later).
Here is a bare Logstash config file:
input { }
filter { }
output { }
Each of these will contain zero or more plugin configurations, and there can be multiple blocks.
Input config
An input section can look like this:
syslog {
port => 514
type => “syslog_server”
}
}
This tells Logstash to open the syslog { } plugin on port 514 and will set the document type for each event coming in through that plugin to be syslog_server. This plugin follows RFC 3164 only, not the newer RFC 5424.
Here is a slightly more complex input block:
# Pull in syslog data
input {
file {
path => [
"/var/log/syslog",
"/var/log/auth.log"
]
type => "syslog"
}
}
# Pull in application-log data. They emit data in JSON form.
input {
file {
path => [
"/var/log/app/worker_info.log",
"/var/log/app/broker_info.log",
"/var/log/app/supervisor.log"
]
exclude => "*.gz"
type => "applog"
codec => "json"
}
}
This one uses two different input { } blocks to call different invocations of the file { } plugin: One tracks system-level logs, the other tracks application-level logs. By using two different input { } blocks, a Java thread is spawned for each one. For a multi-core system, different cores keep track of the configured files; if one thread blocks, the other will continue to function.
Both of these file { } blocks could be put into the same input { } block; they would simply run in the same thread—Logstash doesn't really care.
Filter config
The filter section is where you transform your data into something that's newer and easier to work with. Filters can get quite complex. Here are a few examples of filters that accomplish different goals:
filter {
if [program] == "metrics_fetcher" {
mutate {
add_tag => [ 'metrics' ]
}
}
}
In this example, if the program field, populated by the syslog plugin in the example input at the top, reads metrics_fetcher, then it tags the event metrics. This tag could be used in a later filter plugin to further enrich the data.
filter {
if "metrics" in [tags] {
kv {
source => "message"
target => "metrics"
}
}
}
This one runs only if metrics is in the list of tags. It then uses the kv { } plugin to populate a new set of fields based on the key=value pairs in the message field. These new keys are placed as sub-fields of the metrics field, allowing the text pages_per_second=42 faults=0 to become metrics.pages_per_second = 42 and metrics.faults = 0 on the event.
Why wouldn't you just put this in the same conditional that set the tag value? Because there are multiple ways an event could get the metrics tag—this way, the kv filter will handle them all.
metrics tag is run before the conditional that checks for it is important. Here are guidelines to ensure your filter sections are optimally ordered:- Your early filters should apply as much metadata as possible.
- Using the metadata, perform detailed parsing of events.
- In your late filters, regularize your data to reduce problems downstream.
- Ensure field data types get cast to a unified value.
prioritycould be boolean, integer, or string.- Some systems, including ElasticSearch, will quietly convert types for you. Sending strings into a boolean field won't give you the results you want.
- Other systems will reject a value outright if it isn't in the right data type.
- The
mutate { }plugin is helpful here, as it has methods to coerce fields into specific data types.
- Ensure field data types get cast to a unified value.
Here are useful plugins to extract fields from long strings:
- date: Many logging systems emit a timestamp. This plugin parses that timestamp and sets the timestamp of the event to be that embedded time. By default, the timestamp of the event is when it was ingested, which could be seconds, hours, or even days later.
- kv: As previously demonstrated, it can turn strings like
backup_state=failed progress=0.24into fields you can perform operations on. - csv: When given a list of columns to expect, it can create fields on the event based on comma-separated values.
- json: If a field is formatted in JSON, this will turn it into fields. Very powerful!
- xml: Like the JSON plugin, this will turn a field containing XML data into new fields.
- grok: This is your regex engine. If you need to translate strings like
The accounting backup failedinto something that will passif [backup_status] == 'failed', this will do it.- Grok can fill its very own article, so I'll forward you this example from my LISA class and this list of rules for scaling grok.
Output config
Elastic would like you to send it all into ElasticSearch, but anything that can accept a JSON document, or the datastructure it represents, can be an output. Keep in mind that events can be sent to multiple outputs. Consider this example of metrics:
output {
# Send to the local ElasticSearch port, and rotate the index daily.
elasticsearch {
hosts => [
"localhost",
"logelastic.prod.internal"
]
template_name => "logstash"
index => "logstash-{+YYYY.MM.dd}"
}
if "metrics" in [tags] {
influxdb {
host => "influx.prod.internal"
db => "logstash"
measurement => "appstats"
# This next bit only works because it is already a hash.
data_points => "%{metrics}"
send_as_tags => [ 'environment', 'application' ]
}
}
}
Remember the metrics example above? This is how we can output it. The events tagged metrics will get sent to ElasticSearch in their full event form. In addition, the subfields under the metrics field on that event will be sent to influxdb, in the logstash database, under the appstats measurement. Along with the measurements, the values of the environment and application fields will be submitted as indexed tags.
There are a great many outputs. Here are some grouped by type:
- API enpoints: Jira, PagerDuty, Rackspace, Redmine, Zabbix
- Queues: Redis, Rabbit, Kafka, SQS
- Messaging Platforms: IRC, XMPP, HipChat, email, IMAP
- Document Databases: ElasticSearch, MongoDB, Solr
- Metrics: OpenTSDB, InfluxDB, Nagios, Graphite, StatsD
- Files and other static artifacts: File, CSV, S3
There are many more output plugins.
A codec is a special piece of the Logstash configuration. We saw one used on the file {} example above.
# Pull in application-log data. They emit data in JSON form.
input {
file {
path => [
"/var/log/app/worker_info.log",
"/var/log/app/broker_info.log",
"/var/log/app/supervisor.log"
]
exclude => "*.gz"
type => "applog"
codec => "json"
}
}
In this case, the file plugin was configured to use the json codec. This tells the file plugin to expect a complete JSON data structure on every line in the file. If your logs can be emitted in a structure like this, your filter stage will be much shorter than it would if you had to grok, kv, and csv your way into enrichment.
The json_lines codec is different in that it will separate events based on newlines in the feed. This is most useful when using something like the tcp { } input, when the connecting program streams JSON documents without re-establishing the connection each time.
The multiline codec gets a special mention. As the name suggests, this is a codec you can put on an input to reassemble a multi-line event, such as a Java stack dump, into a single event.
input {
file {
path => '/var/log/stackdumps.log'
type => 'stackdumps'
codec => multiline {
pattern => "^\s"
what => previous
}
}
}
This codec tells the file plugin to treat any log line that starts with white space as belonging to the previous line. It will be appended to the message field with a new line and the contents of the log line. Once it hits a log line that doesn't start with white space, it will close the event and submit it to the filter stage.
Warning: Due to the highly distributed nature of Logstash, the multiline codec needs to be run as close to the log source as possible. If it reads the file directly, that's perfect. If the events are coming through another system, such as a centralized syslog system, reassembly into a single event will be more challenging.
Architectures
Logstash can scale from all-in-one boxes up to gigantic infrastructures that require complex event routing before events are processed to satisfy different business owners.
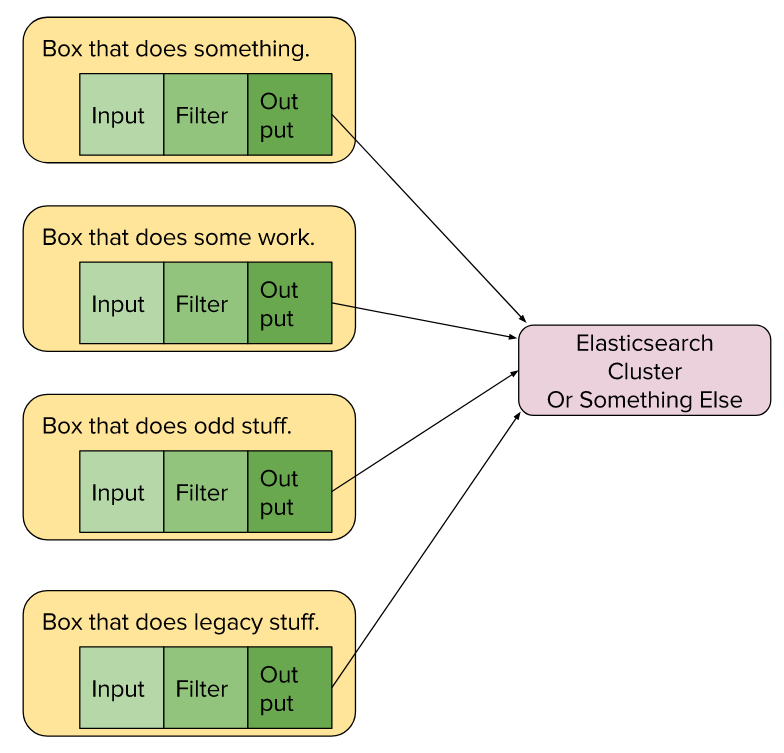
In this example, Logstash is running on each of the four application boxes. Each independent config sends processed events to a centralized ElasticSearch cluster. This can scale quite far, but it means your log-processing resources are competing with your application resources.
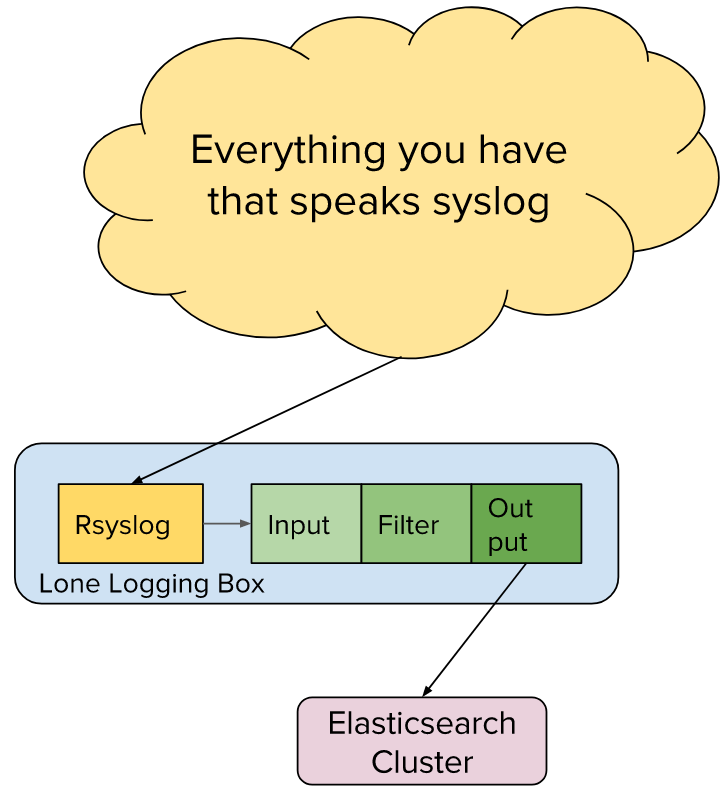
This example shows an existing centralized logging infrastructure based on Syslog that we are adding onto. Here, Logstash is installed on the centralized logging box and configured to consume the file output of rsyslog. The processed results are then sent into ElasticSearch.
Further reading
- An example of a complex logstash config file
- An example of cleaning up field types in the filter stage
Learn more in Jamie Riedesel's talk, S, M, and L Logstash Architectures: The Foundations, at LISA17, which will be held October 29-November 3 in San Francisco, California.
Logstash Reference Getting started with Logstash的更多相关文章
- 构建Logstash+tomcat镜像(让logstash收集tomcat日志)
1.首先pull logstash镜像作为父镜像(logstash的Dockerfile在最下面): 2.构建my-logstash镜像,使其在docker镜像实例化时,可以使用自定义的logstas ...
- logstash快速入门实战指南-Logstash简介
作者其他ELK快速入门系列文章 Elasticsearch从入门到精通 Kibana从入门到精通 Logstash是一个具有实时流水线功能的开源数据收集引擎.Logstash可以动态统一来自不同来源的 ...
- logstash日志分析的配置和使用
logstash是一个数据分析软件,主要目的是分析log日志.整一套软件可以当作一个MVC模型,logstash是controller层,Elasticsearch是一个model层,kibana是v ...
- 使用logstash+elasticsearch+kibana快速搭建日志平台
日志的分析和监控在系统开发中占非常重要的地位,系统越复杂,日志的分析和监控就越重要,常见的需求有: * 根据关键字查询日志详情 * 监控系统的运行状况 * 统计分析,比如接口的调用次数.执行时间.成功 ...
- 【原创】运维基础之Docker(2)通过docker部署zookeeper nginx tomcat redis kibana/elasticsearch/logstash mysql kafka mesos/marathon
通过docker可以从头开始构建集群,也可以将现有集群(配置以及数据)平滑的迁移到docker部署: 1 docker部署zookeeper # usermod -G docker zookeeper ...
- Filebeat+Logstash+ElasticSearch+Kibana搭建Apache访问日志解析平台
对于ELK还不太熟悉的同学可以参考我前面的两篇文章ElasticSearch + Logstash + Kibana 搭建笔记.Log stash学习笔记(一),本文搭建了一套专门访问Apache的访 ...
- logstash日志分析的配置和使用(转)
logstash是一个数据分析软件,主要目的是分析log日志.整一套软件可以当作一个MVC模型,logstash是controller层,Elasticsearch是一个model层,kibana是v ...
- logstash 主题综合篇
一.[logstash-input-file]插件使用详解(配置) logstash input 监听多个目标文件. 二.Logstash Reference(官方参数配置说明)
- Ubuntu 16.04安装Elasticsearch,Logstash和Kibana(ELK)Filebeat
https://www.howtoing.com/how-to-install-elasticsearch-logstash-and-kibana-elk-stack-on-ubuntu-16-04 ...
随机推荐
- git教程,切换分支并拉去
进了目录切换分支: git checkout 5.1 切换完成后拉去分支为: git pull https://www.liaoxuefeng.com/wiki/0013739516305929606 ...
- Vivado 自带IP仿真问题
可以新建一个测试工程,通过IP catalog直接生产IP核,在IP核上右键选择 Open IP Example Design 之后选择生成路径. 启动Run Simulation.
- 通过camera + gallery android上传文件到html
今天做项目的时候遇到一个问题:当html通过js调用input of type file时候,希望android手机的选择器可以同时出现“相机”和“图片”等,但通过下面代码 Intent i = ne ...
- php用explode,可以提供多个字符作为分割符来进行分割数组吗?
explode — 使用一个字符串分割另一个字符串, 它的函数原型如下: array explode ( string $delimiter , string $string [, int $limi ...
- vim插件管理器的安装和配置-windows
# vim插件管理器的安装和配置-windows ### 前言------------------------------ vim做一框功能强大的编辑器,扩展功能令人称奇,插件机制非常灵活- 本篇推荐 ...
- iOS swift跑马灯滚动可以点击
跑马灯,从右至左循环滚动显示信息,并且支持点击事件,使用swift4.0语法完成,更加简介,通用性强,布局部分全部使用snpkit 代码: // // HXQMarqueeView.swift // ...
- iOS开发之-收集的不常用却实用的小方法和技巧
原文链接:http://blog.5ibc.net/p/90386.html 1.颜色转变成图片 - (UIImage *)createImageWithColor:(UIColor *)color ...
- IntelliJ IDEA常用快捷键小结
IntelliJ Idea 常用快捷键列表 Ctrl+Alt+t 选择代码块 try catch Alt+回车 导入包,自动修正Ctrl+N 查找类Ctrl+Shift+N 查找文件Ctrl+Alt+ ...
- awk数组处理字符串合并
需求: 有一文本文件 lessons.txt 内容如下,请使用 awk 处理该文本,并输出内容如 result.txt lessons.txt: 634751 预排 568688 预排 386760 ...
- oracle 手动 备份 恢复
手工备份, 我只考虑全备, 即 control file, redo log file, datafile, password file, spfile(pfile), listener.ora, t ...