P值解释和误区
sklearn实战-乳腺癌细胞数据挖掘(博主亲自录制视频教程)

医药统计项目联系QQ:231469242
P值:观察到极端值的概率

观察到的概率越低,结果就越显著。观察到概率低于P值时,认为足够证据支持H1(显著)
类似于反证法,先假设H0,A和B没有关系
观察到结果概率非常低,几乎不可能发生,推翻原假设H0
H1成立(有显著关系)

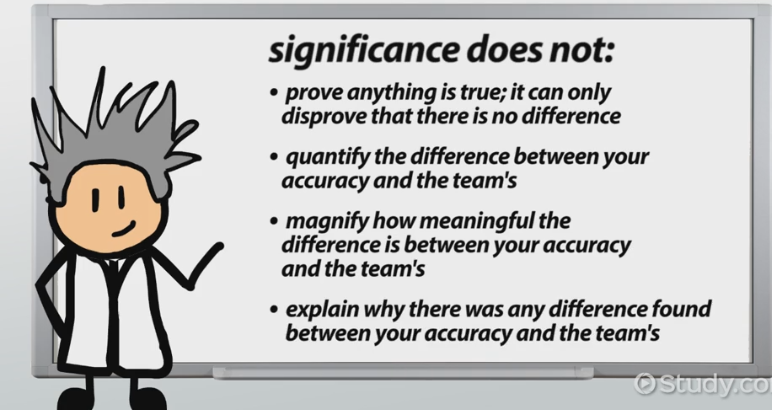
显著性不能证明任何事情是真,而只能拒绝两者没有关系(证明两者有显著关系)
显著性不能量化差异性
显著性不能夸大两者差异性有现实意义
显著性不能解释为什么两者有差异性
P值小于0.05解释(The Interpretation of the p-Value)P值小于0.05:如果H0是真,找到极端值的概率小于5%。不能简单说明H0是假或H1是真
A value of p < 0:05 for the null hypothesis has to be interpreted as follows: If
the null hypothesis is true, the chance to find a test statistic as extreme as or more
extreme than the one observed is less than 5%. This is not the same as saying that
the null hypothesis is false, and even less so, that an alternative hypothesis is true!

http://www.360doc.com/content/15/0704/22/22175932_482657194.shtml


P值误区
In other words, p-values measure evidence for a hypothesis. Unfortunately, they are
often incorrectly viewed as an error probability for rejection of the hypothesis, or,
even worse, as the posterior probability (i.e., after the data have been collected) that
the hypothesis is true. As an example, take the case where the alternative hypothesis
is that the mean is just a fraction of one standard deviation larger than the mean
under the null hypothesis: in that case, a sample that produces a p-value of 0.05 may
just as likely be produced if the alternative hypothesis is true as if the null hypothesis
is true!
P值用于测量H0假设的证据。不幸的事,P值常备误解。例如被误解为拒绝H0 的错误概率或H0成立的概率。


Tests of Significance
Imagine that you want to be the new point guard of your basketball team, but before you try out for the position, you want to make sure you have, pun intended, a real shot at achieving your goal. You shoot 20 free throws and make 12 of them; that's a 60% accuracy rate. You want to know if your accuracy rate, or the observation, is about the same or different than the team's accuracy rate, or the population statistic; enough to replace the old point guard.
You can do a test of significance to ascertain if your accuracy rate is significantly different from that of the team. A significance test measures whether some observed value is similar to the population statistic, or if the difference between them is large enough that it isn't likely to be by coincidence. When the difference between what is observed and what is expected surpasses some critical value, we say there is statistical significance.
P-Value Defined
A standard normal distribution curve represents all of the observations of a single random variable such that the highest point under the curve is where you would expect to find values closest to the mean and values least likely to be observed in the smallest part under the curve.
The p-value is the probability of finding an observed value or a data point relative to all other possible results for the same variable. If the observed value is a value most likely to be found among all possible results, then there is not a statistically significant difference. If, on the other hand, the observed value is a value among unlikely values to be found, then there is a statistically significant difference. The smaller the probability associated with the observed value, the more likely the result is to be significant.
Finding The P-Value
To find the p-value, or the probability associated with a specific observation, you must first calculate the z score, also known as the test statistic.
The formula for finding the test statistic depends on whether the data includes means or proportions. The formulas we'll discuss assume a:
- Single sample significance test
- Normal distribution
- Large sample size.
When dealing with means, the z score is a function of the observed value (x-bar), population mean (mu), standard deviation (s), and the number of the observations (n).
When dealing with proportions, the z score is a function of the observed value (p-hat), proportion observed in the population (p), probability of successful outcome (p), probability of failure (q = 1 - p), and the number of trials (n).
After calculating the z score, you must look up the probability associated with that score on a Standard Normal Probabilities Table. This probability is the p-value or the probability of finding the observed value compared to all possible results. The p-value is then compared to the critical value to determine statistical significance.
The Critical Value
The critical value, or significance level, is established as part of the study design and is denoted by the Greek letter alpha. If we choose an alpha = 0.05, we are requiring an observed data point be so different from what is expected that it would not be observed more than 5% of the time. An alpha equaling 0.01 would be even more strict. In this case, a statistically significant test statistic beyond this critical value has less than a 1 in 100 probability of occurring by chance.
The last step in a significance test is to compare the p-value to alpha to determine statistical significance. If the p-value exceeds the critical value, then we can reject the idea that the observed value was a result found by chance.
What Significance Tells Us
So, let's say your free throw accuracy of 0.6 turns out to have a z score associated with a probability of 0.03 and your alpha is set at 0.05, or p < alpha, then there is a statistically significant difference. We can reject the idea that there is no difference between your accuracy and the accuracy of the team's, and accept the alternative: your shooting accuracy is significantly different from that of the team's.
If, on the other hand, the alpha is set at 0.01, then p > alpha and the result is not statistically significant. In this case, your coaches can say, 'Um, sorry. There simply isn't enough evidence to conclude you are way, way better.'
Significance does not:
- Prove anything is true; it can only disprove that there is no difference
- Quantify the difference between your accuracy and the team's
- Magnify how meaningful the difference is between your accuracy and the team's
- Explain why there was any difference found between your accuracy and the team's
- Ensure you will be made the new point guard
Lesson Summary
A significance test measures whether some observed value is similar to the population statistic or if the difference between the observed value and the population statistic is large enough that it isn't likely to be a coincidence.
The p-value is the probability of finding an observed value or data point relative to all other possible results for the same variable. To find the p-value, you must first calculate the z score, also known as the test statistic. After calculating the z score, look up the probability associated with that score on a Standard Normal Probabilities Table. The last step in a significance test is to compare the p-value to an established critical value, called alpha, to determine statistical significance.
If the p-value is a value most likely to be found among all possible results, then there is not a statistically significant difference. If, on the other hand, the observed value is a value among unlikely values to be found, then there is a statistically significant difference.
P值解释和误区的更多相关文章
- 一段小代码秒懂C++右值引用和RVO(返回值优化)的误区
关于C++右值引用的参考文档里面有明确提到,右值引用可以延长临时变量的周期.如: std::string&& r3 = s1 + s1; // okay: rvalue referen ...
- Flex 布局的各属性取值解释
Flex布局是一种弹性布局.布局样式比较灵活,大多数情况下可以替代float,而且不会脱离文档里流. Flex中定义了两个轴线,一个主轴一个副轴,这个概念你可以想想屏幕坐标系(X轴向右,Y轴向下),F ...
- mybatis insert、update 、delete默认返回值解释与如何设置返回表主键
在使用mybatis做持久层时,insert.update.delete,sql语句默认是不返回被操作记录主键的,而是返回被操作记录条数: 那么如果想要得到被操作记录的主键,可以通过下面的配置方式获取 ...
- 安卓推送——个推服务端api使用误区
首先你需要在个推开放着平台上注册你的应用,以及获得以下几个必要的值APPID |APPKEY | MASTERSECRET,本文假设你已经完成上述步骤以及完成客户端SDK的集成. 原理 个推服务端ap ...
- ES6--闭包数组i的值与var的作用域理解
var a = [];for (var i = 0; i < 10; i++) { a[i] = function () { console.log(i); };}a[6](); // 10 变 ...
- Oracle 数据库字典 sys.obj$ 表中关于type#的解释
sys.obj$ 表是oracle 数据库字典表中的对象基础表,所有对象都在该表中有记录,其中type#字段表明对象类型,比如有一个表 test ,则该对象在sys.obj$ 中存在一条记录,name ...
- 一种根据value解释成枚举的有效方法
有时候需要根据实际情况将某个值解释成一个枚举,而不是根据枚举的名称.如有时0是枚举Gender.MALE的值,1是枚举Gender.FEMALE的值:有时0.1又可以是另一个枚举的值,比如0表示Cer ...
- java 学习第二篇关系运算符和布尔值
关系运算符,顾名思义.用来看什么关系.(也就是用来比较) 看下表 JAVA 关系运算符 a=6,b=5 关系运算符 举例 值 解释 > a>b true a大于b < a<b ...
- .NET Core程序中,如何获取和设置操作系统环境变量的值
有时候我们在.NET Core程序中需要获取和设置操作系统环境变量的值.本文演示如何使用Environment.GetEnvironmentVariable和Environment.SetEnviro ...
随机推荐
- sparkSQL中RDD——DataFrame——DataSet的区别
spark中RDD.DataFrame.DataSet都是spark的数据集合抽象,RDD针对的是一个个对象,但是DF与DS中针对的是一个个Row RDD 优点: 编译时类型安全 编译时就能检查出类型 ...
- CF刷刷水题找自信 2
CF 1114A Got Any Grapes(葡萄)? 题目意思:给三个人分葡萄,三个人对葡萄的颜色有一些要求,问所准备的三种颜色的葡萄能否满足三人的要求. 解题意思:直接按条件判断即可. #in ...
- mac安装php分词工具xunsearch出现找不到bio.h的解决办法
下载xunsearch后安装出现如下错误,在xunsearch官方论坛未找到答案,此方案不仅用于参考解决安装xunsearch,其它编辑安装出现的问题同样可以参考 -n Checking scws . ...
- Java 学习笔记 ------第一章 Java平台概论
本章学习目标: Java版本迁移简介 认识Java SE.Java EE.Java ME 认识JDK规范与操作 了解JVM.JRE与JDK 下载与安装JDK 一.Java版本迁移简介 书上已经表达得非 ...
- 20172305 暑假作业 之 TimeCalculate & Save Iron Man
20172305 暑假作业 之 TimeCalculate & Save Iron Man TimeCalculate 项目介绍 项目名称: TimeCalculate 项目简介: 本项目基于 ...
- 软工实践第八次作业(课堂实战)- 项目UML设计(第五组)
本次作业博客 团队信息 队名:起床一起肝活队 原组长: 白晨曦(101) 原组员: 李麒 (123) 陈德斌(104) 何裕捷(214) 黄培鑫(217) 王焕仁(233) 林志华(128) 乐忠豪( ...
- c语言的知识与能力自评
知识与能力 C语言最早是由美国Bell实验室设计的,主要用作UNIX系统的工作语言,后来发展成为一种通用语言.C与UNIX有密切的关系,C最早是在PDP机器上用UNIX操作系统上开发的,后来又用C语言 ...
- unix系统内核优点
1.可靠性高 unix的可靠性2.伸缩性强 unix的伸缩性3.开放性好 unix的开放性4.网络功能强 unix的网络功能这是UNIX系统的又一重要特色,特别是作为Internet网络技术基础的TC ...
- 未能加载文件或程序集 system.Web.Http.WebHost解决办法。
在csdn中找到一个方法: Update-Package Microsoft.AspNet.WebApi -reinstall 然后就好了. 另外一个方法是缺少哪个dll,就复制一个dll放到bin文 ...
- android入门 — 多线程(一)
android中的一些耗时操作,例如网络请求,如果不能及时响应,就会导致主线程被阻塞,出现ANR,非常影响用户体验,所以一些耗时的操作,我们会想办法放在子线程中去完成. android的UI操作并不是 ...